Comparative Study
. 2017 Apr;65(4):1165-1180.
doi: 10.1002/hep.28953. Epub 2017 Feb 6.

Lipid zonation and phospholipid remodeling in nonalcoholic fatty liver disease

Affiliations
Comparative Study

Lipid zonation and phospholipid remodeling in nonalcoholic fatty liver disease

Zoe Hall et al. Hepatology. 2017 Apr.

Abstract

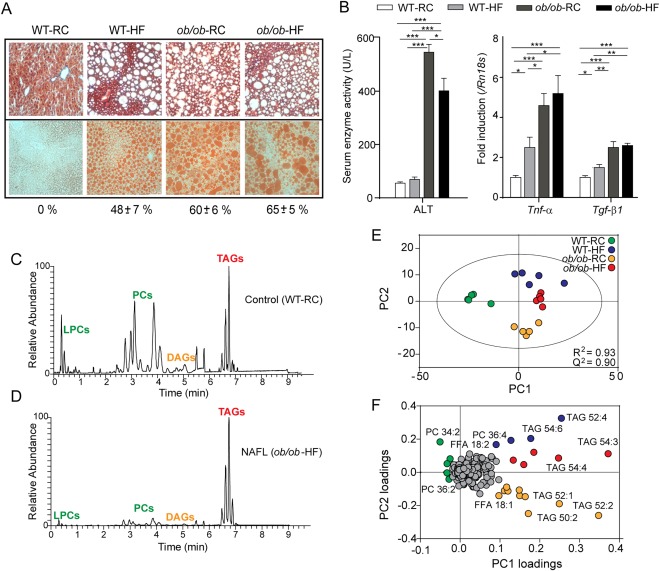
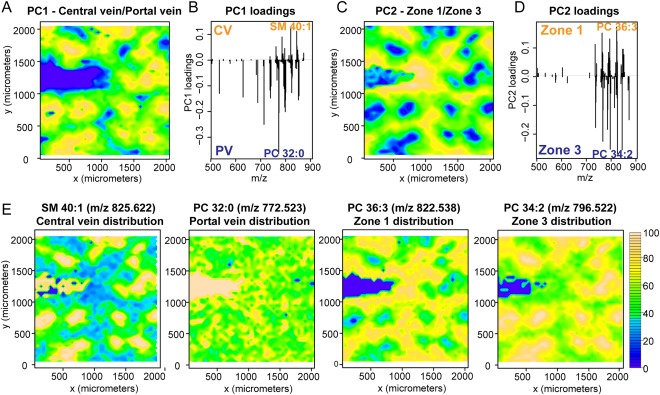
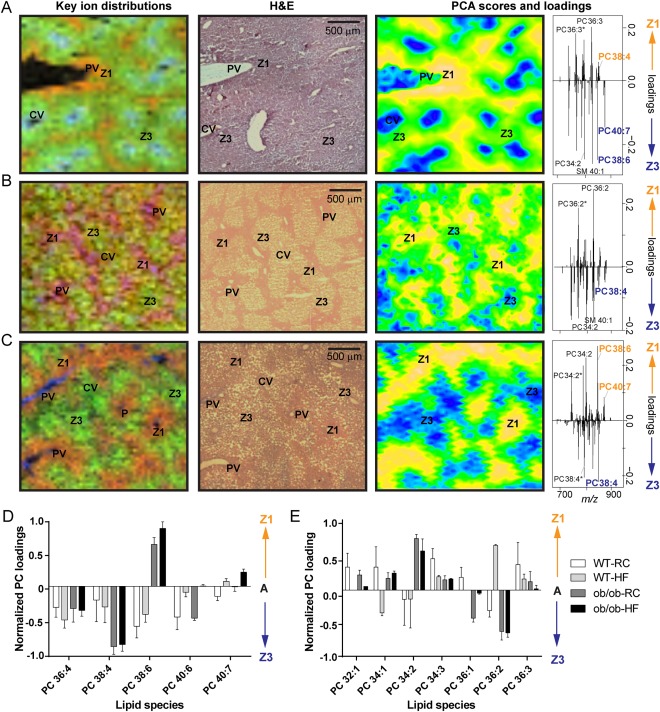
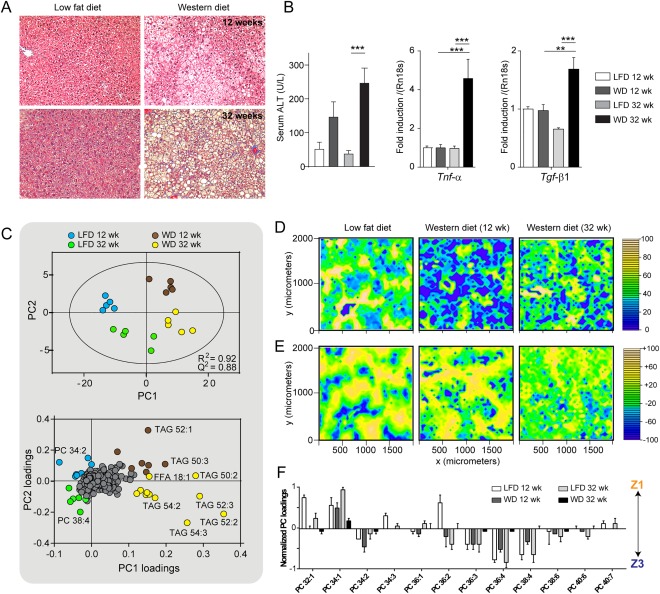
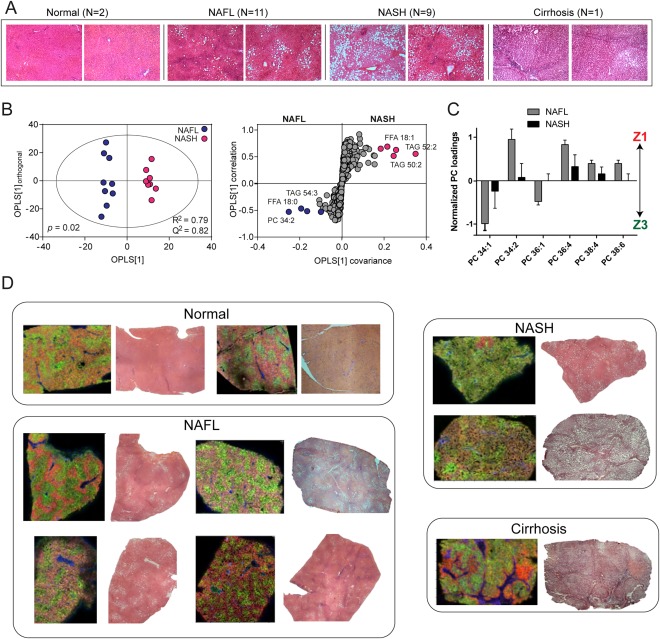
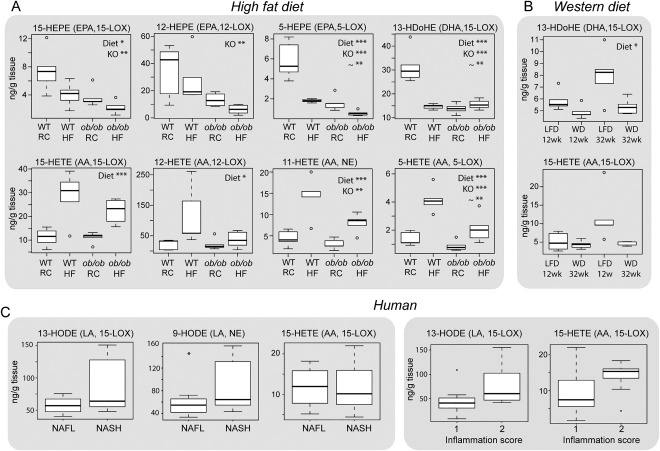
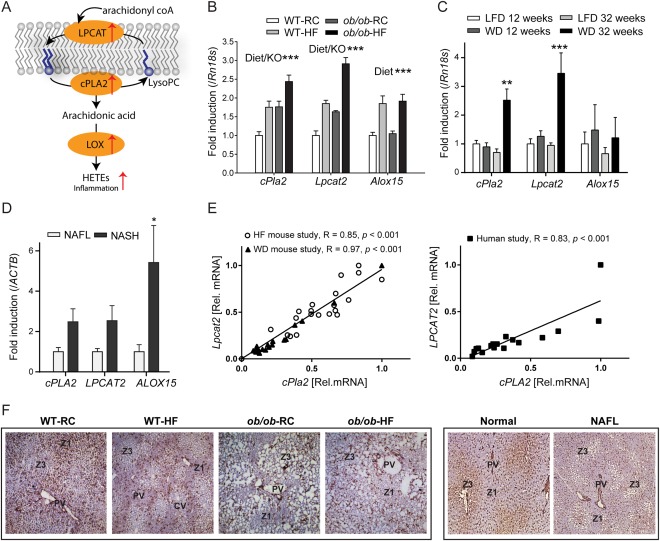
Nonalcoholic fatty liver disease (NAFLD) can progress from simple steatosis (i.e., nonalcoholic fatty liver [NAFL]) to nonalcoholic steatohepatitis (NASH), cirrhosis, and cancer. Currently, the driver for this progression is not fully understood; in particular, it is not known how NAFLD and its early progression affects the distribution of lipids in the liver, producing lipotoxicity and inflammation. In this study, we used dietary and genetic mouse models of NAFL and NASH and translated the results to humans by correlating the spatial distribution of lipids in liver tissue with disease progression using advanced mass spectrometry imaging technology. We identified several lipids with distinct zonal distributions in control and NAFL samples and observed partial to complete loss of lipid zonation in NASH. In addition, we found increased hepatic expression of genes associated with remodeling the phospholipid membrane, release of arachidonic acid (AA) from the membrane, and production of eicosanoid species that promote inflammation and cell injury. The results of our immunohistochemistry analyses suggest that the zonal location of remodeling enzyme LPCAT2 plays a role in the change in spatial distribution for AA-containing lipids. This results in a cycle of AA-enrichment in pericentral hepatocytes, membrane release of AA, and generation of proinflammatory eicosanoids and may account for increased oxidative damage in pericentral regions in NASH.

Conclusion: NAFLD is associated not only with lipid enrichment, but also with zonal changes of specific lipids and their associated metabolic pathways. This may play a role in the heterogeneous development of NAFLD. (Hepatology 2017;65:1165-1180).


Figures

Figure 1
Figure 1
Hepatic lipid signatures in murine NAFL. (A) Increasing steatosis (WT‐RCD < < WT‐HFD < ob/ob‐RCD ≈ ob/ob‐HFD) was assessed using Masson's trichrome staining (top) and quantified (%) using oil red O lipid stain (bottom). Original magnification: × 200. (B) Serum alanine aminotransferase levels were elevated in ob/ob‐RCD and ob/ob‐HFD groups, and a stepwise increase in hepatic mRNA levels for Tnf‐α and Tgf‐β1 was observed in WT‐HFD, ob/ob‐RCD, and ob/ob‐HFD groups. *P < 0.05. **P < 0.01. ***P < 0.001. (C, D) Representative LC‐MS chromatograms are shown for control (WT‐RCD) (C) and NAFL (ob/ob‐HFD) mouse liver (D). (E) Lipids identified by LC‐MS were used to construct principal components models, which clearly distinguish the four groups based on their lipid signatures. (F) The associated loadings plot shows the most important lipids for differentiating groups.
Figure 2
Figure 2
PCA of imaging data reveal liver histology. PCA was employed to evaluate the spatial distribution of lipids, illustrated here for control (WT‐RCD) mouse liver tissue. The PCA scores for the first two principal components were plotted against x and y coordinates (yellow and blue colors indicate the most positive and negative scores, respectively). (A‐D) Contour plots correspond to regional differences in central vein (CV)/portal vein (PV) (A) and zone 1/zone 3 (C). The corresponding loading plots (B, D) represent which lipids (m/z) are most important for differentiating regions. (E) Two‐dimensional single ion distributions for SM(40:1) [M+K+], PC(32:0) [M+K+], PC(36:3) [M+K+], and PC(34:2) [M+K+] show a central vein, portal vein, zone 1, or zone 3 distribution, respectively. The highest intensities are shown in yellow.
Figure 3
Figure 3
Lipid zonation in murine NAFL. Sections of mouse liver tissue were probed by MALDI‐MSI or stained with H&E. Two‐dimensional distributions for key ions (left) and PCA scores plots (right) closely recapitulate liver histology (middle). (A‐C) Key ion distributions show PC(36:3) [M+K+] (red), PC(34:2) [M+K+] (green), and SM(40:1) [M+K+] (blue) for WT‐RCD control mice (A); PC(36:2) [M+K+] (red), PC(34:2) [M+K+] (green), and PC(32:0) [M+K+] (blue) for WT‐HFD mice (B); and PC(38:6) [M+K+] (red), PC(38:4) [M+K+] (green), and PC(32:0) [M+K+] (blue) for ob/ob‐HFD mice (C). Positive and negative PCA scores are associated with zones 1 and 3, respectively (yellow and blue colours indicate the most positive and negative scores, respectively). PCA loadings plots (far right) show the lipids of greatest importance for differentiating zones. Histological features of interest are labeled (CV, central vein; PV, portal vein; Z1, zone 1; Z3, zone 3); m/z peaks labeled with asterisks are fragment ions. (D, E) Zonation for different lipid species was quantified across biological replicates using PC loadings scores.
Figure 4
Figure 4
Lipid changes in a mouse model of NASH. (A) Masson's trichrome staining (magnification × 100) revealed that liver tissue from WT mice on a WD for 12 weeks developed steatosis, and after 32 weeks developed NASH with fibrosis (blue stain). (B) Serum alanine aminotransferase and hepatic transcripts Tnf‐α and Tgf‐β1 were elevated in 32‐week WD mice compared with LFD controls and 12‐week WD mice. **P < 0.01. ***P < 0.001. (C) PCA and corresponding loadings plot for distinguishing the groups based on their hepatic intact lipid profiles determined by LC‐MS. (D) Spatial distribution of SM(40:1) across liver tissue shows increasing delocalization with disease progression. The highest intensity is shown in yellow. (E) Lipid zonation becomes less marked in 32‐week WD mice, as determined by principal component scores. Yellow and blue colors represent the most positive and negative scores, respectively. (F) Quantification of the corresponding principal component loadings show that lipid zonation is almost completely lost with NASH.
Figure 5
Figure 5
Lipid distributions across the human NAFLD spectrum. (A) H&E‐stained sections of human liver tissue for normal liver, NAFL, NASH, and cirrhosis. Original magnification: × 40. (B) Homogenized liver tissue was analyzed by LC‐MS, and the lipidomic profile was used to compare NAFL and NASH groups, revealing increased shorter chain TAGs and FFA(18:1) in NASH. (C) MALDI‐MSI was performed on frozen sections of tissue and quantified, revealing changes to zonation with NASH. (D) Example MS images of tissue covering the spectrum of NAFLD are shown alongside corresponding adjacent H&E sections. Spatial distributions for PC(32:0) (portal vein), PC(36:4) and PC(34:1) are denoted as blue, red, and green, respectively, for normal liver, NAFL, and NASH. Greater intensity of color reflects relative abundance. Whereas PC(36:4) and PC(34:1) are located in zones 1 and 3, respectively, in both normal and NAFL, there is partial to complete loss of zonation in NASH. Cirrhotic tissue, on the other hand, was marked by lipid changes to fibrotic and nodular regions (Supporting Information). Spatial distributions for lipids denoted in blue, red, and green for cirrhosis are PC(32:0), PC(34:1), and PC(34:2), respectively.
Figure 6
Figure 6
Changes to eicosanoid lipid mediators with NAFLD. Decreased n‐3 fatty acid (EPA, DHA)‐derived anti‐inflammatory eicosanoids and increased n‐6 fatty acid (AA)‐derived proinflammatory eicosanoids observed in livers from ob/ob mice and mice on an HFD. (A) Two‐way analysis of variance was performed to assess the contribution of the diet, genotype (KO) and their interaction (∼) to the metabolite changes observed. (B) Similarly, a decrease in n‐3 derived 13‐HDoHE was noted for mice following a WD, whereas no significant difference was determined for the n‐6–derived HETEs. Significantly increased n‐6 LA‐derived proinflammatory HODEs were observed in livers with NASH, compared with livers with NAFL, in human liver tissue. (C) Increased HETEs and HODEs (P < 0.1) were observed in human samples with a higher inflammation score. Data are expressed as the median ± upper/lower quartile. *P < 0.05. **P < 0.01. ***P < 0.001.
Figure 7
Figure 7
(A) Fatty acid remodeling in NAFLD. Group IVA phospholipase (cPLA2) preferentially cleaves PC to release arachidonic acid (AA). AA can then be metabolized by LOX to form eicosanoids, including proinflammatory HETEs. PCs are regenerated by the action of lysophosphatidycholine acyl transferases (LPCAT) on lysophosphatidylcholines (LysoPC). (B) An increase was observed in hepatic mRNA levels for cPla2 and Lpcat2 with HFD and for ob/ob mice (two‐way analysis of variance). Alox15 was significantly increased by HFD‐feeding only. (C) Gene transcripts for cPla2 and Lpcat2 were significantly increased in mice fed a Western diet (WD) for 32 weeks. (D) Similarly, hepatic mRNA levels for cPLA2, LPCAT2, and ALOX15 were all increased in human NASH compared with NAFL. *P < 0.05. **P < 0.01. ***P < 0.001. (E) A striking correlation between Lpcat2 and cPla2 mRNA levels was noted in both mouse and human studies. (F) Immunostaining showed that LPCAT2 protein has a distinct periportal distribution in WT mice, and a pericentral distribution in ob/ob mice and human liver. Original magnification: × 50.

References

    1. Yeh MM, Brunt EM. Pathological features of fatty liver disease. Gastroenterology 2014;147:754‐764. - PubMed
    1. Wree A, Broderick L, Canbay A, Hoffman HM, Feldstein AE. From NAFLD to NASH to cirrhosis‐new insights into disease mechanisms. Nat Rev Gastroenterol Hepatol 2013;10:627‐636. - PubMed
    1. Vacca M, Allison M, Griffin JL, Vidal‐Puig A. Fatty acid and glucose sensors in hepatic lipid metabolism: implications in NAFLD. Semin Liver Dis 2015;35:250‐261. - PubMed
    1. Sanders FWB, Griffin JL. De novo lipogenesis in the liver in health and disease: more than just a shunting yard for glucose. Biol Rev 2016;91:452‐468. - PMC - PubMed
    1. Tilg H, Moschen AR. Evolution of inflammation in nonalcoholic fatty liver disease: the multiple parallel hits hypothesis. Hepatology 2010;52:1836‐1846. - PubMed

Publication types

MeSH terms