. 2016 Nov 18;17(1):938.
doi: 10.1186/s12864-016-3288-8.

The ChIP-Seq tools and web server: a resource for analyzing ChIP-seq and other types of genomic data

Affiliations

The ChIP-Seq tools and web server: a resource for analyzing ChIP-seq and other types of genomic data

Giovanna Ambrosini et al. BMC Genomics. .

Abstract

Background: ChIP-seq and related high-throughput chromatin profilig assays generate ever increasing volumes of highly valuable biological data. To make sense out of it, biologists need versatile, efficient and user-friendly tools for access, visualization and itegrative analysis of such data.

Results: Here we present the ChIP-Seq command line tools and web server, implementing basic algorithms for ChIP-seq data analysis starting with a read alignment file. The tools are optimized for memory-efficiency and speed thus allowing for processing of large data volumes on inexpensive hardware. The web interface provides access to a large database of public data. The ChIP-Seq tools have a modular and interoperable design in that the output from one application can serve as input to another one. Complex and innovative tasks can thus be achieved by running several tools in a cascade.

Conclusions: The various ChIP-Seq command line tools and web services either complement or compare favorably to related bioinformatics resources in terms of computational efficiency, ease of access to public data and interoperability with other web-based tools. The ChIP-Seq server is accessible at http://ccg.vital-it.ch/chipseq/ .

Keywords: Bioinformatics resources; ChIP-seq data analysis; DNA sequence motifs; Genomic context analysis; Histone modifications; Peak finding; Transcription factor binding sites; Web server.


Figures
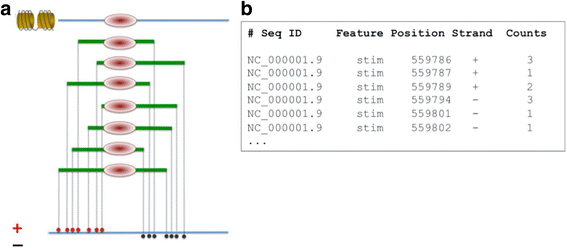
Fig. 1
Fig. 1
ChIP-seq assay and data representation. a Schematic representation of a ChIP-seq experiment. Chromatin is first crosslinked and cut into small pieces. DNA fragments bound by a specific protein are isolated with an antibody and sequenced from the ends using a short-read sequencing technology. The reads are then computationally mapped to the genome. Note that the reads mapping to the plus + and – strand of the genome, respectively, are expected to form clusters upstream and downstream of the protein binding site. b ChIP-seq data representation in SGA format. SGA is the working format of the ChIP-Seq tools. Each line contains five obligatory fields: sequence identifier (here an NCBI RefSeq ID), feature name (designating a ChIP-seq experiment), sequence position, strand and read count. Note that only the genomic position corresponding to the 5′end of the mapped sequence read is recorded in an SGA file
Fig. 2
Fig. 2
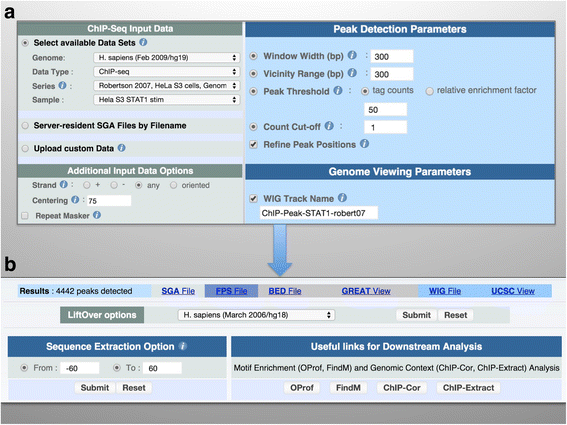
Web interface of ChIP-Peak. a Input form. The inputs correspond to the example presented in this paper. A server-resident ChIP-seq sample from the MGA repository has been selected through the data access menu. Alternately, users could upload their own data by clicking on the “Upload custom data” radio button. b Output page. The peak list can be downloaded in various formats. Hyperlinks are provided for sending the peak list directly to external servers for peak annotation. The “Sequence Extraction Option” enables users to extract sequences around the peak centers in Fasta format. Direct navigation buttons enable downstream analysis with other tools from the ChIP-Seq and SSA servers
Fig. 3
Fig. 3
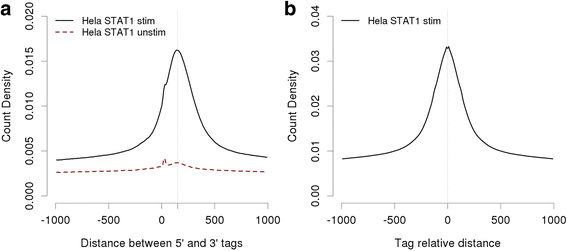
5′-3′end correlation and autocorrelation plots. a 5′-3′ end correlation plot for STAT1 ChIP-seq tags from interferon-γ stimulated and unstimulated HeLa cells. The horizontal position of the peak maximum suggests an average fragment size of about 150 bp. b Autocorrelation plot of 75 bp-centered STAT1 ChIP-seq tags from stimulated cells
Fig. 4
Fig. 4
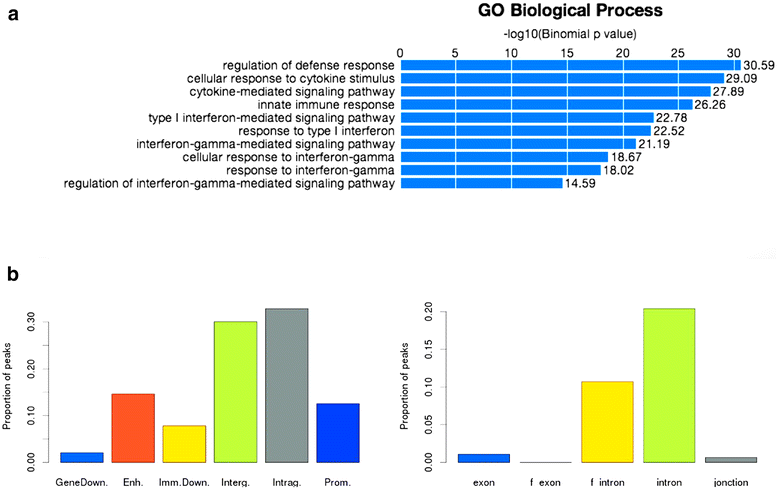
STAT1 peak annotation with external tools. a GO term enrichment analysis with GREAT. b Peak location statistics with Nebula
Fig. 5
Fig. 5
Motif enrichment analysis. a STAT1 consensus sequence (TTCNNNGAA) enrichment in peak lists obtained at various tag thresholds. b Comparisons of peak lists derived with ChIP-Peak from data published in [45] versus peak lists published by ENCODE. Here, consensus sequence enrichment serves as a proxy for enrichment in true binding sites. Note that a fair comparison is only possible between peak lists of similar size. c Comparative evaluation of three alternative STAT1 binding motif descriptions: (i) consensus sequence TTCNNNGAA, (ii) PWM from JASPAR and (iii) MEME-ChIP-derived PWM from the peak regions identified by ChIP-Peak (tag threshold 100)
Fig. 6
Fig. 6
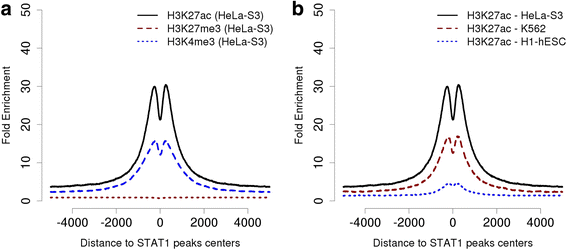
Histone modifications around STAT1 peaks. a Distribution of three histone marks around STAT1 peaks from interferon-γ stimulated HeLa cells. Note that the histone marks have been assayed in non-stimulated HeLa cells where STAT1 is not supposed to bind to any of its genomic target sites. b H3K27ac marks around STAT1 peaks in HeLa and other cell types
Fig. 7
Fig. 7
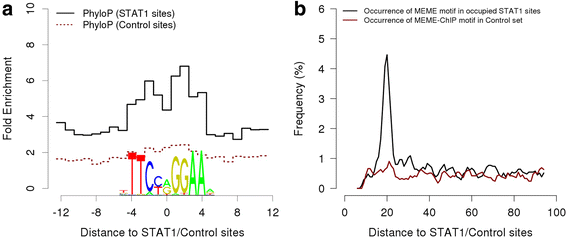
High resolution aggregation plots for in vivo occupied STAT1 sites. a Single-base resolution phyloP profile around STAT1 motifs aligned with the sequence Logo of the JASPAR STAT1 matrix. Note the reduced conservation at the weakly conserved central base of the near-palindromic STAT1 motif. b Occurrence and distance preference of a second STAT1 motif downstream of an in vivo bound motif. The control set consists of motif matches outside STAT1 peak regions. The MEME-ChIP derived PWM was used for this analysis

Similar articles

Cited by

References

    1. Park PJ. ChIP-seq: advantages and challenges of a maturing technology. Nat Rev Genet. 2009;10(10):669–80. doi: 10.1038/nrg2641. - DOI - PMC - PubMed
    1. Furey TS. ChIP-seq and beyond: new and improved methodologies to detect and characterize protein-DNA interactions. Nat Rev Genet. 2012;13(12):840–52. doi: 10.1038/nrg3306. - DOI - PMC - PubMed
    1. Dunham I, Kundaje A, Aldred SF, Collins PJ, Davis C, Doyle F, Epstein CB, Frietze S, Harrow J, Kaul R, et al. An integrated encyclopedia of DNA elements in the human genome. Nature. 2012;489(7414):57–74. doi: 10.1038/nature11247. - DOI - PMC - PubMed
    1. Kundaje A, Meuleman W, Ernst J, Bilenky M, Yen A, Heravi-Moussavi A, Kheradpour P, Zhang Z, Wang J, Ziller MJ, et al. Integrative analysis of 111 reference human epigenomes. Nature. 2015;518(7539):317–30. doi: 10.1038/nature14248. - DOI - PMC - PubMed
    1. Bailey T, Krajewski P, Ladunga I, Lefebvre C, Li Q, Liu T, Madrigal P, Taslim C, Zhang J. Practical guidelines for the comprehensive analysis of ChIP-seq data. PLoS Comput Biol. 2013;9(11):e1003326. doi: 10.1371/journal.pcbi.1003326. - DOI - PMC - PubMed

Publication types