. 2016 Nov 18;16(1):899.
doi: 10.1186/s12885-016-2921-x.

Tanshinone IIA combined with adriamycin inhibited malignant biological behaviors of NSCLC A549 cell line in a synergistic way

Affiliations

Tanshinone IIA combined with adriamycin inhibited malignant biological behaviors of NSCLC A549 cell line in a synergistic way

Jun Xie et al. BMC Cancer. .

Abstract

Background: The study was designed to develop a platform to verify whether the extract of herbs combined with chemotherapy drugs play a synergistic role in anti-tumor effects, and to provide experimental evidence and theoretical reference for finding new effective sensitizers.

Methods: Inhibition of tanshinone IIA and adriamycin on the proliferation of A549, PC9 and HLF cells were assessed by CCK8 assays. The combination index (CI) was calculated with the Chou-Talalay method, based on the median-effect principle. Migration and invasion ability of A549 cells were determined by wound healing assay and transwell assay. Flow cytometry was used to detect the cell apoptosis and the distribution of cell cycles. TUNEL staining was used to detect the apoptotic cells. Immunofluorescence staining was used to detect the expression of Cleaved Caspase-3. Western blotting was used to detect the proteins expression of relative apoptotic signal pathways. CDOCKER module in DS 2.5 was used to detect the binding modes of the drugs and the proteins.

Results: Both tanshinone IIA and adriamycin could inhibit the growth of A549, PC9, and HLF cells in a dose- and time-dependent manner, while the proliferative inhibition effect of tanshinone IIA on cells was much weaker than that of adriamycin. Different from the cancer cells, HLF cells displayed a stronger sensitivity to adriamycin, and a weaker sensitivity to tanshinone IIA. When tanshinone IIA combined with adriamycin at a ratio of 20:1, they exhibited a synergistic anti-proliferation effect on A549 and PC9 cells, but not in HLF cells. Tanshinone IIA combined with adriamycin could synergistically inhibit migration, induce apoptosis and arrest cell cycle at the S and G2 phases in A549 cells. Both groups of the single drug treatment and the drug combination up-regulated the expressions of Cleaved Caspase-3 and Bax, but down-regulated the expressions of VEGF, VEGFR2, p-PI3K, p-Akt, Bcl-2, and Caspase-3 protein. Compared with the single drug treatment groups, the drug combination groups were more statistically significant. The molecular docking algorithms indicated that tanshinone IIA could be docked into the active sites of all the tested proteins with H-bond and aromatic interactions, compared with that of adriamycin.

Conclusions: Tanshinone IIA can be developed as a novel agent in the postoperative adjuvant therapy combined with other anti-tumor agents, and improve the sensibility of chemotherapeutics for non-small cell lung cancer with fewer side effects. In addition, this experiment can not only provide a reference for the development of more effective anti-tumor medicine ingredients, but also build a platform for evaluating the anti-tumor effects of Chinese herbal medicines in combination with chemotherapy drugs.

Keywords: A549; Adriamycin; NSCLC; Synergistic effect; Tanshinone IIA; VEGF/PI3K/Akt signal pathway.


Figures
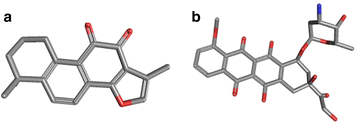
Fig. 1
Fig. 1
The three-dimensional (3D) structure of  tanshinone IIA (a) and ADM (b) (from PubChem compound http://pubchem.ncbi.nlm.nih.gov/)
Fig. 2
Fig. 2
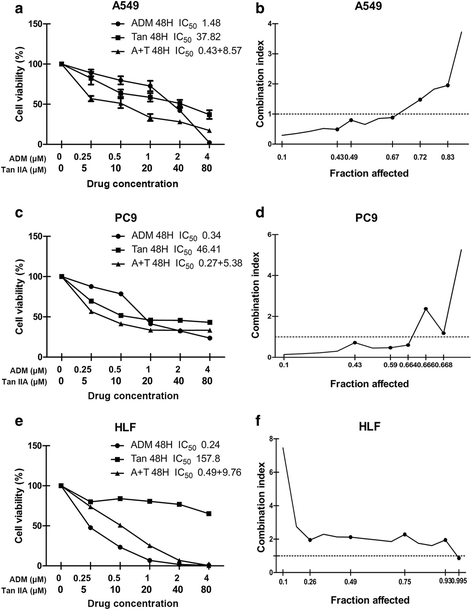
The proliferative inhibition assay of tanshinone IIA, ADM and tanshinone IIA in combination with ADM on A549, PC9, and HLF cell lines. Cells were exposed to various concentrations of tanshinone IIA and ADM alone or in combination at 20:1 molar ratio (tanshinone IIA: ADM) for 48 h. Cell viability curves were plotted as viable cell percentage based on the CCK8 assay (a, c, e). The synergistic effects between drugs were shown as Fa-CI plots calculated with the calcusyn™ software (b, d, f). Each plot (a, c, e) shows the average proliferative inhibition rate of three experiments with triplicate wells. (n = 3, mean ± SD) *P < 0.05, **P < 0.01, or ***P < 0.001 versus the vehicle control
Fig. 3
Fig. 3
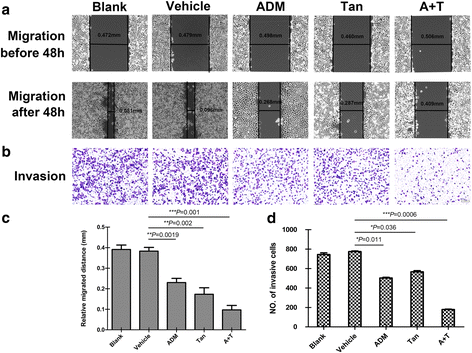
Tanshinone IIA and ADM inhibited migration and invasion of A549 cells. Representative images of wound healing assay (a) and transwell assay (b) after 48 h treatment with 36 μM of tanshinone IIA (48 h IC50 value) and 1.5 μM of ADM (48 h IC50 value) alone or in combination. Bar graphs represent the average migration distance (c) and the number of stained cells (d) respectively, which were calculated from the three independent experiments with ten fields counted per experiment. Data are presented as the means ± SD of three independent experiments. *P < 0.05, **P < 0.01, or ***P < 0.001 versus the vehicle control. (magnification, ×100. Scale bars, 100 μm)
Fig. 4
Fig. 4
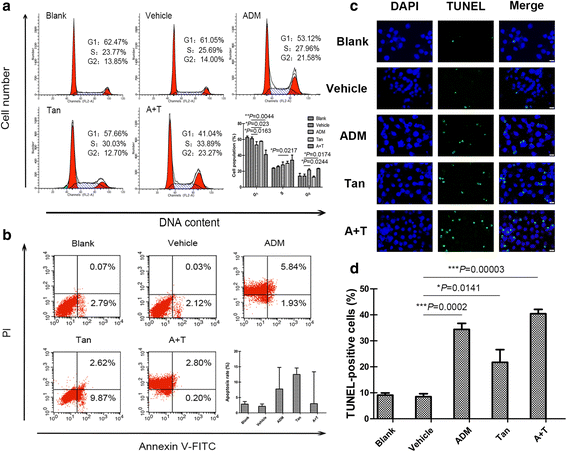
Effect of tanshinone IIA and ADM alone and in combination on the cell cycle arrest and apoptosis induction in A549 cells. The cell cycle distributions after 48 h treatment with 36 μM of tanshinone IIA and 1.5 μM of ADM alone or in combination (a). The apoptosis rate after 48 h treatment with 36 μM of tanshinone IIA and 1.5 μM of ADM alone or in combination (b). Representative photographs of TUNEL staining cells in various groups (c). Histogram of quantification of TUNEL-positive cells was shown with the percentage of TUNEL-positive nuclei (green) relative to DAPI-positive total nuclei (blue) (d). All data represent the mean ± SD of three independent experiments. *P < 0.05, **P < 0.01, or ***P < 0.001 versus the vehicle control
Fig. 5
Fig. 5
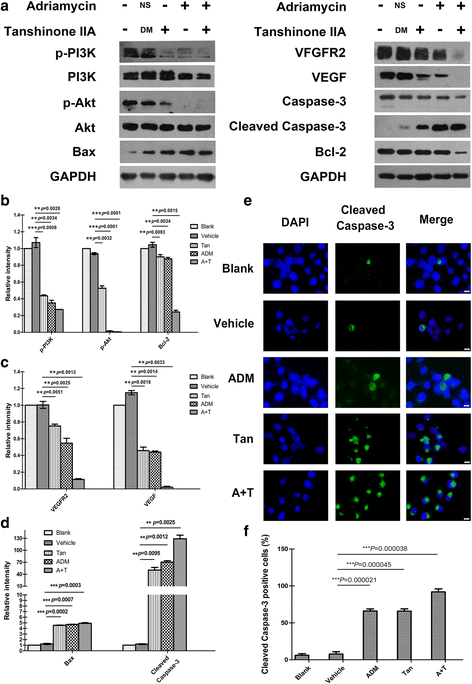
Effect of tanshinone IIA and ADM on the inhibition of VEGF/PI3K/Akt signaling pathway in A549 cells. Figures are the expression levels of VEGF, VEGFR2, PI3K, p-PI3K, Akt, p-Akt, Bcl-2, Bax, Caspase-3, Cleaved Caspase-3, and GAPDH after 48 h treatment with 36 μM of tanshinone IIA and 1.5 μM of ADM alone or in combination (a). The statistical histogram shows the Relative optical density of the tested proteins by Image J (b, c, d). Representative images show the immunofluorescence detection of Cleaved Caspase-3. Cells were stained with an antibody that can recognize Cleaved Caspase-3 (green), and then stained with DAPI (blue) to visualize nuclei (e). The statistical analysis of relative fluorescence intensity shows the expression of Cleaved Caspase-3 in A549 cells (f). Data are presented as the means ± SD of three independent experiments. *P < 0.05, **P < 0.01, or ***P < 0.001 versus the vehicle control. (magnification, ×400, Scale bars, 50 μm)
Fig. 6
Fig. 6
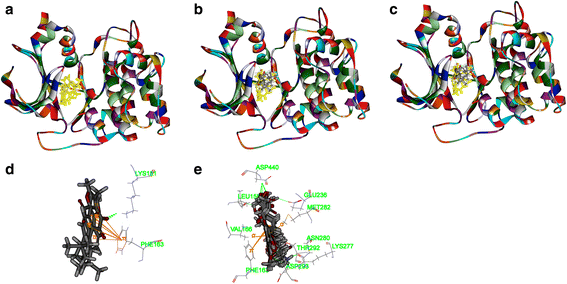
The structure of Akt2 (2JDR) and binding site: Fig. 6a shows the 3D structure of crystal structure of human Akt2 with an endogenous ligand (PDBID:2JDR). The solid ribbon is the 3D structure of crystal structure of human Akt2 with a 2.3 Å resolution. In the centre of 2JDR is an endogenous ligand (yellow) bound in the interface. Figure 6b shows ten poses of tanshinone IIA docked into the endogenous ligand’s (yellow) active site of 2JDR. Figure 6c shows ten poses of ADM docked into the endogenous ligand’s (yellow) active site of 2JDR. Figure 6d shows the binding model of tanshinone IIA in Akt2: at least two residues involved in the interactions in ten random poses, one is Lys181 (H-bond), another is Phe163 (aromatic interactions). Fig. 6e shows the binding model of ADM in Akt2: at least ten residues involved in the interactions in ten random poses, Leu158, Glu236, Lys277, Asp440, Asn280, Thr292 and Asp293 (H-bonds), Phe163, Val166, and Met282 (aromatic interactions).
Fig. 7
Fig. 7
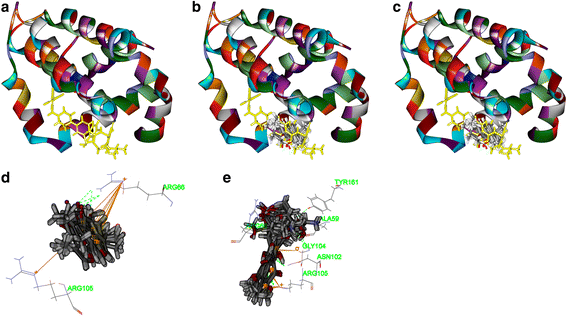
The structure of Bcl2 (4IEH) and binding site: Fig. 7a shows the 3D structure of crystal structure of human Bcl2 with an endogenous ligand (PDBID: 4IEH). The solid ribbon is the 3D structure of crystal structure of human Bcl2 with a 2.1 Å resolution. In the centre of 4IEH is an endogenous ligand (yellow) bound in the interface. Figure 7b shows ten poses of tanshinone IIA docked into the endogenous ligand’s (yellow) active site of 4IEH. Figure 7c shows ten poses of ADM docked into the endogenous ligand’s (yellow) active site. Figure 8d shows the binding model of tanshinone IIA in Bcl-2: at least two residues involved in the interactions in ten random poses, Arg105 (H-bonds), and Arg66 (aromatic interactions). Figure 8e shows the binding model of ADM in Bcl-2: at least six residues involved in the interactions in ten random poses, Ala59, Arg66, Asn102, and Try161 (H-bonds), Gly104, and Arg105 (H-bonds plus aromatic interactions)
Fig. 8
Fig. 8
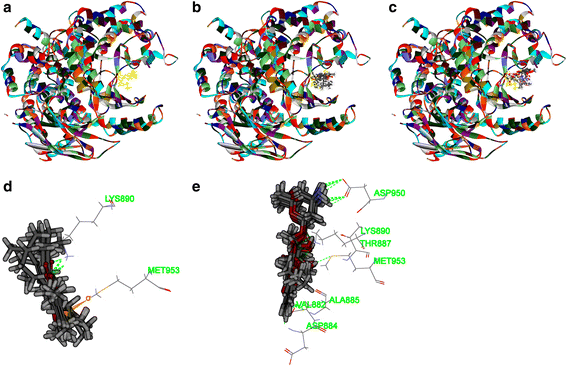
The structure of PI3K (4J6I) and binding site: Fig. 8a shows the 3D structure of crystal structure of human PI3K with an endogenous ligand (PDBID: 4J6I). The solid ribbon is the 3D structure of crystal structure of human PI3K with a 2.9 Å resolution. In the centre of 4J6I is an endogenous ligand (yellow) bound in the interface. Figure 8b shows ten poses of tanshinone IIA docked into the endogenous ligand’s (yellow) active site of 4J6I. Figure 8c shows ten poses of ADM docked into the ligand’s (yellow) active site of 4J6I. Figure 8d shows the binding model of tanshinone IIA in 4J6I: at least two residues involved in the interactions in ten random poses, one is Lys890 (H-bond), another is Met953 (aromatic interaction). Figure 8e shows the binding model of ADM in 4J6I: at least seven residues involved in the interactions, Val882, Ala885, Asp884, Thr887, Lys890, Asp950, and Met953 (H-bonds)
Fig. 9
Fig. 9
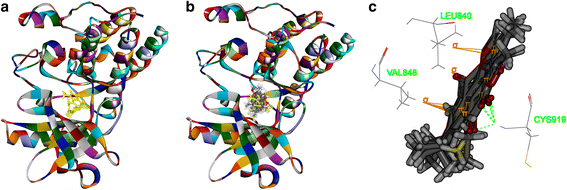
The structure of VEGFR-2 (3VHE) and binding site: Fig. 9a shows the 3D structure of crystal structure of human VEGFR-2 (PDBID: 3VHE). The solid ribbon is the 3D structure of crystal structure of 3VHE with a 1.55 Å resolution. In the center of 3VHE is a kinase domain inhibitor bound in the interface. Figure 9b shows ten poses of tanshinone IIA docked into the endogenous ligand’s (yellow) active site of 3VHE. Figure 9c shows the binding model of tanshinone IIA in 3VHE: at least three residues involved in the interactions, Cys919 (H-bond), Leu840, and Val848 (aromatic interactions)
Fig. 10
Fig. 10
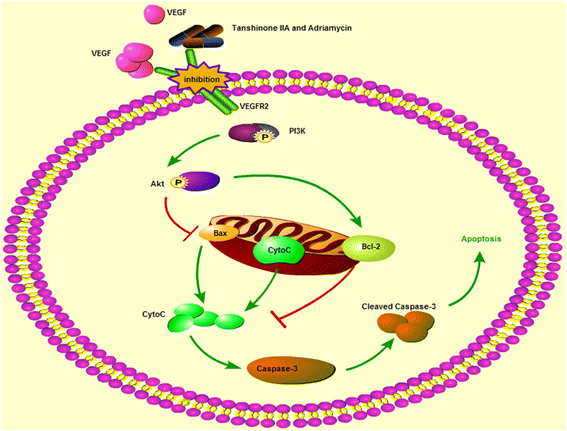
The proposed signal transduction pathway caused by tanshinone IIA and ADM in A549 cells

Similar articles

Cited by

References

    1. Nagel R, Stigter-van Walsum M, Buijze M, van den Berg J, van der Meulen IH, Hodzic J, Piersma SR, Pham TV, Jimenez CR, van Beusechem VW, et al. Genome-wide siRNA Screen Identifies the Radiosensitizing Effect of Downregulation of MASTL and FOXM1 in NSCLC. Mol Cancer Ther. 2015;14(6):1434–1444. doi: 10.1158/1535-7163.MCT-14-0846. - DOI - PubMed
    1. Ling CQ, Yue XQ, Ling C. Three advantages of using traditional Chinese medicine to prevent and treat tumor. J Integr Med. 2014;12(4):331–335. doi: 10.1016/S2095-4964(14)60038-8. - DOI - PubMed
    1. Campelo RG, Massuti B, Mosquera J, Rosell R. 10(th) Congress on Lung Cancer-updates on clinical trials: goal. Transl Lung Cancer Res. 2014;3(2):66–69. - PMC - PubMed
    1. Bunn PA, Jr, Thatcher N. Systemic treatment for advanced (stage IIIb/IV) non-small cell lung cancer: more treatment options; more things to consider. Conclusion. Oncologist. 2008;37(Suppl 1):46. - PubMed
    1. Thorn CF, Oshiro C, Marsh S, Hernandez-Boussard T, McLeod H, Klein TE, Altman RB. Doxorubicin pathways: pharmacodynamics and adverse effects. Pharmacogenet Genomics. 2011;21(7):440–446. doi: 10.1097/FPC.0b013e32833ffb56. - DOI - PMC - PubMed

MeSH terms

LinkOut - more resources