

The role of social position and depressive symptoms in adolescence for life-course trajectories of education and work: a cohort study
- PMID: 27863527
- PMCID: PMC5116205
- DOI: 10.1186/s12889-016-3820-4
The role of social position and depressive symptoms in adolescence for life-course trajectories of education and work: a cohort study
Abstract
Background: While a vast amount of studies confirm the social reproduction of class and status from one generation to the next, less is known about the role of health in the child generation for these processes. Research has shown that particularly mental distress in adolescence is important for future life chances. This study aimed to examine the importance of parental socioeconomic position and depressive symptoms in youth for life-course trajectories of education and labour market attachment among men and women.
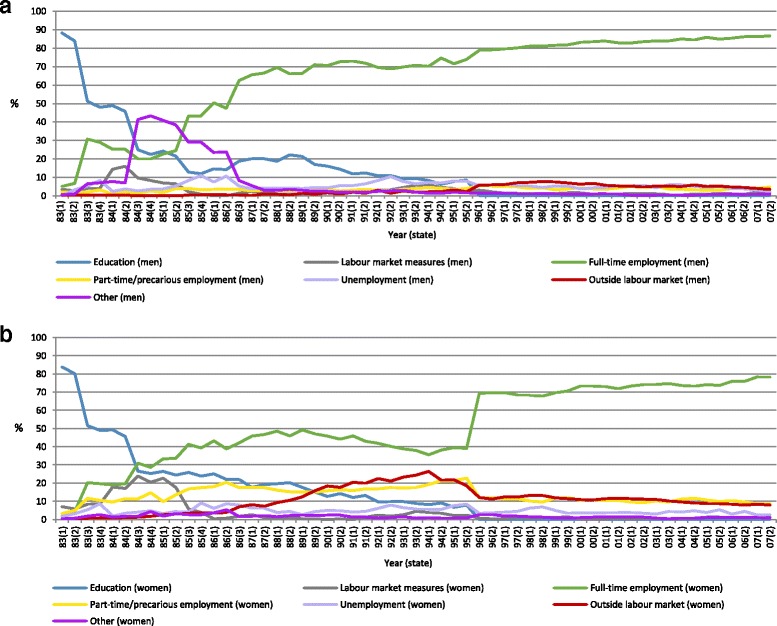
Methods: Based on four waves of questionnaire data from the Northern Swedish Cohort (n = 1,001), consisting of individuals born in 1965, three steps of gender-separate analyses were undertaken. First, the individual trajectories of education and labour market attachment from age 18 to 42 were mapped through sequence analysis. Second, cluster analysis was used to identify typical trajectories. Third, two indicators of parental socioeconomic position - occupational class and employment status - and depressive symptoms at age 16 were used in multinomial regression analyses to predict adult life-course trajectories.
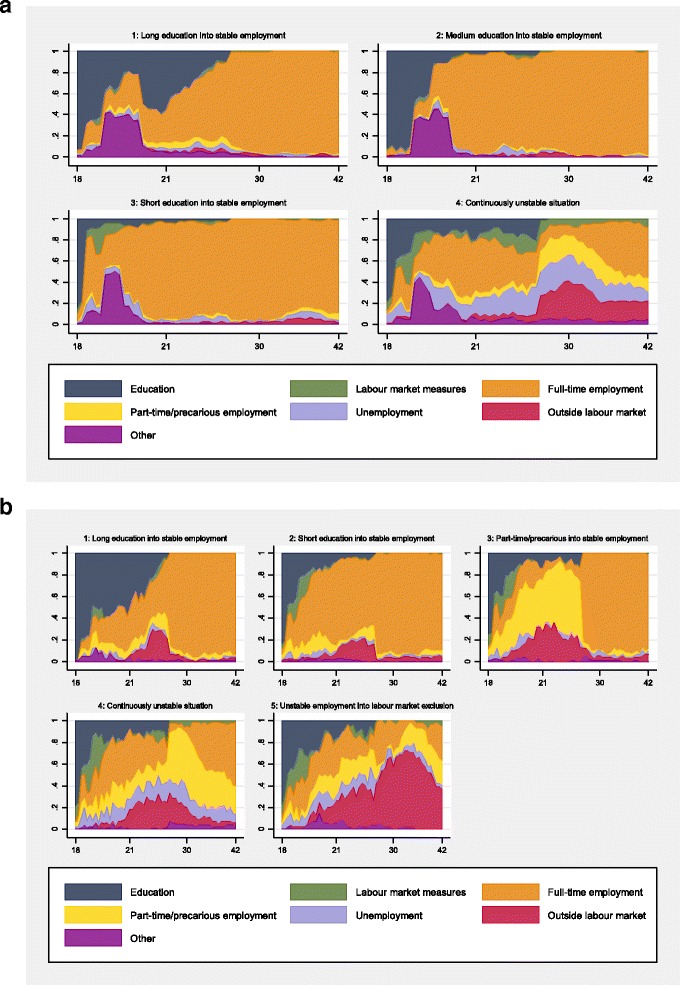
Results: Four typical trajectories were identified for men, of which three were characterised by stable employment and various lengths of education, and the fourth reflected a more unstable situation. Among women, five trajectories emerged, characterised by more instability compared to men. Low parental occupational class and unemployment were significantly associated with a higher risk of ending up in less advantaged trajectories for men while, for women, this was only the case for occupational class. Youth levels of depressive symptoms did not significantly differ across the trajectories.
Conclusions: This study found support for the intergenerational reproduction of social position, particularly when measured in terms of parental occupational class. Youth depressive symptoms did not show clear differences across types of trajectories, subsequently impeding such symptoms to trigger any selection processes. While this could be a consequence of the specific framework of the current study, it may also suggest that depressive symptoms in youth are not a root cause for the more complex processes through which how social position develops across life. The possible impact of welfare and labour market policies is discussed.
Keywords: Depressive symptoms; Life course; Sequence analysis; Social position; Social reproduction; Sweden; Trajectory.
Figures
Similar articles
-
How do labour market conditions explain the development of mental health over the life-course? a conceptual integration of the ecological model with life-course epidemiology in an integrative review of results from the Northern Swedish Cohort.BMC Public Health. 2024 May 15;24(1):1315. doi: 10.1186/s12889-024-18461-6. BMC Public Health. 2024. PMID: 38750531 Free PMC article. Review.
-
Active labour market policies in emerging adulthood may act as a protective factor against future depressiveness: an analysis of the long-term trajectories of depressive symptoms in the Northern Swedish Cohort.Front Public Health. 2024 Apr 9;12:1345034. doi: 10.3389/fpubh.2024.1345034. eCollection 2024. Front Public Health. 2024. PMID: 38655526 Free PMC article.
-
Trajectories of musculoskeletal pain from adolescence to middle age: the role of early depressive symptoms, a 27-year follow-up of the Northern Swedish Cohort.Pain. 2018 Jan;159(1):67-74. doi: 10.1097/j.pain.0000000000001065. Pain. 2018. PMID: 28937577
-
The antecedents and outcomes of persistent and remitting adolescent depressive symptom trajectories: a longitudinal, population-based English study.Lancet Psychiatry. 2021 Dec;8(12):1053-1061. doi: 10.1016/S2215-0366(21)00281-9. Epub 2021 Oct 18. Lancet Psychiatry. 2021. PMID: 34672991
-
Gendered employment trajectories and later life health in liberal regime countries: A quantitative study in the United States, England, Switzerland and Chile.Health Policy. 2025 Feb;152:105216. doi: 10.1016/j.healthpol.2024.105216. Epub 2024 Nov 27. Health Policy. 2025. PMID: 39616888 Review.
Cited by
-
Investigating young adults' mental health and early working life trajectories from a life course perspective: the role of transitions.J Epidemiol Community Health. 2020 Feb;74(2):179-181. doi: 10.1136/jech-2019-213245. Epub 2019 Nov 6. J Epidemiol Community Health. 2020. PMID: 31694872 Free PMC article. Review.
-
How do labour market conditions explain the development of mental health over the life-course? a conceptual integration of the ecological model with life-course epidemiology in an integrative review of results from the Northern Swedish Cohort.BMC Public Health. 2024 May 15;24(1):1315. doi: 10.1186/s12889-024-18461-6. BMC Public Health. 2024. PMID: 38750531 Free PMC article. Review.
-
Psychosocial conditions during school-age as determinants of long-term labour market attachment: a study of the Northern Swedish Cohort from the 1980s to the 2020s.BMC Public Health. 2024 Jan 16;24(1):191. doi: 10.1186/s12889-023-17611-6. BMC Public Health. 2024. PMID: 38229043 Free PMC article.
-
School-to-work and school-to-university transition and health inequalities among young adults: a scoping review.BMJ Open. 2022 Jul 12;12(7):e058273. doi: 10.1136/bmjopen-2021-058273. BMJ Open. 2022. PMID: 35820759 Free PMC article.
-
Young people's labour market patterns and later mental health: A sequence analysis exploring the role of region of origin for young people's labour market trajectories and mental health.SSM Popul Health. 2020 May 29;11:100600. doi: 10.1016/j.ssmph.2020.100600. eCollection 2020 Aug. SSM Popul Health. 2020. PMID: 32548233 Free PMC article.
References
-
- Hilmert S. Analysing Intergenerational Transmissions: From Social Mobility to Social Reproduction. In: Class and Stratification Analysis (Comparative Social Research, Volume 30). edn. Birkelund GE editor: Bingley: Emerald Group Publishing Limited; 2013. p. 131–157.
-
- Erikson R, Goldthorpe JH. Intergenerational inequality: A sociological perspective. J Econ Perspect. 2002;16(3):31–44. doi: 10.1257/089533002760278695. - DOI
-
- Ermisch J, Jäntti M, Smeeding T. From parents to children: The intergenerational transmission of advantage. New York: Russell Sage; 2012.
-
- Solon G. Theoretical models of inequality transmission across multiple generations. Research in Social Stratification and Mobility. 2014;35:13–18. doi: 10.1016/j.rssm.2013.09.005. - DOI
-
- Stansfeld SA, Clark C, Rodgers B, Caldwell T, Power C. Repeated exposure to socioeconomic disadvantage and health selection as life course pathways to mid-life depressive and anxiety disorders. Soc Psychiatry Psychiatr Epidemiol. 2011;46(7):549–558. doi: 10.1007/s00127-010-0221-3. - DOI - PMC - PubMed
MeSH terms
LinkOut - more resources
Full Text Sources
Other Literature Sources
Medical
