

Glycoform analysis of alpha1-acid glycoprotein by capillary electrophoresis
- PMID: 27863712
- PMCID: PMC5147584
- DOI: 10.1016/j.chroma.2016.11.014
Glycoform analysis of alpha1-acid glycoprotein by capillary electrophoresis
Abstract
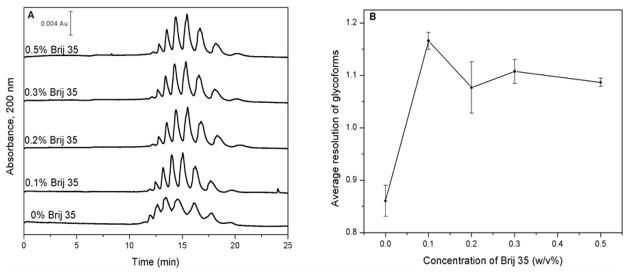
A relatively fast and reproducible CE separation was developed for the glycoform analysis of α1-acid glycoprotein (AGP). Factors that were considered included the pH for this separation and various techniques for coating the capillary and/or to minimize electroosmotic flow and protein adsorption. Optimum resolution of the AGP glycoforms was obtained at pH 4.2 with a running buffer containing 0.1% Brij 35 and by using static and dynamic coatings of PEO on the capillary. These conditions made it possible to separate nine AGP glycoform bands in about 20min. The limit of detection (based on absorbance measurements) ranged from 0.09 to 0.38μM for these AGP glycoform bands, and the linear range extended up to a total AGP concentration of at least 240μM. The migration times for the glycoform bands had typical within-day and day-to-day precisions of ±0.16-0.23% or less, respectively, on a single treated capillary and the variation between capillaries was ±0.56% or less. A charge ladder approach was employed to examine the mass or charge differences in the glycoforms that made up these bands, giving a good fit to a model in which the neighboring bands differed by one charge (e.g., from a sialic acid residue) and had an average mass difference of approximately 0.7-0.9kDa. The approaches used to develop this separation method are not limited to AGP but could be extended to the analysis of other glycoproteins by CE.
Keywords: Alpha(1)-acid glycoprotein; Capillary coating; Capillary electrophoresis; Charge ladder; Glycoform analysis; Glycoproteins.
Copyright © 2016 Elsevier B.V. All rights reserved.
Figures


Similar articles
-
Glycoform analysis of alpha1-acid glycoprotein based on capillary electrophoresis and electrophoretic injection.J Chromatogr A. 2017 Nov 10;1523:114-122. doi: 10.1016/j.chroma.2017.08.032. Epub 2017 Aug 15. J Chromatogr A. 2017. PMID: 28844299 Free PMC article.
-
Glycoform Analysis of Alpha1-Acid Glycoprotein by Capillary Electrophoresis Using Electrophoretic Injection.Methods Mol Biol. 2019;1972:41-56. doi: 10.1007/978-1-4939-9213-3_4. Methods Mol Biol. 2019. PMID: 30847783
-
Capillary electrophoresis of sialic acid-containing glycoprotein. Effect of the heterogeneity of carbohydrate chains on glycoform separation using an alpha1-acid glycoprotein as a model.Anal Chem. 2001 Jun 1;73(11):2640-7. doi: 10.1021/ac001382u. Anal Chem. 2001. PMID: 11403311
-
[Drug binding analysis of human alpha 1-acid glycoprotein using capillary electrophoresis].Yakugaku Zasshi. 2003 Sep;123(9):781-8. doi: 10.1248/yakushi.123.781. Yakugaku Zasshi. 2003. PMID: 14513769 Review. Japanese.
-
Carbohydrate composition and immunomodulatory activity of different glycoforms of alpha1-acid glycoprotein.Glycoconj J. 1997 Aug;14(5):631-8. doi: 10.1023/a:1018544711767. Glycoconj J. 1997. PMID: 9298696 Review.
Cited by
-
Glycoform analysis of alpha1-acid glycoprotein based on capillary electrophoresis and electrophoretic injection.J Chromatogr A. 2017 Nov 10;1523:114-122. doi: 10.1016/j.chroma.2017.08.032. Epub 2017 Aug 15. J Chromatogr A. 2017. PMID: 28844299 Free PMC article.
-
Development of a microcolumn one-site immunometric assay for a protein biomarker: Analysis of alpha1-acid glycoprotein.J Chromatogr A. 2020 Jan 11;1610:460558. doi: 10.1016/j.chroma.2019.460558. Epub 2019 Sep 20. J Chromatogr A. 2020. PMID: 31564560 Free PMC article.
-
Studies of drug interactions with alpha1-acid glycoprotein by using on-line immunoextraction and high-performance affinity chromatography.J Chromatogr A. 2017 Oct 13;1519:64-73. doi: 10.1016/j.chroma.2017.08.073. Epub 2017 Aug 31. J Chromatogr A. 2017. PMID: 28886937 Free PMC article.
-
An Overview of Functionalized Graphene Nanomaterials for Advanced Applications.Nanomaterials (Basel). 2021 Jun 29;11(7):1717. doi: 10.3390/nano11071717. Nanomaterials (Basel). 2021. PMID: 34209928 Free PMC article. Review.
-
Glycoprotein analysis using lectin microcolumns and capillary electrophoresis: Characterization of alpha1-acid glycoprotein by combined separation methods.J Chromatogr B Analyt Technol Biomed Life Sci. 2021 Aug 1;1179:122855. doi: 10.1016/j.jchromb.2021.122855. Epub 2021 Jul 9. J Chromatogr B Analyt Technol Biomed Life Sci. 2021. PMID: 34274643 Free PMC article.
References
-
- Ceciliani F, Pocacqua V. The acute phase protein alpha1-acid glycoprotein: a model for altered glycosylation during diseases. Curr Protein Pept Sci. 2007;8:91–108. - PubMed
-
- Fernandes CL, Ligabue-Braun R, Verli H. Structural glycobiology of human α1-acid glycoprotein and its implications for pharmacokinetics and inflammation. Glycobiol. 2015;25:1125–33. - PubMed
-
- Fournier T, Medjoubi N, Porquet ND. Alpha-1-acid glycoprotein. Biochim Biophys Acta Protein Struct Mol Enzymol. 2000;1482:157–71. - PubMed
-
- Lacunza I, Sanz J, Diez-Masa JC, De Frutos M. CZE of human alpha-1-acid glycoprotein for qualitative and quantitative comparison of samples from different pathological conditions. Electrophoresis. 2006;27:4205–14. - PubMed
-
- Puerta A, Díez-Masa JC, Martín-Álvarez PJ, Martín-Ventura JL, Barbas C, Tuñón J, Egido J, de Frutos M. Study of the capillary electrophoresis profile of intact α-1-acid glycoprotein isoforms as a biomarker of atherothrombosis. Analyst. 2011;136:816–22. - PubMed
MeSH terms
Substances
Grants and funding
LinkOut - more resources
Full Text Sources
Other Literature Sources
