

Microbial Nursery Production of High-Quality Biological Soil Crust Biomass for Restoration of Degraded Dryland Soils
- PMID: 27864178
- PMCID: PMC5244311
- DOI: 10.1128/AEM.02179-16
Microbial Nursery Production of High-Quality Biological Soil Crust Biomass for Restoration of Degraded Dryland Soils
Abstract
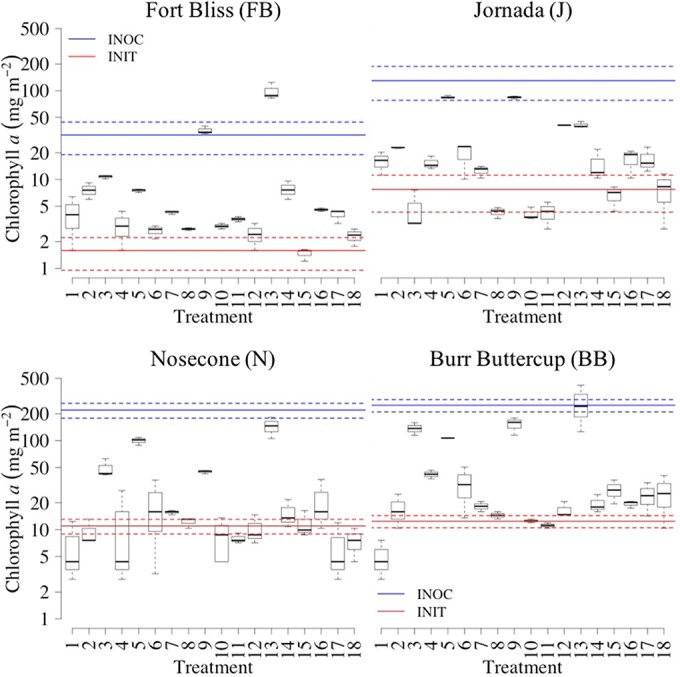
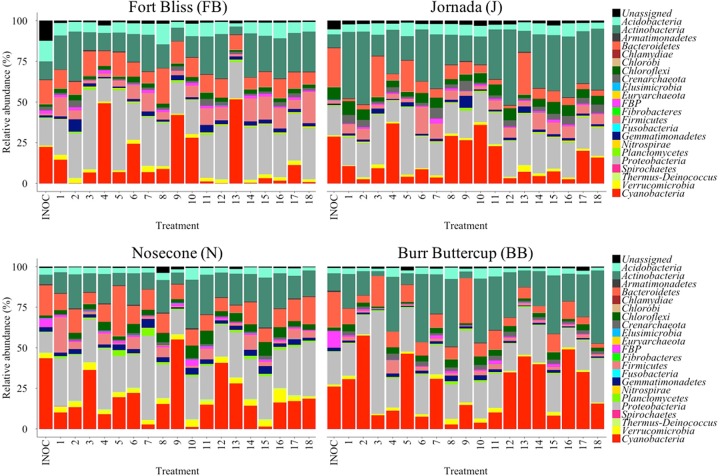
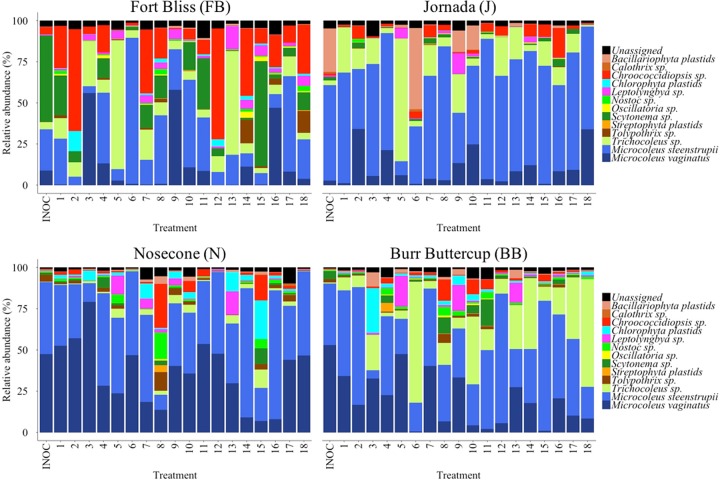
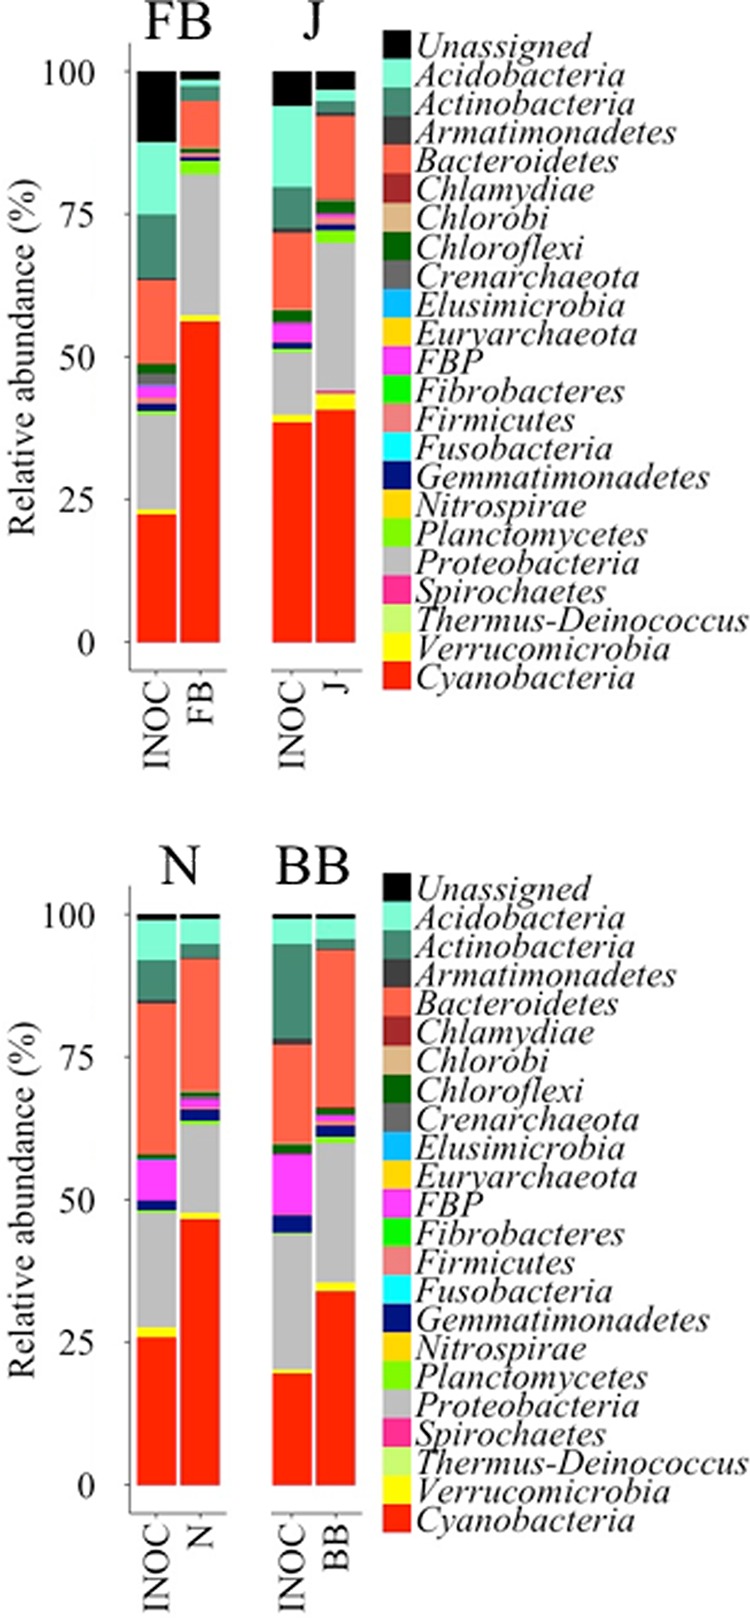
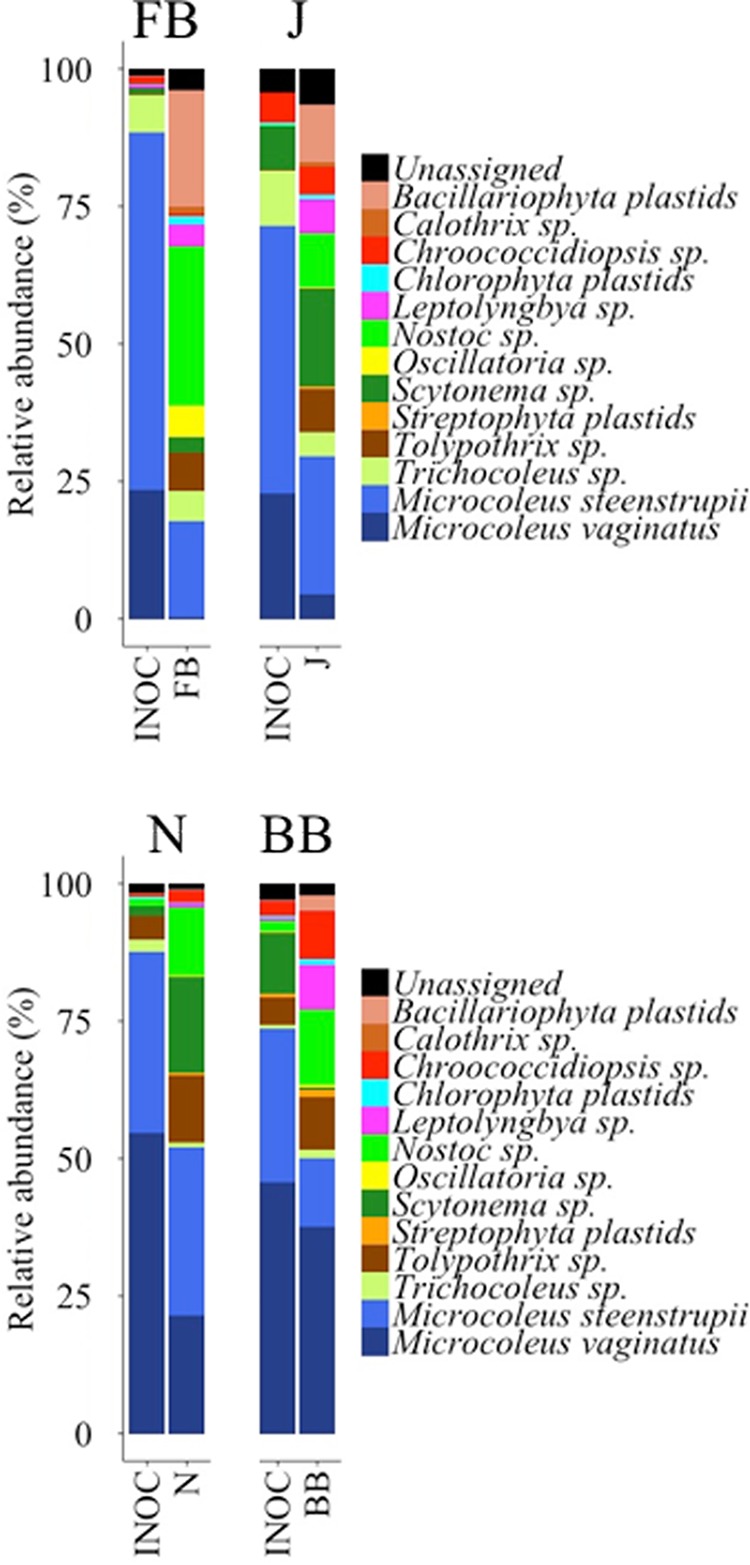
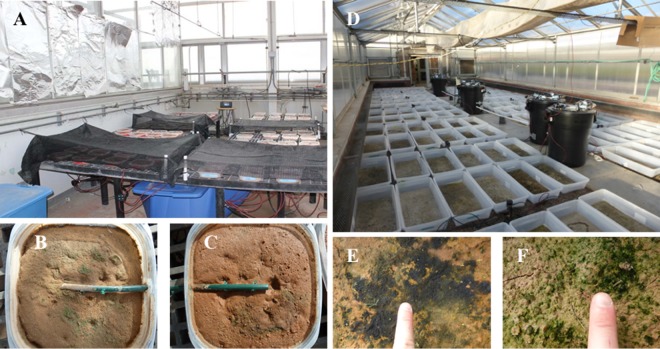
Biological soil crusts (biocrusts) are slow-growing, phototroph-based microbial assemblages that develop on the topsoils of drylands. Biocrusts help maintain soil fertility and reduce erosion. Because their loss through human activities has negative ecological and environmental health consequences, biocrust restoration is of interest. Active soil inoculation with biocrust microorganisms can be an important tool in this endeavor. We present a culture-independent, two-step process to grow multispecies biocrusts in open greenhouse nursery facilities, based on the inoculation of local soils with local biocrust remnants and incubation under seminatural conditions that maintain the essence of the habitat but lessen its harshness. In each of four U.S. Southwest sites, we tested and deployed combinations of factors that maximized growth (gauged as chlorophyll a content) while minimizing microbial community shifts (assessed by 16S rRNA sequencing and bioinformatics), particularly for crust-forming cyanobacteria. Generally, doubling the frequency of natural wetting events, a 60% reduction in sunlight, and inoculation by slurry were optimal. Nutrient addition effects were site specific. In 4 months, our approach yielded crusts of high inoculum quality reared on local soil exposed to locally matched climates, acclimated to desiccation, and containing communities minimally shifted in composition from local ones. Our inoculum contained abundant crust-forming cyanobacteria and no significant numbers of allochthonous phototrophs, and it was sufficient to treat ca. 6,000 m2 of degraded dryland soils at 1 to 5% of the typical crust biomass concentration, having started from a natural crust remnant as small as 6 to 30 cm2 IMPORTANCE: Soil surface crusts can protect dryland soils from erosion, but they are often negatively impacted by human activities. Their degradation causes a loss of fertility, increased production of fugitive dust and intensity of dust storms with associated traffic problems, and provokes general public health hazards. Our results constitute an advance in the quest to actively restore biological soil covers by providing a means to obtain high-quality inoculum within a reasonable time (a few months), thereby allowing land managers to recover essential, but damaged, ecosystem services in a sustainable, self-perpetuating way as provided by biocrust communities.
Keywords: 16S rRNA; biological soil crusts; cyanobacteria; degraded soils; drylands; erosion control; soil microbiome; soil restoration.
Copyright © 2017 American Society for Microbiology.
Figures

Similar articles
-
Optimizing the Production of Nursery-Based Biological Soil Crusts for Restoration of Arid Land Soils.Appl Environ Microbiol. 2019 Jul 18;85(15):e00735-19. doi: 10.1128/AEM.00735-19. Print 2019 Aug 1. Appl Environ Microbiol. 2019. PMID: 31152015 Free PMC article.
-
A Fog-Irrigated Soil Substrate System Unifies and Optimizes Cyanobacterial Biocrust Inoculum Production.Appl Environ Microbiol. 2020 Jun 17;86(13):e00624-20. doi: 10.1128/AEM.00624-20. Print 2020 Jun 17. Appl Environ Microbiol. 2020. PMID: 32358005 Free PMC article.
-
Beneficial Cyanosphere Heterotrophs Accelerate Establishment of Cyanobacterial Biocrust.Appl Environ Microbiol. 2021 Sep 28;87(20):e0123621. doi: 10.1128/AEM.01236-21. Epub 2021 Aug 11. Appl Environ Microbiol. 2021. PMID: 34379492 Free PMC article.
-
What is a biocrust? A refined, contemporary definition for a broadening research community.Biol Rev Camb Philos Soc. 2022 Oct;97(5):1768-1785. doi: 10.1111/brv.12862. Epub 2022 May 18. Biol Rev Camb Philos Soc. 2022. PMID: 35584903 Free PMC article. Review.
-
The Microbiology of Biological Soil Crusts.Annu Rev Microbiol. 2023 Sep 15;77:149-171. doi: 10.1146/annurev-micro-032521-015202. Epub 2023 Apr 17. Annu Rev Microbiol. 2023. PMID: 37068777 Review.
Cited by
-
Optimizing the Production of Nursery-Based Biological Soil Crusts for Restoration of Arid Land Soils.Appl Environ Microbiol. 2019 Jul 18;85(15):e00735-19. doi: 10.1128/AEM.00735-19. Print 2019 Aug 1. Appl Environ Microbiol. 2019. PMID: 31152015 Free PMC article.
-
Spatial segregation of the biological soil crust microbiome around its foundational cyanobacterium, Microcoleus vaginatus, and the formation of a nitrogen-fixing cyanosphere.Microbiome. 2019 Apr 3;7(1):55. doi: 10.1186/s40168-019-0661-2. Microbiome. 2019. PMID: 30944036 Free PMC article.
-
Polyphasic evaluation of key cyanobacteria in biocrusts from the most arid region in Europe.PeerJ. 2019 Jan 3;7:e6169. doi: 10.7717/peerj.6169. eCollection 2019. PeerJ. 2019. PMID: 30627491 Free PMC article.
-
The Compositionally Distinct Cyanobacterial Biocrusts From Brazilian Savanna and Their Environmental Drivers of Community Diversity.Front Microbiol. 2019 Dec 17;10:2798. doi: 10.3389/fmicb.2019.02798. eCollection 2019. Front Microbiol. 2019. PMID: 31921007 Free PMC article.
-
In Living Color: Pigment-Based Microbial Ecology At the Mineral-Air Interface.Bioscience. 2022 Oct 22;72(12):1156-1175. doi: 10.1093/biosci/biac091. eCollection 2022 Dec. Bioscience. 2022. PMID: 36451971 Free PMC article. Review.
References
-
- Prăvălie R. 2016. Drylands extent and environmental issues: a global approach. Earth Sci Rev 161:259–278. doi:10.1016/j.earscirev.2016.08.003. - DOI
-
- Huang J, Yu H, Guan X, Wang G, Guo R. 2016. Accelerated dryland expansion under climate change. Nat Clim Chang 6:166–172.
-
- Belnap J. 2003. The world at your feet: desert biological soil crusts. Front Ecol Environ 1:181–189.
-
- Belnap J, Walker BJ, Munson SM, Gill RA. 2014. Controls on sediment production in two U.S. deserts. Aeolian Res 14:15–24. doi:10.1016/j.aeolia.2014.03.007. - DOI
-
- Field JP, Belnap J, Breshears DD, Neff JC, Okin GS, Whicker JJ, Painter TH, Ravi S, Reheis MC, Reynolds RL. 2010. The ecology of dust. Front Ecol Environ 8:423–430.
MeSH terms
Substances
LinkOut - more resources
Full Text Sources
Other Literature Sources
