. 2017 Feb;27(2):208-222.
doi: 10.1101/gr.212720.116. Epub 2016 Nov 18.

Single-cell transcriptomes identify human islet cell signatures and reveal cell-type-specific expression changes in type 2 diabetes

Affiliations

Single-cell transcriptomes identify human islet cell signatures and reveal cell-type-specific expression changes in type 2 diabetes

Nathan Lawlor et al. Genome Res. 2017 Feb.

Abstract

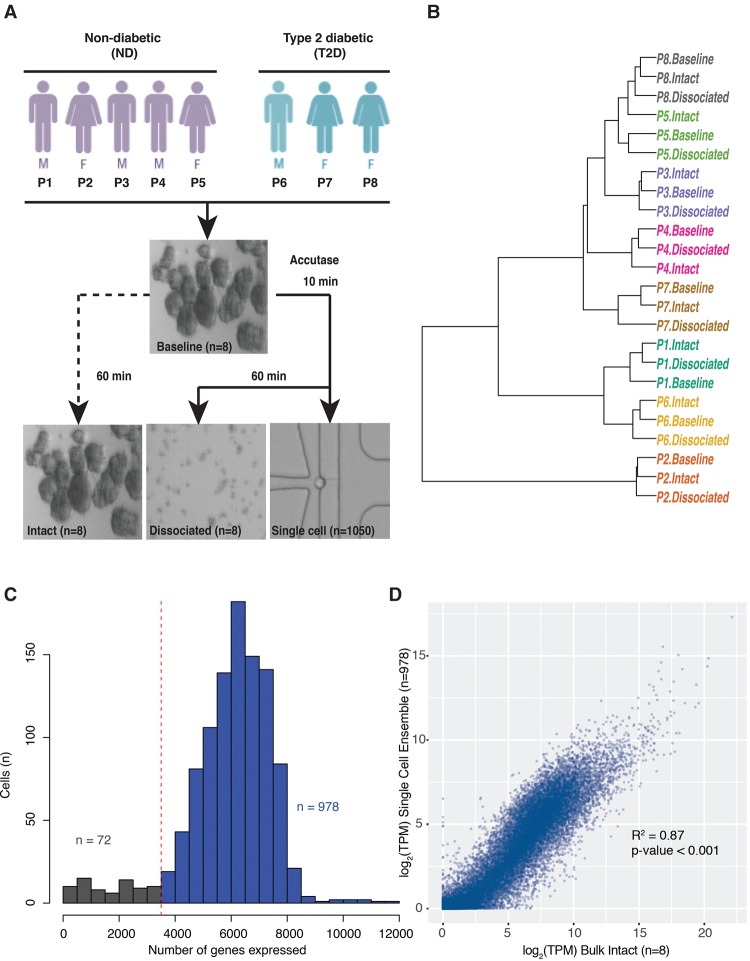
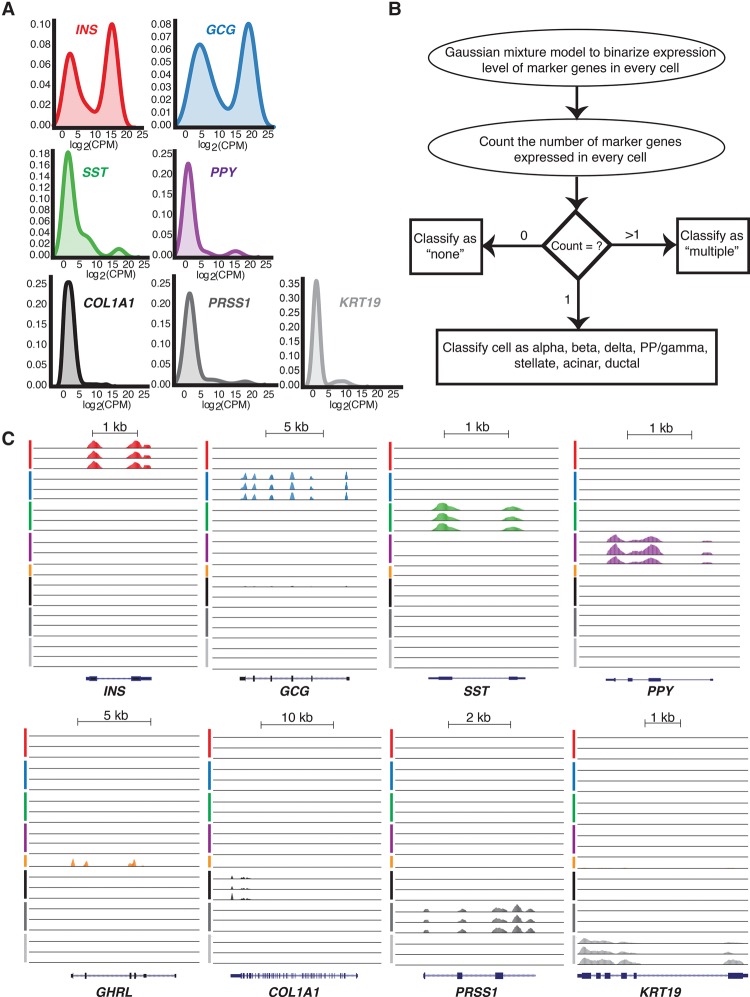
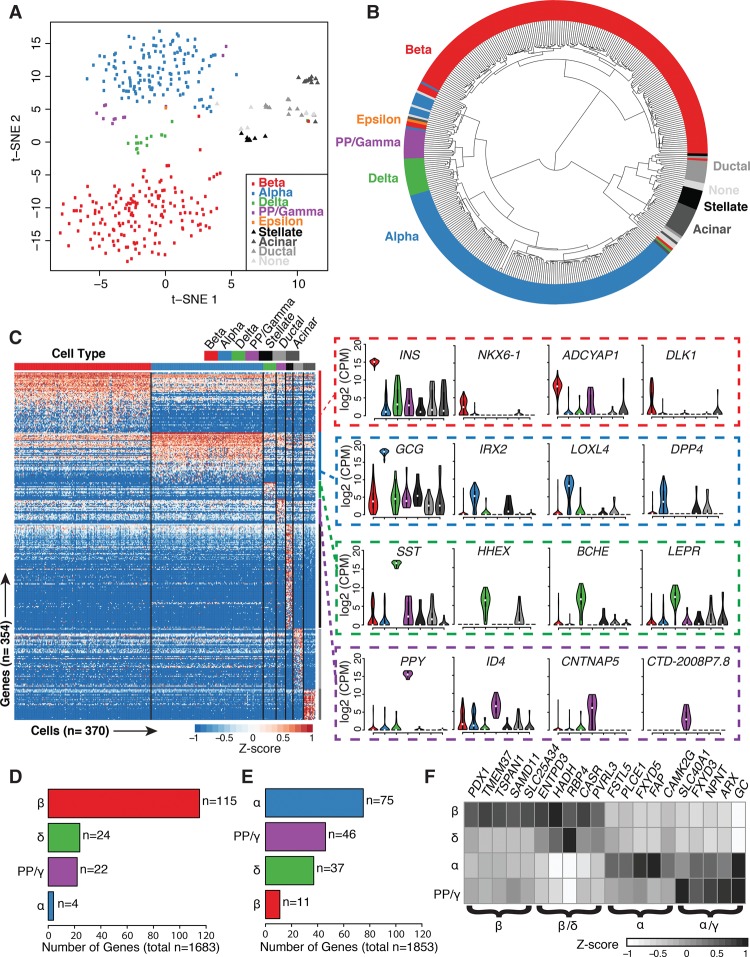
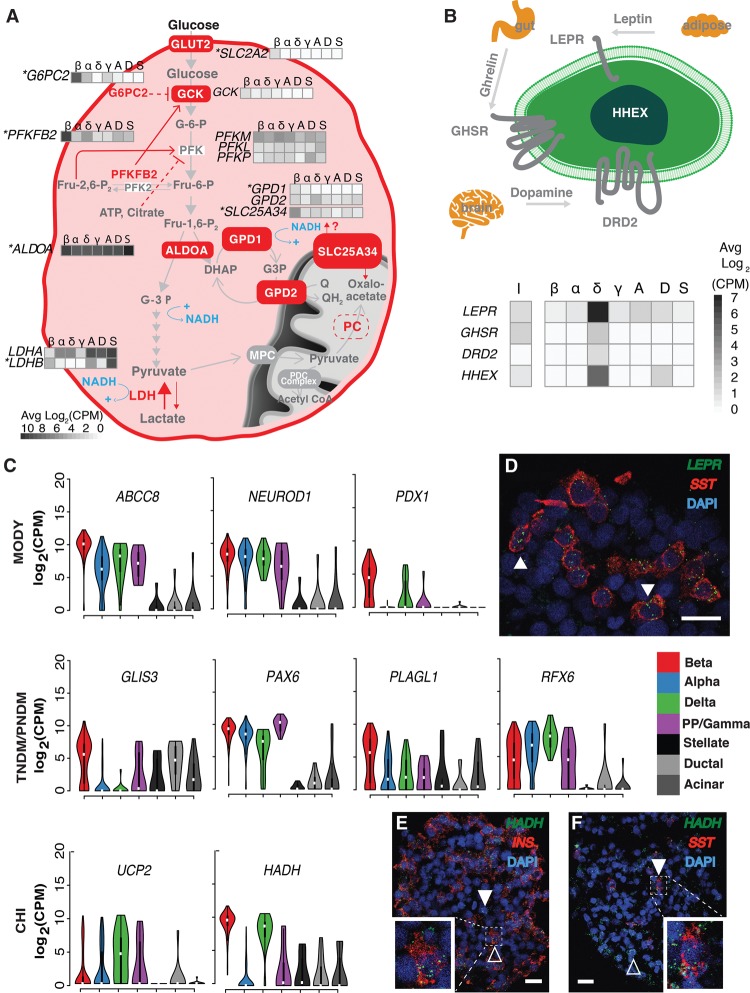
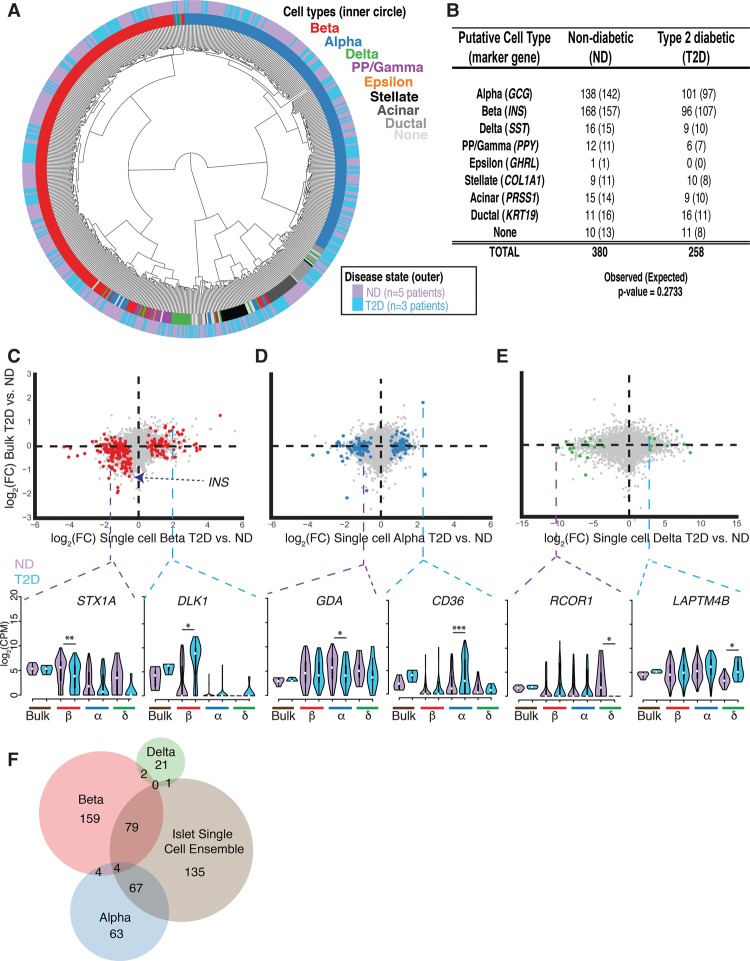
Blood glucose levels are tightly controlled by the coordinated action of at least four cell types constituting pancreatic islets. Changes in the proportion and/or function of these cells are associated with genetic and molecular pathophysiology of monogenic, type 1, and type 2 (T2D) diabetes. Cellular heterogeneity impedes precise understanding of the molecular components of each islet cell type that govern islet (dys)function, particularly the less abundant delta and gamma/pancreatic polypeptide (PP) cells. Here, we report single-cell transcriptomes for 638 cells from nondiabetic (ND) and T2D human islet samples. Analyses of ND single-cell transcriptomes identified distinct alpha, beta, delta, and PP/gamma cell-type signatures. Genes linked to rare and common forms of islet dysfunction and diabetes were expressed in the delta and PP/gamma cell types. Moreover, this study revealed that delta cells specifically express receptors that receive and coordinate systemic cues from the leptin, ghrelin, and dopamine signaling pathways implicating them as integrators of central and peripheral metabolic signals into the pancreatic islet. Finally, single-cell transcriptome profiling revealed genes differentially regulated between T2D and ND alpha, beta, and delta cells that were undetectable in paired whole islet analyses. This study thus identifies fundamental cell-type-specific features of pancreatic islet (dys)function and provides a critical resource for comprehensive understanding of islet biology and diabetes pathogenesis.


Figures

Figure 1.
Figure 1.
Single-cell transcriptomes reflect those of paired intact islets. (A) Schematic of experimental workflow. Islets from each donor sample (n = 8 individuals) were dissociated using Accutase, and single-cell transcriptomes were synthesized from 1050 cells captured using 11 Fluidigm C1 chips. In parallel, “bulk” RNA-seq libraries were prepared from remaining dissociated single cells (dissociated) and from intact islets either flash frozen (baseline) or incubated/processed (intact). (B) Unsupervised hierarchical clustering of baseline, intact, and dissociated islet transcriptomes demonstrates clustering by person and not by processing/experimental condition. (C) Histogram demonstrating the number of genes detected in each single cell. Cells expressing less than 3500 genes (n = 72) were removed from downstream analyses. (D) Scatter plot comparing intact islet bulk RNA-seq (n = 8) and ensemble single-cell RNA-seq (n = 978) data demonstrates high correlation. (R2) Pearson's R-squared; (TPM) transcripts per million; (P) person.
Figure 2.
Figure 2.
Cell-type classification based on marker gene expression. (A) Density plots demonstrating endocrine and exocrine marker gene expression across all single cells. (B) Schematic of the Gaussian mixture model method applied to assign cell-type identity based on marker gene expression. (C) UCSC Genome Browser views of representative single-cell expression profiles of INS, GCG, SST, PPY, and GHRL genes encoding beta, alpha, delta, PP/gamma, and epsilon cell hormones of the endocrine pancreas, respectively, and marker genes for stellate (COL1A1), acinar (PRSS1), and ductal (KRT19) cells of the exocrine pancreas. Line colors indicate putative beta (red), alpha (blue), delta (green), PP/gamma (purple), epsilon (orange), stellate (black), acinar (dark gray), and ductal cells (light gray). (PP) pancreatic polypeptide; (CPM) counts per million.
Figure 3.
Figure 3.
Statistical analysis of nondiabetic single-cell transcriptomes identifies cell-type–specific clusters and defines the signature genes of each islet cell type. (A) Unsupervised analysis of single-cell transcriptomes using t-distributed stochastic neighbor embedding (t-SNE) demonstrates grouping of single islet cell transcriptomes into the major constituent cell types. Respective cell labels and coloring were added after unsupervised analyses. (B) Unsupervised hierarchical clustering illustrates relationships of transcriptome profiles between respective endocrine and exocrine cells. (C) Supervised differential expression analysis of cell types determines cell-specific (signature) genes across all cells (see Methods). Values represent log2(CPM) expression after mean-centering and scaling between −1 and 1. Violin plots of selected signature gene expression are displayed to the right of the heatmap. (D,E) Bar plots depicting the numbers of previously reported beta-specific (D) and alpha-specific (E) genes (Dorrell et al. 2011b; Bramswig et al. 2013; Nica et al. 2013; Blodgett et al. 2015) confirmed to be expressed in each islet cell type after ANOVA and Tukey's honest significant difference (THSD) post-hoc analysis (Methods). (F) Several beta-specific genes demonstrate similar expression levels in delta cells, and alpha-specific genes demonstrate similar expression in PP/gamma cells. Values represent average log2(CPM) expression after mean-centering and scaling between −1 and 1. (β) Beta; (α) alpha; (δ) delta; (γ) PP/gamma cells.
Figure 4.
Figure 4.
Cell-typespecific expression of metabolic, signaling, and diabetes trait genes. (A) Beta cell–specific expression of different isoforms of glycolytic and metabolic intermediate shuttles. Genes marked with an asterisk represent beta cell signature genes. (B) Delta cell–specific expression of neuroactive-ligand receptors and transcription factors. (I) Bulk intact islets; (β) beta; (α) alpha; (δ) delta; (γ) PP/gamma; (A) acinar; (D) ductal; (S) stellate cells. (C) Monogenic diabetes–associated genes and their cell-typespecific expression in islets. Violin plots show the log2(CPM) expression of each gene across cell types. (CHI) congenital hyperinsulinism; (MODY) maturity onset diabetes of the young; (TNDM) transient neonatal diabetes mellitus; (PNDM) permanent neonatal diabetes mellitus. (D) RNA in situ hybridization (ViewRNA, Affymetrix) of OCT-embedded islet sections from donor P3 labeling SST (red), LEPR (green), and nuclei (DAPI; blue). White arrowheads indicate SST+/LEPR+ cells. ViewRNA of OCT-embedded islet sections from donor P4 to detect the following: (E) INS (red), HADH (green), and nuclei (DAPI; blue) and (F) SST (red), HADH (green), and nuclei (DAPI; blue). White arrowheads highlight examples of HADH+/INS (E) and HADH+/SST+ (F) cells. Hollow arrowheads highlight HADH+/INS+ (E) and HADH+/SST (F) cells. In DF, solid horizontal white lines indicate scale bars of 20 μm. In E and F, white dashed lines highlight a cell either co-expressing (E) INS/HADH or (F) SST/HADH. White squares in the bottom left of E and bottom right of F indicate magnified images of the cells highlighted in respective dashed white boxes.
Figure 5.
Figure 5.
Single-cell transcriptome analyses identify cell-type–specific expression changes in T2D islets. (A) T2D and ND single-cell transcriptomes cluster together by cell type after unsupervised hierarchical clustering. (B) Number of each ND and T2D cell type classified by marker gene expression as shown in Figure 2. The numbers of cells expected in each condition based on a χ2 test are indicated in parentheses. (CE, top) Scatter plots of log2 fold-change (FC) expression detected between T2D and ND samples from bulk intact RNA-seq (y-axis) and from Fluidigm C1 single-cell RNA-seq (x-axis) from beta cells (left plot; red), alpha cells (middle plot; blue), and delta cells (right plot; green). (Bottom) Violin plots highlight examples of differentially expressed genes in one single-cell type. Dashed purple lines represent repressed genes in the respective T2D cell type, while dashed blue lines represent induced genes. (*) FDR < 0.05, (**) FDR < 0.01, (***) FDR < 0.001. (F) Venn diagram showing the intersections of differentially expressed genes identified between T2D and ND transcriptomes at single-cell-type and islet single-cell ensemble resolution. The islet single-cell ensemble represents the pooled collection of beta, alpha, delta, and PP/gamma single cells.

References

    1. Abdallah BM, Ditzel N, Laborda J, Karsenty G, Kassem M. 2015. DLK1 regulates whole-body glucose metabolism: a negative feedback regulation of the osteocalcin-insulin loop. Diabetes 64: 3069–3080. - PubMed
    1. Alkhatatbeh MJ, Enjeti AK, Acharya S, Thorne RF, Lincz LF. 2013. The origin of circulating CD36 in type 2 diabetes. Nutr Diabetes 3: e59. - PMC - PubMed
    1. Andersson SA, Olsson AH, Esguerra JL, Heimann E, Ladenvall C, Edlund A, Salehi A, Taneera J, Degerman E, Groop L, et al. 2012. Reduced insulin secretion correlates with decreased expression of exocytotic genes in pancreatic islets from patients with type 2 diabetes. Mol Cell Endocrinol 364: 36–45. - PubMed
    1. Arda HE, Li L, Tsai J, Torre EA, Rosli Y, Peiris H, Spitale RC, Dai C, Gu X, Qu K, et al. 2016. Age-dependent pancreatic gene regulation reveals mechanisms governing human β cell function. Cell Metab 23: 909–920. - PMC - PubMed
    1. Bader E, Migliorini A, Gegg M, Moruzzi N, Gerdes J, Roscioni SS, Bakhti M, Brandl E, Irmler M, Beckers J, et al. 2016. Identification of proliferative and mature β-cells in the islets of Langerhans. Nature 535: 430–434. - PubMed

Publication types

MeSH terms

Substances