. 2017 Mar;31(3):904-909.
doi: 10.1096/fj.201601004R. Epub 2016 Nov 18.

Mitochondrial and redox abnormalities in autism lymphoblastoid cells: a sibling control study

Affiliations

Mitochondrial and redox abnormalities in autism lymphoblastoid cells: a sibling control study

Shannon Rose et al. FASEB J. 2017 Mar.

Abstract

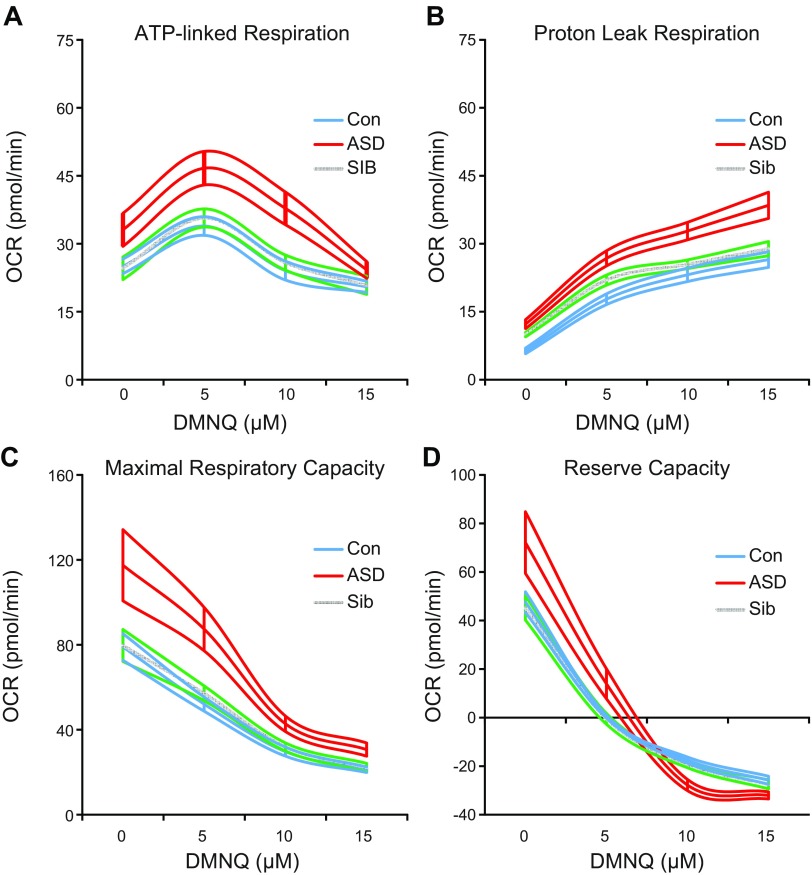
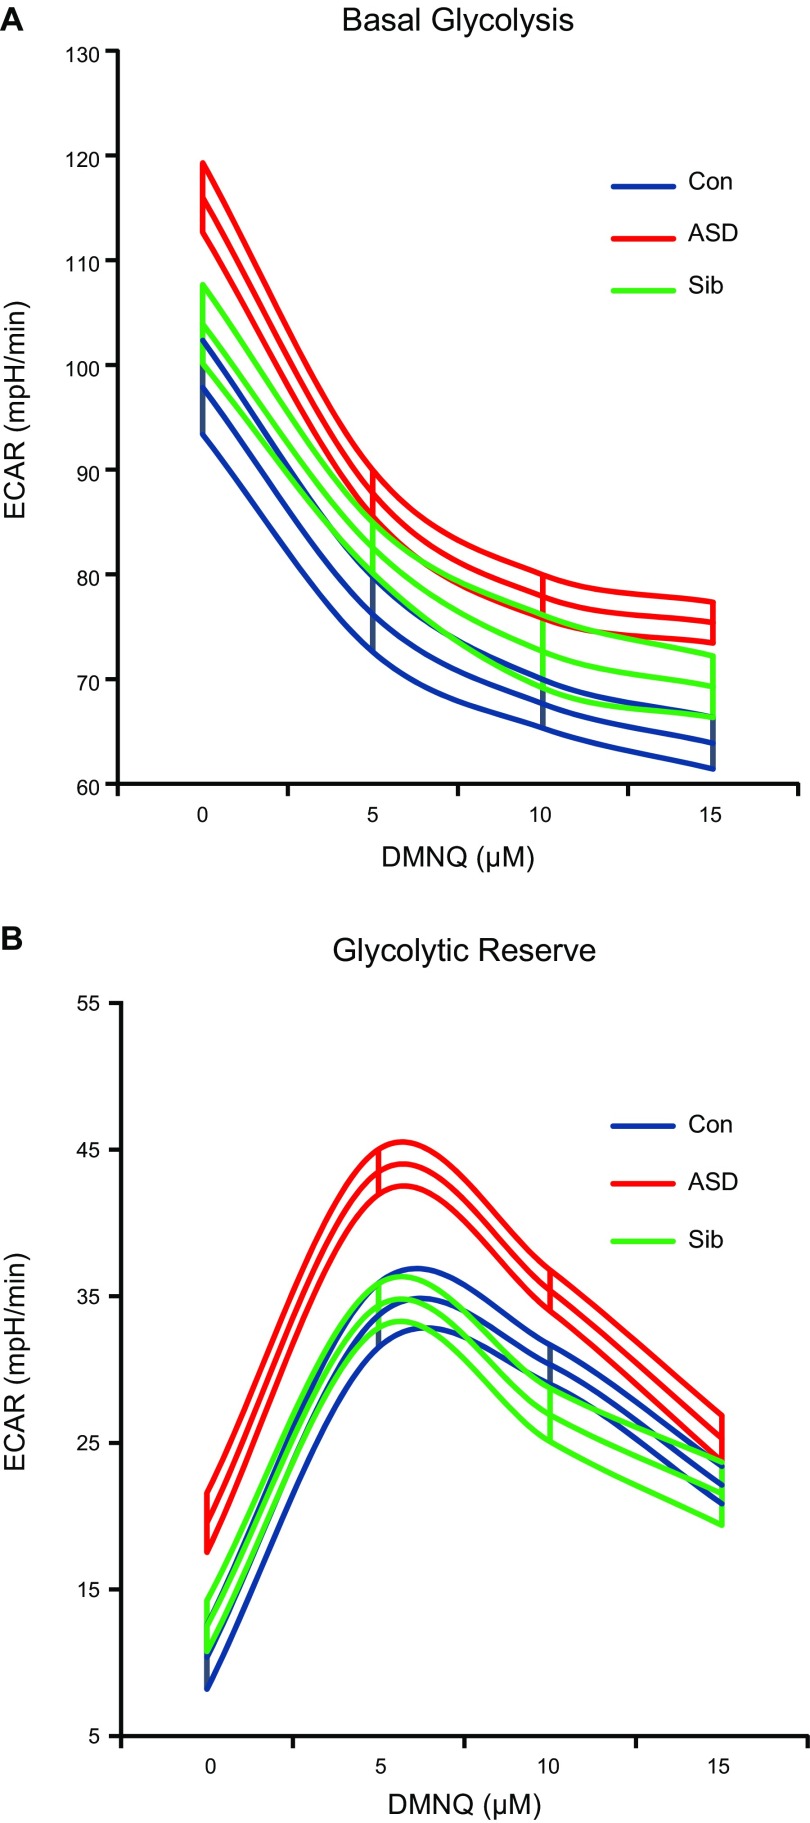
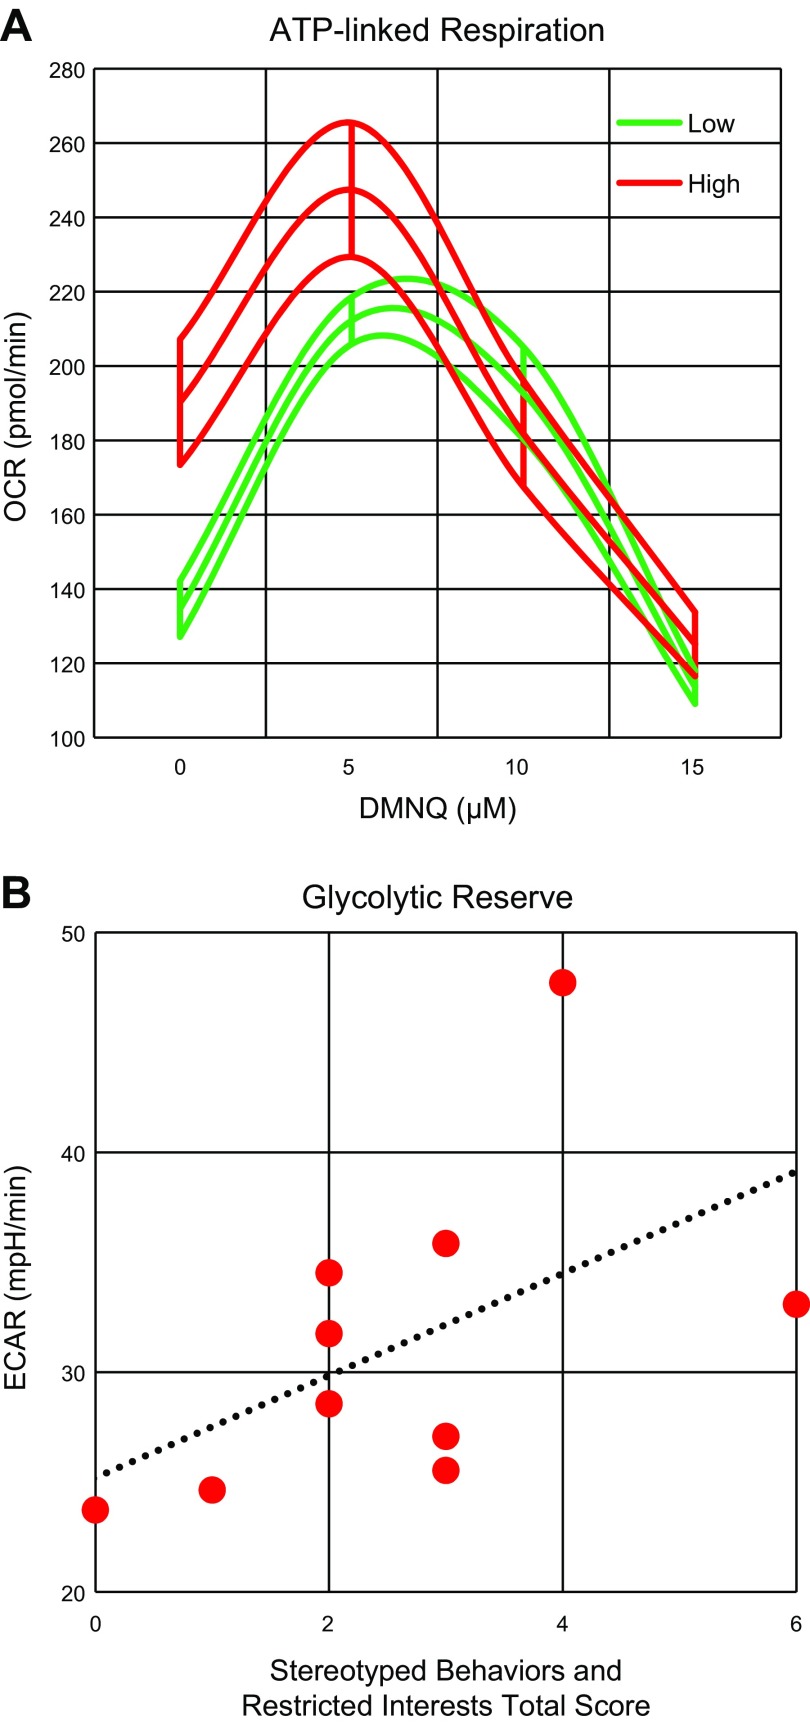
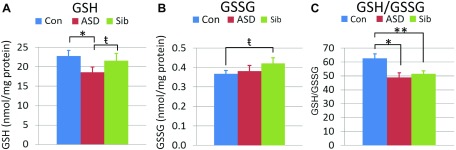
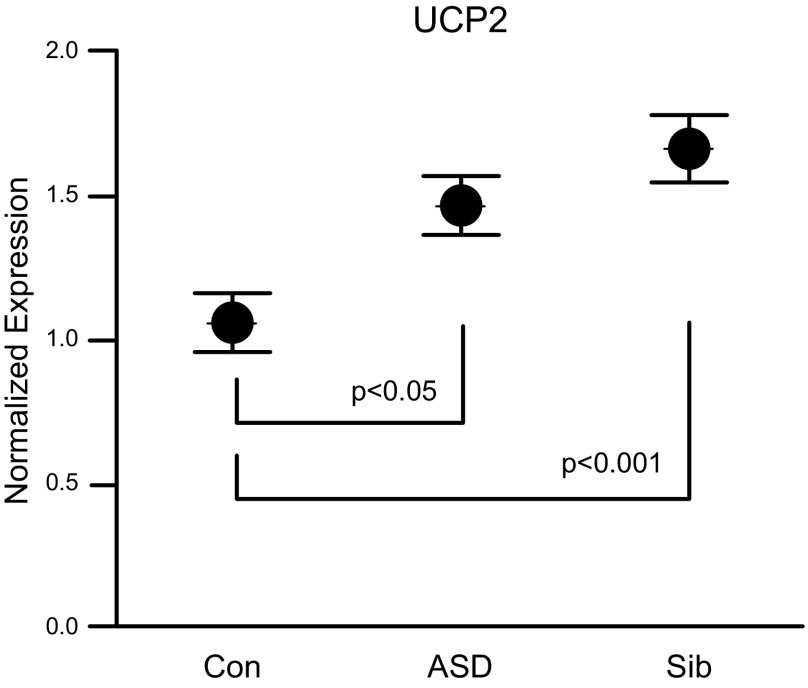
Autism spectrum disorder (ASD) is associated with physiological abnormalities, including abnormal redox and mitochondrial metabolism. Lymphoblastoid cell lines (LCLs) from some children with ASD exhibit increased oxidative stress, decreased glutathione redox capacity, and highly active mitochondria with increased vulnerability to reactive oxygen species (ROS). Because unaffected siblings (Sibs) of individuals with ASD share some redox abnormalities, we sought to determine whether LCLs from Sibs share ASD-associated mitochondrial abnormalities. We evaluated mitochondrial bioenergetics in 10 sets of LCLs from children with ASD, Sibs, and unrelated/unaffected controls (Cons) after acute increases in ROS. Additionally, intracellular glutathione and uncoupling protein 2 (UCP2) gene expressions were quantified. Compared to Sib LCLs, ASD LCLs exhibited significantly higher ATP-linked respiration, higher maximal and reserve respiratory capacity, and greater glycolysis and glycolytic reserve. ASD LCLs exhibited a significantly greater change in these parameters, with acute increases in ROS compared to both Sib and Con LCLs. Compared to Con, both ASD and Sib LCLs exhibited significantly higher proton leak respiration. Consistent with this, intracellular glutathione redox capacity was decreased and UCP2 gene expression was increased in both ASD and Sib compared to Con LCLs. These data indicate that mitochondrial respiratory function, not abnormal redox homeostasis, distinguishes ASD from unaffected LCLs.-Rose, S., Bennuri, S. C., Wynne, R., Melnyk, S., James, S. J., Frye, R. E. Mitochondrial and redox abnormalities in autism lymphoblastoid cells: a sibling control study.

Keywords: UCP2; autistic disorder; bioenergetics; glutathione; oxidative stress.


Figures

Figure 1.
Figure 1.
Mitochondrial respiratory parameters. Mean curves of mitochondrial parameters with 1 h exposure to DMNQ are outlined by upper and lower standard errors. A) Both overall [F(2,423) = 7.60, P < 0.001] and change in ATP-linked respiration [F(2,423) = 3.64, P < 0.05] differed across groups, with ASD LCLs exhibiting markedly higher overall ATP-linked respiration compared to Sib [t(423) = 3.61, P < 0.001] and Con [t(423) = 3.03, P < 0.005] LCLs and greater change in ATP-linked respiration with DMNQ compared to Sib [t(423) = 2.03, P < 0.05] and Con [t(405) = 2.55, P = 0.01] LCLs. B) Overall proton leak [F(2,423) = 12.07, P < 0.0001] differed across groups, with lower overall proton leak in Con compared to ASD [t(423) = 4.86, P < 0.0001] and Sib [t(423) = −3.19, P < 0.005] LCLs. C) Overall maximal respiratory capacity differed across groups [F(2,423) = 25.34, P < 0.0001], with higher maximal respiratory capacity in ASD compared to Sib [t(423) = 6.26, P < 0.001] and Con [t(423) = 5.97, P < 0.001] LCLs. D) Both overall [F(2,423) = 20.77, P < 0.001] and change in reserve capacity with DMNQ [F(2,423) = 5.67, P < 0.005] differed across groups. Reserve capacity was markedly higher in ASD compared to Sib [t(423) = 6.01, P < 0.0001] and Con [t(423) = 4.93, P < 0.001] LCLs, and decrease in reserve capacity with DMNQ was greater in ASD compared to Sib [t(423) = 3.10, P < 0.005] and Con [t(405) = 2.67, P < 0.01] LCLs.
Figure 2.
Figure 2.
Glycolytic parameters. Mean curves of glycolytic parameters with 1 h exposure to DMNQ are outlined by upper and lower standard errors. A) Both overall [F(2,370) = 5.34, P < 0.01] and change in glycolysis [F(2,370) = 5.77, P < 0.005] differed across groups. Overall glycolysis was markedly higher in ASD compared to Sib [t(370) = 2.57, P = 0.01] and Con [t(370) = 3.03, P < 0.005] LCLs, and decrease in glycolysis with DMNQ was significantly greater in ASD compared to Sib [t(370) = 2.96, P < 0.005] and Con [t(370) = 2.95, P = 0.005] LCLs. B) LCL groups differed in overall glycolytic reserve [F(2,370) = 4.15, P < 0.05]. Glycolytic reserve was markedly higher in ASD compared to Sib [t(370) = 2.28, P < 0.05] and Con [t(370) = 2.66, P < 0.05] LCLs.
Figure 3.
Figure 3.
SBRI total scores correlate with bioenergetics. A) Effect of DMNQ on ATP-linked respiration was dependent on SBRI total score [F(1,131) = 6.60,P = 0.01]. Mean curves of ATP-linked respiration with 1 h exposure to DMNQ are outlined by upper and lower standard errors. Those with more severe stereotyped and repetitive behaviors (red lines) started out with higher ATP-linked respiration and had greater drop in ATP-linked respiration than individuals with relatively more mild repetitive behaviors (green lines). B) SBRI total score was related to overall glycolytic reserve [F(1,125) = 5.60,P < 0.05] such that more severe scores were related to higher glycolytic reserve.
Figure 4.
Figure 4.
Intracellular glutathione parameters. A) GSH differed across groups [F(2,18) = 8.95, P < 0.01] as ASD LCLs exhibited lower GSH compared to Sib [t(18) = 2.46, P < 0.05] and Con [t(18) = 4.21, P < 0.001] LCLs. B) GSSG differed across groups [F(2,18) = 2.27, P = 0.05] as Sib LCLs exhibited greater GSSG than Con [t(18) = 2.45, P < 0.05] LCLs. C) GSH/GSSG differed across groups [F(2,18) = 10.57, P < 0.001] due to lower GSH/GSSG in ASD [t(18) = 4.27, P < 0.001] and Sib [t(18) = 3.61, P < 0.01] LCLs compared to Con LCLs. *P < 0.001, **P < 0.01; ŧP < 0.05.
Figure 5.
Figure 5.
UCP2 gene expression normalized to housekeeping gene HPRT1. UCP2 expression was significantly different across groups [F(2,36) = 7.04, P < 0.005], with ASD [t(36) = 2.51, P < 0.05] and Sib LCLs [t(36) = 3.74, P < 0.001] demonstrating significantly higher UCP2 expression compared to Con LCLs.

References

    1. Rossignol D. A., Frye R. E. (2012) A review of research trends in physiological abnormalities in autism spectrum disorders: immune dysregulation, inflammation, oxidative stress, mitochondrial dysfunction and environmental toxicant exposures. Mol. Psychiatry 17, 389–401 - PMC - PubMed
    1. Rossignol D. A., Frye R. E. (2012) Mitochondrial dysfunction in autism spectrum disorders: a systematic review and meta-analysis. Mol. Psychiatry 17, 290–314 - PMC - PubMed
    1. Frye R. E., Rossignol D. A. (2011) Mitochondrial dysfunction can connect the diverse medical symptoms associated with autism spectrum disorders. Pediatr. Res. 69, 41R–47R - PMC - PubMed
    1. Frye R. E. (2012) Biomarker of abnormal energy metabolism in children with autism spectrum disorder. N. Am. J. Med. Sci. (Boston) 5, 141–147
    1. Frye R. E., Melnyk S., Macfabe D. F. (2013) Unique acyl-carnitine profiles are potential biomarkers for acquired mitochondrial disease in autism spectrum disorder. Transl. Psychiatry 3, e220 - PMC - PubMed

Publication types