. 2016 Dec 1;99(6):1245-1260.
doi: 10.1016/j.ajhg.2016.10.003. Epub 2016 Nov 17.

Colocalization of GWAS and eQTL Signals Detects Target Genes

Affiliations

Colocalization of GWAS and eQTL Signals Detects Target Genes

Farhad Hormozdiari et al. Am J Hum Genet. .

Abstract

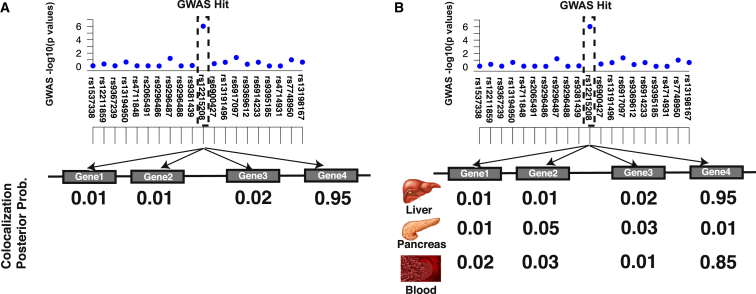
The vast majority of genome-wide association study (GWAS) risk loci fall in non-coding regions of the genome. One possible hypothesis is that these GWAS risk loci alter the individual's disease risk through their effect on gene expression in different tissues. In order to understand the mechanisms driving a GWAS risk locus, it is helpful to determine which gene is affected in specific tissue types. For example, the relevant gene and tissue could play a role in the disease mechanism if the same variant responsible for a GWAS locus also affects gene expression. Identifying whether or not the same variant is causal in both GWASs and expression quantitative trail locus (eQTL) studies is challenging because of the uncertainty induced by linkage disequilibrium and the fact that some loci harbor multiple causal variants. However, current methods that address this problem assume that each locus contains a single causal variant. In this paper, we present eCAVIAR, a probabilistic method that has several key advantages over existing methods. First, our method can account for more than one causal variant in any given locus. Second, it can leverage summary statistics without accessing the individual genotype data. We use both simulated and real datasets to demonstrate the utility of our method. Using publicly available eQTL data on 45 different tissues, we demonstrate that eCAVIAR can prioritize likely relevant tissues and target genes for a set of glucose- and insulin-related trait loci.


Figures

Figure 1
Figure 1
Overview of Our Method for Detecting the Target Gene and Most Relevant Tissue We compute the CLPP for all genes and all tissues. (A) A simple case where we have only one tissue and want to find the target gene. We consider all genes for this GWAS risk locus and observe that gene 4 has the highest CLPP. Thus, the target gene is gene 4. (B) We have three tissues and utilize the quantity of CLPP. Thus, the target gene is gene 4 again. Moreover, in this example, liver and blood are considered the relevant tissues for this GWAS risk locus, whereas the pancreas is not relevant.
Figure 2
Figure 2
Overview of eCAVIAR Broadly, eCAVIAR aligns the causal variants in an eQTL study and GWAS. The x axis is the variant (SNP) location, and the y axis is the significance score (−log of p value) for each variant. The gray triangle indicates the LD structure, and every diamond in this triangle indicates the Pearson’s correlation. The darker the diamond, the higher the correlation; and the lighter the diamond, the lower the correlation between the variants. (A) In the case where the causal variants are aligned, the colocalization posterior probability (CLPP) is high for the variant that is embedded in the dashed black rectangle. (B) However, in the case where the causal variants are not aligned (the causal variants are not the same variants), the quantity of CLPP is low for the variant that is embedded in the dashed black rectangle. (C) In this case, the LD is high, which implies that the uncertainty is high as a result of LD, and the CLPP value is low for the variant that is embedded in the dashed black rectangle. (D) A case where a locus has two independent causal variants. If we consider that we have only one causal variant in a locus, then the CLPP of the causal variants is estimated to be 0.25. However, if we allow more than one causal variant in the locus, eCAVIAR estimates the CLPP to be 1.
Figure 3
Figure 3
eCAVIAR Is Robust to the Presence of AH We simulated marginal statistics directly from the LD structure for an eQTL study and GWAS. In both studies, we implanted one, two, or three causal variants on which the statistical power was 50% (A–C, respectively) or 80% (D–F, respectively). eCAVIAR had a low TP for a high cutoff and a low FP. This indicates that eCAVIAR has high confidence in detecting a colocalized locus in both the GWAS and eQTL study, even in the presence of AH.
Figure 4
Figure 4
eCAVIAR Is More Accurate Than Existing Methods for Regions with One Causal Variant We compare the accuracy and precision of eCAVIAR with those of the two existing methods (RTC and COLOC). The x axis is the colocalization cutoff threshold. In these datasets, we implanted one causal variant, and we utilized simulated genotypes. We simulated the genotypes by using HAPGEN2 software. We used the European population from 1000 Genomes data, as the starting point to simulate the genotypes. The accuracy and precision of all three methods are shown in (A) and (B), respectively. We computed the TP (true-positive rate), TN (true-negative rate), FN (false-negative rate), and FP (false-positive rate) for the set of simulated datasets for which we generated the marginal statistics in a linear model. Accuracy = (TP + TN)/(TP + FP + FN + TN), and precision = TP/(TP + FP). We set the non-colocalization cutoff threshold to 0.001. We observed that eCAVIAR and COLOC had higher accuracy and precision than RTC.
Figure 5
Figure 5
eCAVIAR Is More Accurate Than Existing Methods in the Presence of AH To generate the datasets, we used a process similar to that shown in Figure 4. However, in this case, we implanted two causal variants. We simulated the genotypes by using HAPGEN2 software. We used the European population from 1000 Genomes data, as the starting point to simulate the genotypes. We compared the accuracy, precision, and recall rate. In these results, eCAVIAR tended to have higher accuracy and precision than RTC and COLOC. However, RTC had a slightly higher recall rate.

References

    1. Wellcome Trust Case Control Consortium Genome-wide association study of 14,000 cases of seven common diseases and 3,000 shared controls. Nature. 2007;447:661–678. - PMC - PubMed
    1. Visscher P.M., Brown M.A., McCarthy M.I., Yang J. Five years of GWAS discovery. Am. J. Hum. Genet. 2012;90:7–24. - PMC - PubMed
    1. Rietveld C.A., Medland S.E., Derringer J., Yang J., Esko T., Martin N.W., Westra H.-J., Shakhbazov K., Abdellaoui A., Agrawal A., LifeLines Cohort Study GWAS of 126,559 individuals identifies genetic variants associated with educational attainment. Science. 2013;340:1467–1471. - PMC - PubMed
    1. Ripke S., O’Dushlaine C., Chambert K., Moran J.L., Kähler A.K., Akterin S., Bergen S.E., Collins A.L., Crowley J.J., Fromer M., Multicenter Genetic Studies of Schizophrenia Consortium. Psychosis Endophenotypes International Consortium. Wellcome Trust Case Control Consortium 2 Genome-wide association analysis identifies 13 new risk loci for schizophrenia. Nat. Genet. 2013;45:1150–1159. - PMC - PubMed
    1. Nicolae D.L., Gamazon E., Zhang W., Duan S., Dolan M.E., Cox N.J. Trait-associated SNPs are more likely to be eQTLs: annotation to enhance discovery from GWAS. PLoS Genet. 2010;6:e1000888. - PMC - PubMed