

Comparing Variability, Severity, and Persistence of Depressive Symptoms as Predictors of Future Stroke Risk
- PMID: 27866734
- PMCID: PMC5253243
- DOI: 10.1016/j.jagp.2016.10.009
Comparing Variability, Severity, and Persistence of Depressive Symptoms as Predictors of Future Stroke Risk
Abstract
Objective: Numerous studies show that depressive symptoms measured at a single assessment predict greater future stroke risk. Longer-term symptom patterns, such as variability across repeated measures or worst symptom level, might better reflect adverse aspects of depression than a single measurement. This prospective study compared five approaches to operationalizing depressive symptoms at annual assessments as predictors of stroke incidence.
Design: Cohort followed for incident stroke over an average of 6.4 years.
Setting: The Adult Changes in Thought cohort follows initially cognitively intact, community- dwelling older adults from a population base defined by membership in Group Health, a Seattle-based nonprofit healthcare organization.
Participants: 3,524 individuals aged 65 years and older.
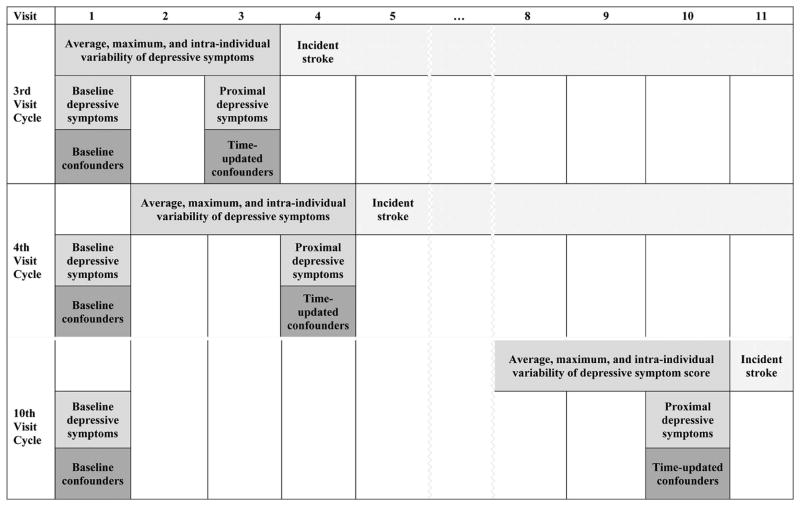
Measurements: We identified 665 incident strokes using ICD codes. We considered both baseline Center for Epidemiologic Studies-Depression scale (CES-D) score and, using a moving window of three most recent annual CES-D measurements, we compared most recent, maximum, average, and intra-individual variability of CES-D scores as predictors of subsequent stroke using Cox proportional hazards models.
Results: Greater maximum (hazard ratio [HR]: 1.18; 95% CI: 1.07-1.30), average (HR: 1.20; 95% CI: 1.05-1.36) and intra-individual variability (HR: 1.15; 95% CI: 1.06-1.24) in CES-D were each associated with elevated stroke risk, independent of sociodemographics, cardiovascular risks, cognition, and daily functioning. Neither baseline nor most recent CES-D was associated with stroke. In a combined model, intra-individual variability in CES-D predicted stroke, but average CES-D did not.
Conclusions: Capturing the dynamic nature of depression is relevant in assessing stroke risk. Fluctuating depressive symptoms may reflect a prodrome of reduced cerebrovascular integrity.
Keywords: Depression; cerebrovascular; elderly; variability.
Copyright © 2017 American Association for Geriatric Psychiatry. Published by Elsevier Inc. All rights reserved.
Conflict of interest statement
No disclosures to report.
Figures

Comment in
-
Depression and Cerebrovascular Disease: What is to be Done?Am J Geriatr Psychiatry. 2017 Feb;25(2):129-130. doi: 10.1016/j.jagp.2016.11.013. Epub 2016 Dec 7. Am J Geriatr Psychiatry. 2017. PMID: 28011139 No abstract available.
Similar articles
-
10-year trajectories of depressive symptoms and risk of dementia: a population-based study.Lancet Psychiatry. 2016 Jul;3(7):628-35. doi: 10.1016/S2215-0366(16)00097-3. Epub 2016 Apr 29. Lancet Psychiatry. 2016. PMID: 27138970
-
Elevated Depressive Symptoms and the Risk of Stroke among the Mexican Older Population.J Am Geriatr Soc. 2020 Nov;68(11):2579-2586. doi: 10.1111/jgs.16718. Epub 2020 Sep 2. J Am Geriatr Soc. 2020. PMID: 32880905 Free PMC article.
-
Changes in Depressive Symptoms and Incidence of First Stroke Among Middle-Aged and Older US Adults.J Am Heart Assoc. 2015 May 13;4(5):e001923. doi: 10.1161/JAHA.115.001923. J Am Heart Assoc. 2015. PMID: 25971438 Free PMC article.
-
Persistence of Depressive Symptoms and Risk of Incident Cardiovascular Disease With and Without Diabetes: Results from the REGARDS Study.J Gen Intern Med. 2022 Dec;37(16):4080-4087. doi: 10.1007/s11606-022-07449-w. Epub 2022 Mar 1. J Gen Intern Med. 2022. PMID: 35230623 Free PMC article.
-
Association of Depressive Symptoms With Incident Cardiovascular Diseases in Middle-Aged and Older Chinese Adults.JAMA Netw Open. 2019 Dec 2;2(12):e1916591. doi: 10.1001/jamanetworkopen.2019.16591. JAMA Netw Open. 2019. PMID: 31800066 Free PMC article.
Cited by
-
Daily Stressors, Emotion Dynamics, and Inflammation in the MIDUS Cohort.Int J Behav Med. 2022 Aug;29(4):494-505. doi: 10.1007/s12529-021-10035-9. Epub 2021 Oct 18. Int J Behav Med. 2022. PMID: 34661859 Free PMC article.
-
A marginal structural model to estimate the effect of antidepressant medication treatment on major cardiovascular events among people with post-traumatic stress disorder.Psychol Med. 2023 Dec;53(16):7837-7846. doi: 10.1017/S0033291723001873. Epub 2023 Jul 24. Psychol Med. 2023. PMID: 37485701 Free PMC article.
-
Factors associated with depressive symptoms of carepartners of stroke survivors after discharge from rehabilitation therapy.Top Stroke Rehabil. 2020 Dec;27(8):590-600. doi: 10.1080/10749357.2020.1738678. Epub 2020 Mar 12. Top Stroke Rehabil. 2020. PMID: 32160824 Free PMC article.
-
Comparison of Risk of Stroke in Patients With and Without Depression: A Systematic Review and Meta-Analysis.Cureus. 2024 Jan 27;16(1):e53057. doi: 10.7759/cureus.53057. eCollection 2024 Jan. Cureus. 2024. PMID: 38410306 Free PMC article. Review.
-
Persistent depressive symptoms, HPA-axis hyperactivity, and inflammation: the role of cognitive-affective and somatic symptoms.Mol Psychiatry. 2020 May;25(5):1130-1140. doi: 10.1038/s41380-019-0501-6. Epub 2019 Aug 21. Mol Psychiatry. 2020. PMID: 31435001 Free PMC article.
References
-
- Kessler RC, Berglund P, Demler O, et al. National comorbidity survey replication. The epidemiology of major depressive disorder: results from the National Comorbidity Survey Replication (NCS-R) JAMA. 2003;289:3095–3105. - PubMed
-
- Dong J-Y, Zhang Y-H, Tong J, et al. Depression and risk of stroke a meta-analysis of prospective studies. Stroke. 2012;43:32–37. - PubMed
-
- Musselman DL, Evans DL, Nemeroff CB. The relationship of depression to cardiovascular disease: epidemiology, biology, and treatment. Arch Gen Psychiatry. 1998;55:580–592. - PubMed
-
- Shimbo D, Chaplin W, Crossman D, et al. Role of depression and inflammation in incident coronary heart disease events. Am J Cardiol. 2005;96:1016–1021. - PubMed
Publication types
MeSH terms
Grants and funding
LinkOut - more resources
Full Text Sources
Other Literature Sources
Medical
