. 2016 Dec 12;30(6):925-939.
doi: 10.1016/j.ccell.2016.10.010. Epub 2016 Nov 17.

Deubiquitination and Stabilization of PD-L1 by CSN5

Affiliations

Deubiquitination and Stabilization of PD-L1 by CSN5

Seung-Oe Lim et al. Cancer Cell. .

Abstract

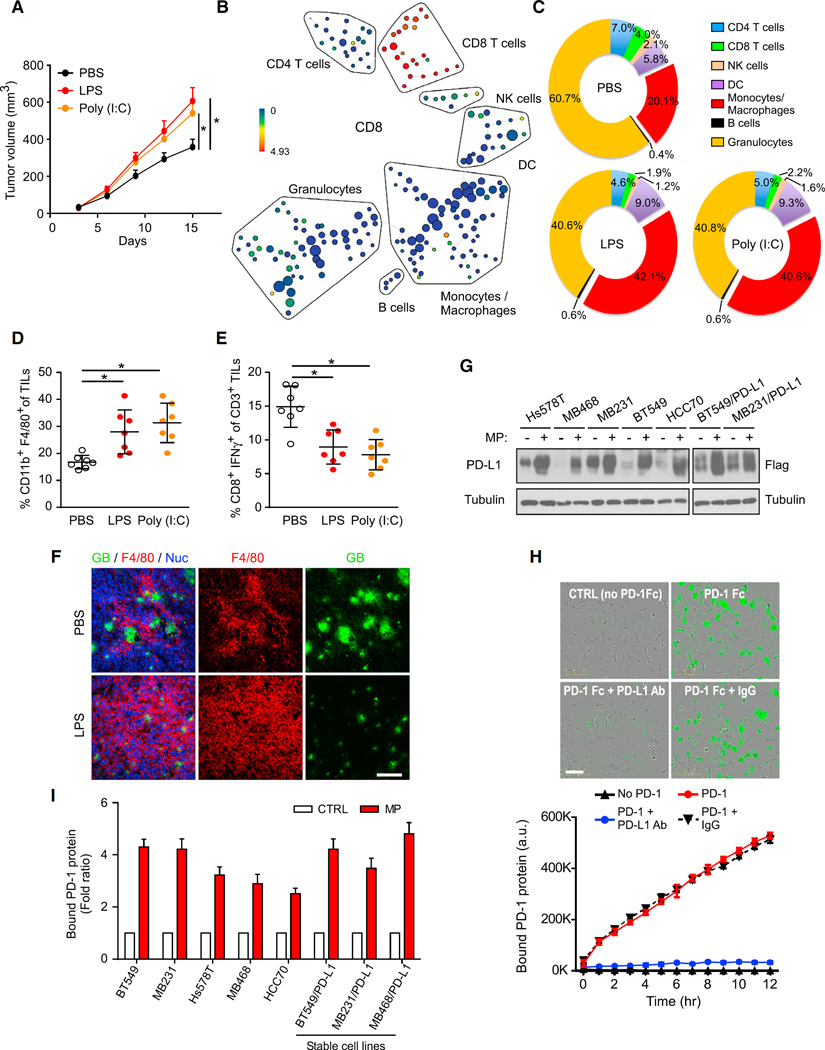
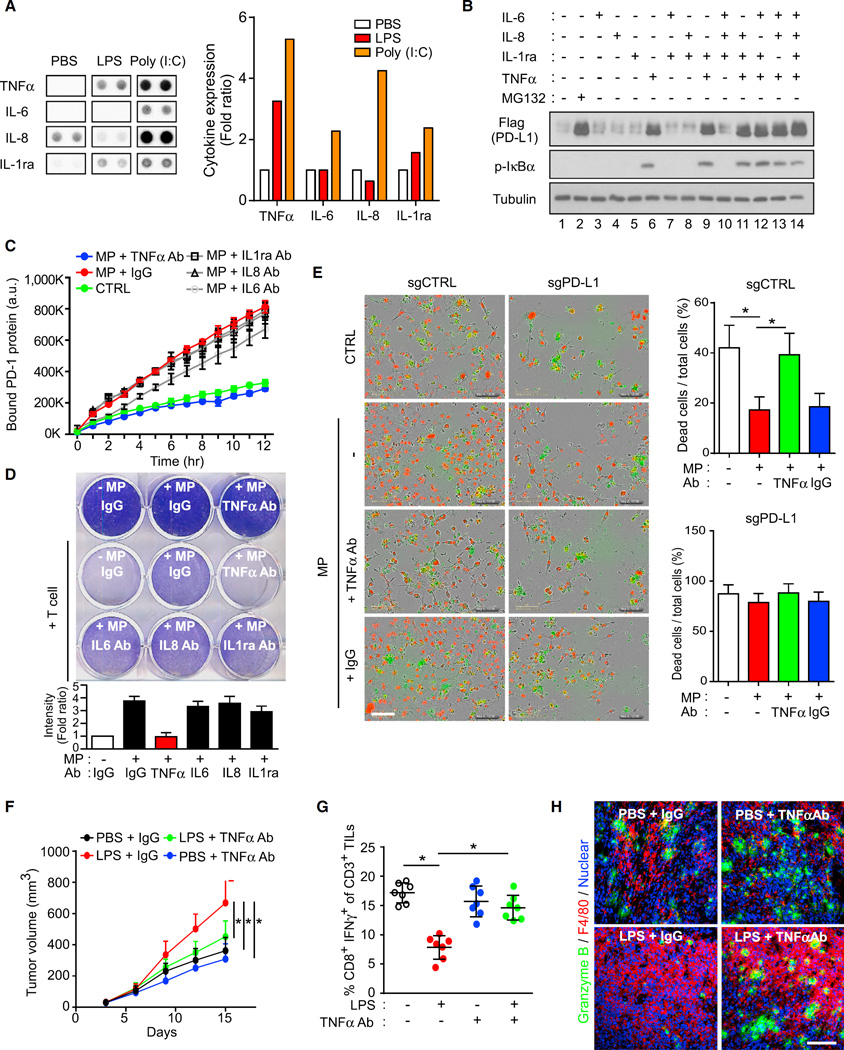
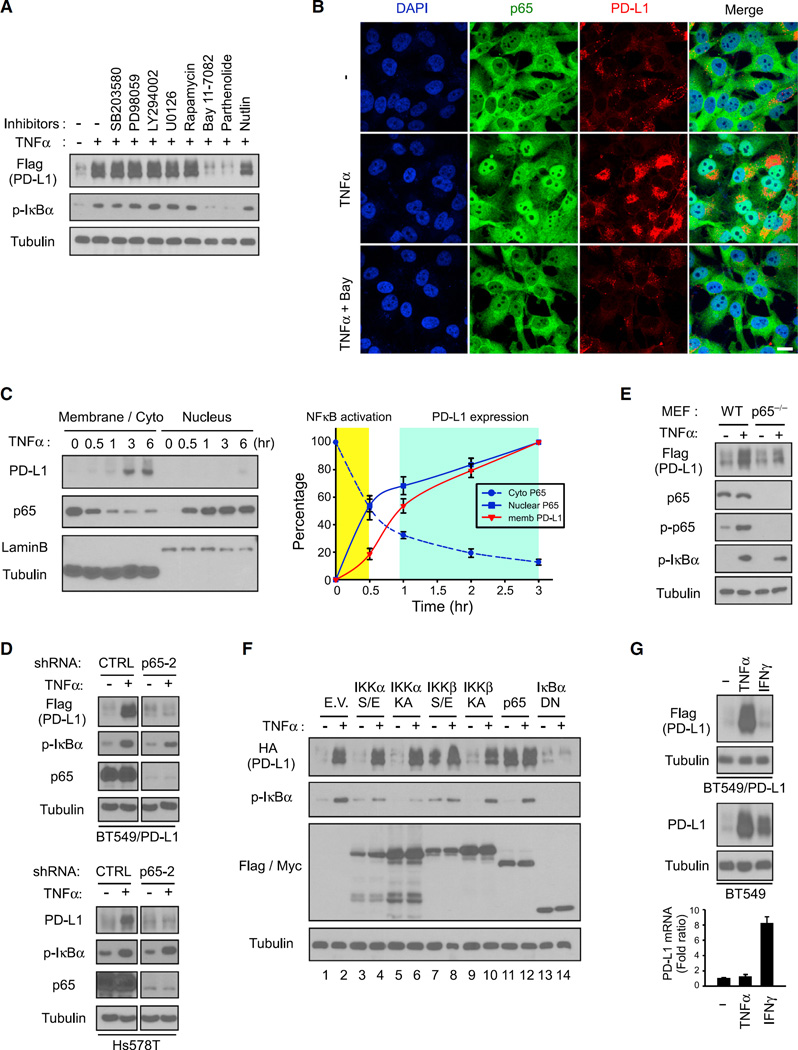
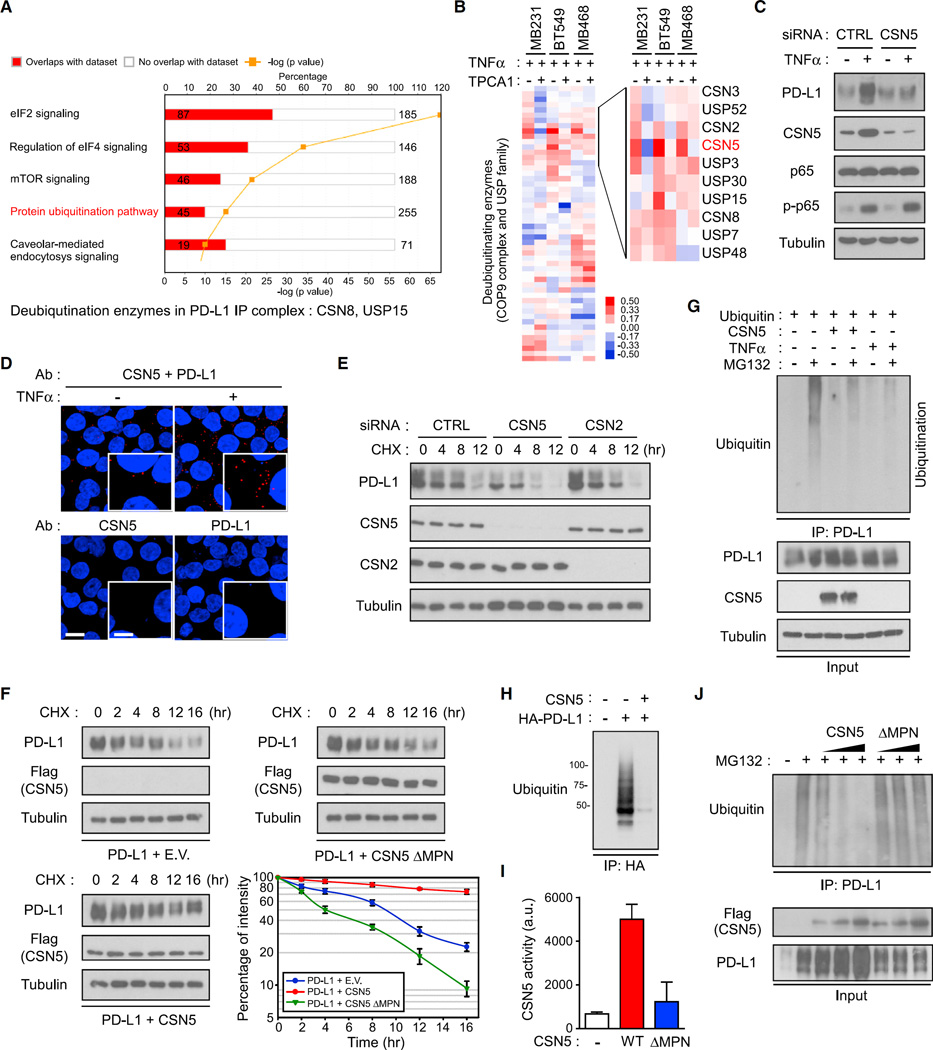
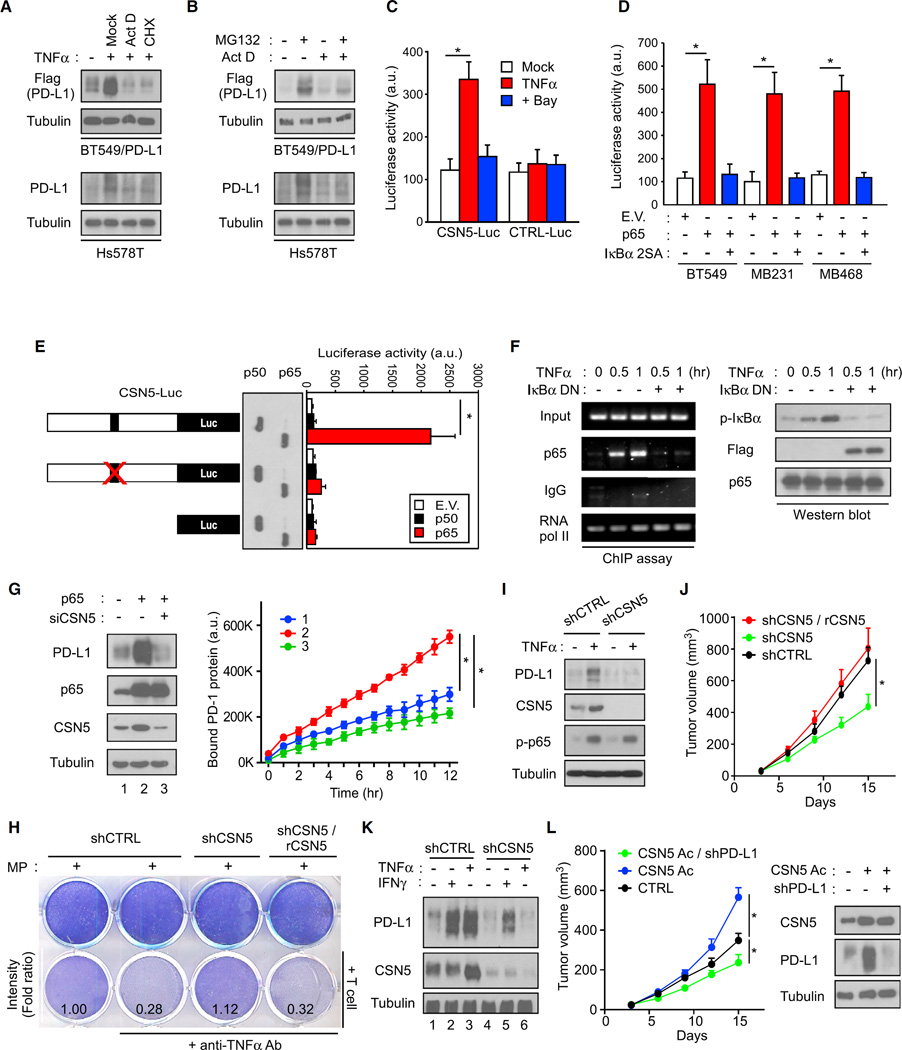
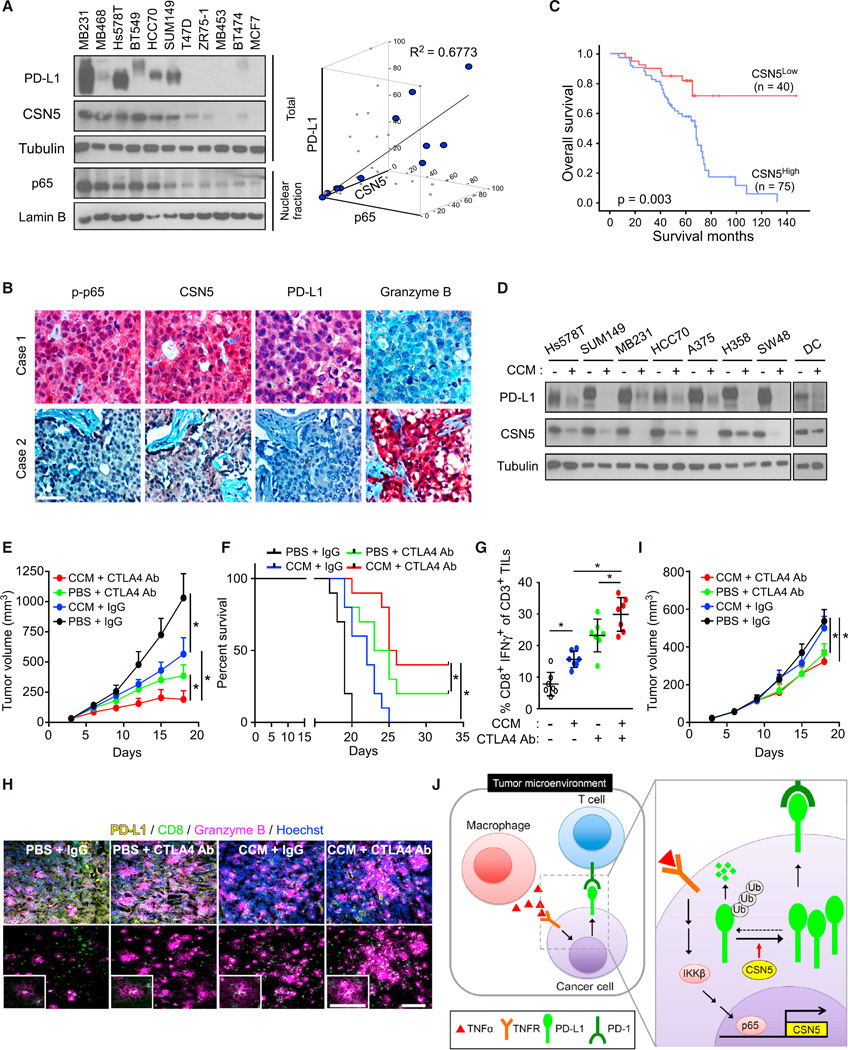
Pro-inflammatory cytokines produced in the tumor microenvironment lead to eradication of anti-tumor immunity and enhanced tumor cell survival. In the current study, we identified tumor necrosis factor alpha (TNF-α) as a major factor triggering cancer cell immunosuppression against T cell surveillance via stabilization of programmed cell death-ligand 1 (PD-L1). We demonstrated that COP9 signalosome 5 (CSN5), induced by NF-κB p65, is required for TNF-α-mediated PD-L1 stabilization in cancer cells. CSN5 inhibits the ubiquitination and degradation of PD-L1. Inhibition of CSN5 by curcumin diminished cancer cell PD-L1 expression and sensitized cancer cells to anti-CTLA4 therapy.

Keywords: CSN5; PD-L1; TNF-α; anti-CTLA4; curcumin; deubiquitination.


Figures

Figure 1
Figure 1. Macrophage-Secreted Inflammatory Cytokines Upregulate Expression of PD-L1 Protein
(A) Tumor growth of 4T1 cells in BALB/c mice following treatment with lipopolysaccharide (LPS), polycytidylic acid (poly(I:C)), or PBS was measured at the indicated time points and dissected at the endpoint (n = 7 mice per group). (B) SPADE tree derived from CyTOF (11-marker) analysis of tumor-infiltrating lymphocytes (TILs) from 4T1 tumors. Cell populations were identified as CD4 T cells (CD45+CD3+TCRβ+CD4+), CD8 T cells (CD45+CD3+TCRβ+CD8+), natural killer (NK) cells (CD45+NK1.1+), dendritic cells (DC; CD45+CD11c+), monocytes and macrophages (CD45+CD11b+Gr1), B cells (CD45+B220+CD19+), and granulocytes (CD45+CD11b+Gr1+). The tree is colored by the intensity of CD8 marker shown to highlight CD8+ T cells. (C) Percentages of immune cell populations within CD45+ TILs from 4T1 tumors, assessed with CyTOF (11-marker) and analyzed with SPADE (n = 3). (D) Macrophage (CD11b+F4/80+) population in CD45+ TILs from 4T1 tumors (n = 7). Results are presented as mean ± SD from one representative experiment. (E) Intracellular cytokine staining of IFN-γ+CD8+ in CD3+ T cell populations from 4T1 tumors (n = 7). Results are presented as mean ± SD from one representative experiment. (F) Immunofluorescence staining of the protein expression pattern of F4/80 and granzyme B (GB) in 4T1 tumors (Nuc, nuclear). Scale bar, 100 µm. (G) Western blot analysis of PD-L1 expression in various cancer cells treated with macrophage-conditioned medium (MP) for 12 hr. (H) Time-lapse microscopy image showing the association of cancer cells with PD-1 at the 12-hr time point. Green fluorescent (green fluorescent-labeled PD-1/Fc protein) merged images of PD-L1-expressing cells are shown at the top, and a kinetic graph showing quantitative binding of PD-1/Fc protein on BT459 cells expressing PD-L1 at hourly time points is shown at the bottom. Scale bar, 100 µm. (I) PD-1 binding affinity of various cancer cell lines examined using the PD-L1/PD-1 binding assay with MP or regular culture medium as a control. *p < 0.05, Student’s t test. Error bars represent SD of three independent experiments. See also Figure S1.
Figure 2
Figure 2. TNF-α Induces Cancer Immunosuppression via PD-L1 Stabilization
(A) Analysis of cytokines secreted from LPS-, poly(I:C)-, or PBS-treated macrophages. Representative images are shown on the left and quantification of TNF-α, IL-6, IL-8, and IL-1ra is shown on the right. (B) PD-L1 analyzed by Flag antibody in BT549/PD-L1 cells serum-starved overnight and then treated with the indicated cytokines (10 ng/mL for each cytokine) for 8 hr. (C) PD-l binding assay in BT459/PD-L1 cells treated with MP and neutralization antibodies for the indicated cytokines. (D) T cell-meditated tumor cell killing assay in BT459/PD-L1 cells treated with MP and neutralization antibodies for the indicated cytokines. Activated T cell and BT549/PD-L1 cells were co-cultured in 12-well plates for 4 days and then surviving tumor cells were visualized by crystal violet staining. Relative fold ratios of surviving cell intensities are shown. (E) T cell-meditated tumor cell killing assay in PD-L1 knockout (PD-L1 KO) BT549 cells. Representative phase, red fluorescent (nuclear restricted RFP), and green fluorescent (NucView 488 caspase-3/7 substrate) merged images of activated T cell co-cultures in the presence of caspase-3/7 substrate at 96 hr are shown. T cells were activated with CD3 antibody (100 ng/mL) and IL-2 (10 ng/mL). Green fluorescent cells were counted as dead cells. The quantitative ratio of dead cells is shown in the bar graph on the right. Scale bar, 100 µm. (F) Tumor growth of 4T1 cells in BALB/c mice following treatment with LPS or TNF-α antibody. Tumor growth was measured at the indicated time points and dissected at the endpoint (n = 7 mice per group). (G) Intracellular cytokine staining of CD8+ IFN-γ+ in CD3+ T cell populations from isolated TILs. Results are presented as mean ± SD from one representative experiment. (H) Immunofluorescence staining of the protein expression pattern of F4/80 and granzyme B in 4T1 tumor masses. Scale bar, 100 µm. *p < 0.05, Student’s t test. Error bars represent SD of three independent experiments. See also Figure S2.
Figure 3
Figure 3. p65 Activation Regulates TNF-α-Mediated PD-L1 Stabilization
(A) Exogenous PD-L1 expression determined by western blot analysis with the Flag antibody in BT549/PD-L1 cells pretreated with various inhibitors for 45 min, followed by treatment with TNF-α for 8 hr. (B) Confocal microscopy image showing protein expression of p65 and PD-L1 after treatment with TNF-α in BT549 cells. Bay, Bay 11–7082. Scale bar, 20 µm. (C) Nuclear translocation of p65 analyzed at the indicated time points using cell fractionation in BT549 cells treated with TNF-α. Protein expression over time is shown in the graph on the right. Error bars are expressed as mean ± SD of three independent experiments. (D) Western blot analysis of PD-L1 in p65 knockdown clones. Exogenous PD-L1 in BT549/PD-L1 cells was detected by Flag antibody. (E) Western blot analysis of wild-type (WT) and p65/ mouse embryonic fibroblasts serum-starved overnight prior to 8 hr of treatment with TNF-α. (F) Expression of PD-L1, IKKα, IKKβ, IκBα, and p65 analyzed using western blot analysis. Flag-tagged IKKα/β, IκBα, or Myc-tagged p65 was expressed in HA-PD-L1-expressing BT549 cells. E.V., empty vector; S/E, constitutively active; KA, kinase-dead; DN, dominant-negative. (G) Top, western blot analysis of PD-L1 in TNF-α- or IFN-γ-treated BT549 cells. Exogenous PD-L1 in BT549/PD-L1 cells was detected by the Flag antibody. Bottom, qRT-PCR analysis of PD-L1 mRNA expression. Error bars represent SD of three independent experiments. See also Figure S3.
Figure 4
Figure 4. CSN5 Induces PD-L1 Stabilization via PD-L1 Deubiquitination
(A) PD-L1 binding proteins analyzed by liquid chromatography-tandem mass spectrometry and ingenuity pathway analysis. Flag-PD-L1 protein was immune-precipitated by Flag antibody-conjugated (M2) agarose resin and eluted by Flag peptide. The 930 identified PD-L1 binding proteins were analyzed by ingenuity pathway analysis. (B) qRT-PCR analysis of deubiquitinating enzymes in the USP family and COP9 signalosome genes in MB231, BT549, and MB468 cells. The heatmap was generated using TreeView. TPCA1, IKKβ inhibitor. (C) Western blot analysis of PD-L1 expression in CSN5-knockdown cells after treatment with TNF-α. CTRL, control small interfering RNA (siRNA). (D) Interaction of endogenous CSN5 and PD-L1 proteins in BT549 cells. Cells were immunostained with CSN5 and PD-L1 antibodies and assessed using the Duolink II assay. Red foci indicate association between PD-L1 and CSN5 proteins. Scale bar, 20 µm. Inset scale bar, 10 µm. (E) Protein stability of PD-L1 proteins in BT549/PD-L1 cells. Cells were treated with 20 µMcycloheximide (CHX) at indicated intervals and analyzed in western blot analysis. (F) Protein stability of PD-L1 proteins in HEK293T cells. Cells were transfected with HA-PD-L1 and WT Flag-CSN5 or MPN deletion (ΔMPN) mutant and analyzed in western blot analysis. E.V., empty vector. (G) Ubiquitination assay of PD-L1 in response to treatment with TNF-α. HEK293 cells were transiently transfected with the indicated constructs. Ubiquitinated PD-L1 was immunoprecipitated (IP) and subjected to western blot analysis with the ubiquitin antibody. Cells were treated with MG132 or TNF-α prior to ubiquitination analysis. (H) In vitro PD-L1 deubiquitination assay. Purified PD-L1, CSN5, E1, E2, and ubiquitin were incubated for 2 hr prior to western blot analysis. (I) CSN5 activity in an in vitro deubiquitination assay. The activity was measured by AMC released from the fluorogenic substrate, ubiquitin-AMC. (J) HEK293 cells were transiently transfected with the indicated plasmids. PD-L1 ubiquitination was analyzed by western blot analysis. Error bars represent SD of three independent experiments. See also Figure S4.
Figure 5
Figure 5. Transcriptional Activation of CSN5 by p65 Is Required for TNF-α-Mediated PD-L1 Stabilization
(A) PD-L1 expression detected by the Flag antibody in BT549/PD-L1 and Hs578T cells pretreated with actinomycin D (Act D) or cycloheximide (CHX) for 5 hr. (B) PD-L1 expression detected by the Flag antibody in BT549/PD-L1 and Hs578T cells pretreated with Act D or MG132 for 5 hr. (C) Luciferase activity measured and normalized according to Renilla luciferase activity in BT549 cells transiently transfected with the COPS5 luciferase promoter (CSN5-Luc). (D) CSN5-Luc promoter analysis in BT549, MB231, and MB468 cells transfected with p65 or IκBα 2SA. E.V., empty vector. (E) CSN5-Luc and p65 binding site-mutated CSN5-Luc activity in response to p65 or p50 expression. (F) Chromatin immunoprecipitation assay analyzing the binding of p65 to the COPS5 promoter. Mouse immunoglobulin G (IgG) was used as a negative control. RNA polymerase II was used as a positive control. DN, dominant-negative. (G) Western blot analysis of PD-L1 expression in p65-overexpressed and CSN5-knockdown cells (left). Results of the PD-1/PD-L1 binding assay (right). (H) T cell-meditated tumor cell killing assay in macrophage-conditioned medium (MP-treated control (shCTRL), CSN5 knockdown (shCSN5), or CSN5 reconstituted (shCSN5/rCSN5) BT549 cells. Activated T cell and BT549 cells were co-cultured in 12-well plates for 4 days and the surviving tumor cells were visualized by crystal violet staining. Relative fold ratios of surviving cell intensity are shown. (I) Western blot analysis of PD-L1 and CSN5 expression in TNFα-treated shCTRL or shCSN5 cells. (J) Tumor growth of shCTRL, shCSN5, or shCSN5/rCSN5 4T1 cells in LPS-treated BALB/c mice. Tumor growth was measured at the indicated time points and dissected at the endpoint (n = 7 mice per group). (K) Western blot analysis of PD-L1 and CSN5 expression in CSN5 knockdown, re-expression cells. (L) Tumor growth of endogenous CSN5 overexpressing (CSN5 Ac; by CSN5 CRISPR activation) or CSN5 overexpressing and PD-L1 knockdown (CSN5 Ac/shPD-L1) 4T1 cells in BALB/c mice (left). CTRL, parental 4T1 cells. Tumor growth was measured at the indicated time points and dissected at the endpoint (n = 7 mice per group). Western blot analysis of PD-L1 and CSN5 expression in isolated 4T1 tumor cells (right). *p < 0.05, Student’s t test. Error bars represent SD of three independent experiments. See also Figure S5.
Figure 6
Figure 6. PD-L1 Is Required for Immunosuppression Mediated by Inflammation In Vivo
(A) Correlation between protein expression of nuclear p65, total PD-L1, and CSN5 expression in 11 breast cancer cell lines. (B) Two representative immunohistochemical staining results for p-p65, CSN5, PD-L1, and granzyme B in human breast cancer tissues. Scale bar, 50 µm. (C) Overall survival of patients with breast cancer whose specimens were used in our analysis (n = 115). (D) Western blot analysis of PD-L1 and CSN5 expression in cells treated with curcumin (CCM). (E) Tumor growth of 4T1 cells in BALB/c mice treated with CCM or CTLA4 antibody after treatment with lipopolysaccharide. Tumors were measured at the indicated time points and dissected at the endpoint (n = 7 mice per group). (F) Survival of mice bearing syngeneic 4T1 tumors following treatment with CCM or CTLA4 antibody. Significance was determined by the log rank test (n = 10 mice per group). (G) Intracellular cytokine staining of CD8+ IFN-γ+ cells in the CD3+ T cell populations from isolated tumor-infiltrating lymphocytes. Results are presented as mean ± SD from one representative experiment. (H) Immunofluorescence staining of the protein expression pattern of PD-L1, CD8, and granzyme B in 4T1 tumor masses from the experiments shown in (E). Scale bar, 100 µm. Inset scale bar, 50 um. (I) Tumor growth of CSN5 knockout (CSN5 KO) 4T1 cells with PBS, curcumin (CCM), and/or CTLA4 antibody treatment in LPS-treated BALB/c mice. Tumor growth was measured at the indicated time points and dissected at the endpoint (n = 7 mice per group). (J) Proposed model of TNF-α-mediated PD-L1 stabilization by CSN5 contributing to escape from T cell immune surveillance. *p < 0.05, Student’s t test (or log rank test in F). Error bars represent SD of three independent experiments unless otherwise noted. See also Figure S6 and Table S1.

References

    1. Aggarwal BB, Kumar A, Bharti AC. Anticancer potential of curcumin: preclinical and clinical studies. Anticancer Res. 2003;23:363–398. - PubMed
    1. Bech-Otschir D, Kraft R, Huang X, Henklein P, Kapelari B, Pollmann C, Dubiel W. COP9 signalosome-specific phosphorylation targets p53 to degradation by the ubiquitin system. EMBO J. 2001;20:1630–1639. - PMC - PubMed
    1. Blonska M, Lin X. NF-kappaB signaling pathways regulated by CARMA family of scaffold proteins. Cell Res. 2011;21:55–70. - PMC - PubMed
    1. Brahmer JR, Drake CG, Wollner I, Powderly JD, Picus J, Sharfman WH, Stankevich E, Pons A, Salay TM, McMiller TL, et al. Phase I study of single-agent anti-programmed death-1 (MDX-1106) in refractory solid tumors: safety, clinical activity, pharmacodynamics, and immunologic correlates. J. Clin. Oncol. 2010;28:3167–3175. - PMC - PubMed
    1. Brown JA, Dorfman DM, Ma FR, Sullivan EL, Munoz O, Wood CR, Greenfield EA, Freeman GJ. Blockade of programmed death-1 ligands on dendritic cells enhances T cell activation and cytokine production. J. Immunol. 2003;170:1257–1266. - PubMed