Comment
. 2016 Dec 12;30(6):968-985.
doi: 10.1016/j.ccell.2016.10.006. Epub 2016 Nov 17.

Inhibition of the Glycolytic Activator PFKFB3 in Endothelium Induces Tumor Vessel Normalization, Impairs Metastasis, and Improves Chemotherapy

Affiliations
Comment

Inhibition of the Glycolytic Activator PFKFB3 in Endothelium Induces Tumor Vessel Normalization, Impairs Metastasis, and Improves Chemotherapy

Anna Rita Cantelmo et al. Cancer Cell. .

Abstract

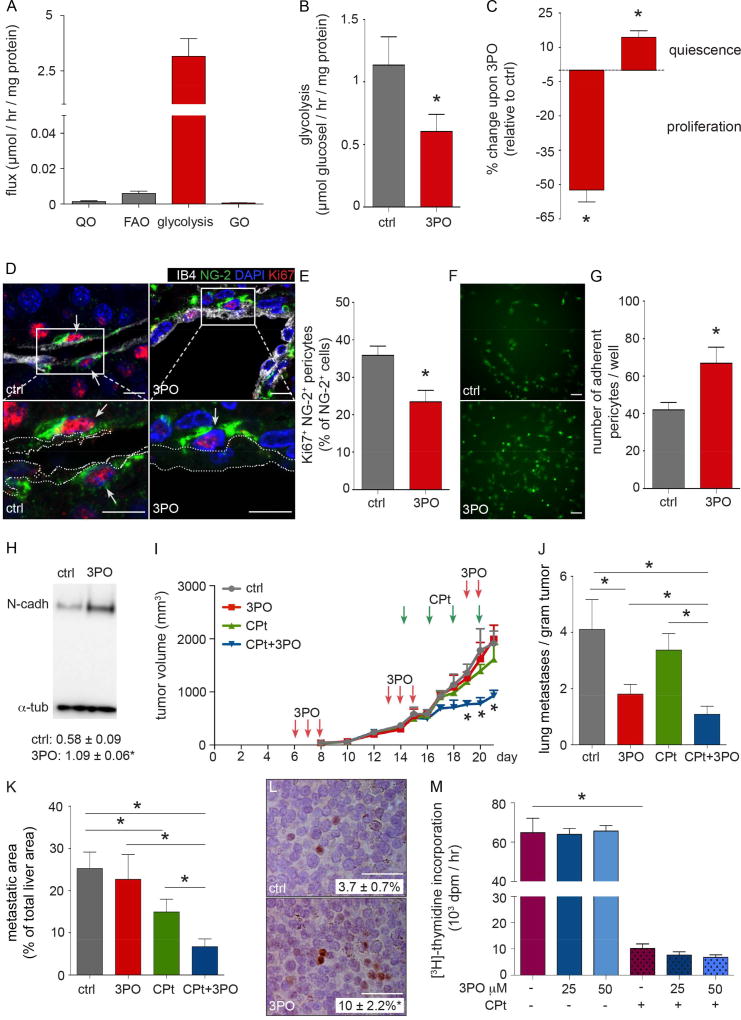
Abnormal tumor vessels promote metastasis and impair chemotherapy. Hence, tumor vessel normalization (TVN) is emerging as an anti-cancer treatment. Here, we show that tumor endothelial cells (ECs) have a hyper-glycolytic metabolism, shunting intermediates to nucleotide synthesis. EC haplo-deficiency or blockade of the glycolytic activator PFKFB3 did not affect tumor growth, but reduced cancer cell invasion, intravasation, and metastasis by normalizing tumor vessels, which improved vessel maturation and perfusion. Mechanistically, PFKFB3 inhibition tightened the vascular barrier by reducing VE-cadherin endocytosis in ECs, and rendering pericytes more quiescent and adhesive (via upregulation of N-cadherin) through glycolysis reduction; it also lowered the expression of cancer cell adhesion molecules in ECs by decreasing NF-κB signaling. PFKFB3-blockade treatment also improved chemotherapy of primary and metastatic tumors.

Keywords: angiogenesis; chemotherapy; glycolysis; metastasis; tumor endothelial cell metabolism; tumor vessel normalization.


Conflict of interest statement

The other authors declare no conflict of interests.

Figures

Figure 1
Figure 1. Characterization of tumor endothelial cells
(A) Proliferation of eTECs, expressed relative to NECs (n=3 biological repeats of pooled ECs isolated from 10–15 mice). (B) Migration of Mitomycin C-treated NECs and eTECs (n=5). (C) Correlation heatmap and hierarchical cluster analysis of transcript levels of 1,255 metabolic genes in NECs and eTECs (numbers in panel refer to individual samples n=4). Color scale: red, high correlation; blue, low correlation. Hierarchical clustering: color differences in dendrogram indicate significant clustering (p value < 0.05; multiscale bootstrap analysis). (D) Pathway map showing changes in transcript levels in eTECs (relative to NECs) of genes involved in glycolysis and side pathways (n=4; green: upregulated by at least 15%; gray: unchanged, fold change < 15%). (E) Heatmap and cluster analysis of transcript levels of genes in glycolysis and side pathways in eTECs versus NECs (numbers in panel refer to individual samples n=4). For color scale and clustering, see panel C. (F) Pathway map showing changes in transcript levels in eTECs (relative to NECs) of genes of nucleotide synthesis (n=4; green: upregulated by at least 15%; gray: unchanged, fold change < 15%). Ribonucleotides (red); deoxyribonucleotides (blue). (G) Correlation heatmap and cluster analysis of metabolites (shown in panel H) of glycolysis, PPP and nucleotide synthesis in eTECs versus NECs (numbers in panel refer to individual samples n=5). For color scale and clustering, see panel C. (H) Steady state metabolite levels of metabolites of glycolysis, PPP and nucleotide synthesis in eTECs, relative to NECs (n=10). Dotted line: expression level in NECs. (I) Glucose levels in medium of eTECs, relative to NECs (n=5). (J) Lactate levels in medium of eTECs, relative to NECs (n=5). All data are mean ± SEM. * p value < 0.05. For panel H, p values were calculated by one sample t-test. See also Figure S1, Tables S1–S4.
Figure 2
Figure 2. Effect of genetic inhibition of PFKFB3 on B16-F10 tumor progression and metastasis
(A) Glycolytic flux in eTECs, relative to NECs (n=3–5). (B) Glucose oxidation flux in eTECs, relative to NECs (n=10). (C) Basal and ATP-linked (oligomycin-sensitive) oxygen consumption (OCR) in NECs and eTECs (n=5). (D) Incorporation of 14C-glucose label in DNA and RNA in NECs and eTECs (n=4–5); dpm, disintegrations per minute. (E) Glycolytic flux in NECs from WT and Pfkfb3+/ΔEC mice, exposed to normoxia (21% oxygen) or hypoxia (0.5% oxygen) (n=5); values normalized to flux in normoxic WT cells. (F) Glycolytic flux in eTECs from WT and Pfkfb3+/ΔEC mice exposed to normoxia (21% oxygen) or hypoxia (0.5% oxygen) (n=5–10); values normalized to flux in normoxic WT cells. (G) Growth curve of s.c. B16-F10 tumors in WT and Pfkfb3+/ΔEC mice (n=10–20). (H) End-stage tumor weight of s.c. B16-F10 tumors in WT and Pfkfb3+/ΔEC mice (n=10–20). (I) Micrographs of H&E staining of necrotic areas (asterisks within dotted lines) in B16-F10 tumors in WT and Pfkfb3+/ΔEC mice; quantification of necrotic area is indicated (% of total tumor area; n=7–11). (J) Quantification of metastatic index (lung metastases / gram tumor) in s.c. B16-F10 tumor-bearing WT and Pfkfb3+/ΔEC mice (n=15–22). (K) Micrographs of H&E-stained B16-F10 tumor sections of cancer cell invasion in WT and Pfkfb3+/ΔEC mice. Dotted line: border between tumor and surrounding muscle; arrows: residual muscle tissue. (L) Micrographs of s.c. B16-F10 tumors from WT and Pfkfb3+/ΔEC mice, stained for CD31 and endoglin to assess intraluminal CD31 endoglin+ cancer cells (arrows). (M) Quantification of intraluminal cancer cells per vessel in (L) (n=12–16). (N) Quantification of % of vessels with intraluminal cancer cells in (L) (n=12–16). (O) Quantification of B16-F10 cancer cell colonies, upon isolation and culturing of circulating B16-F10 cancer cells from s.c. B16-F10 tumor bearing WT and Pfkfb3+/ΔEC mice (3 biological repeats of 4–6 pooled individual animals each). (P) Quantification of metastatic area in lungs (area of metastatic lesions, % of total lung area) upon tail vein injection of B16-F10 cancer cells in WT and Pfkfb3+/ΔEC mice (n=6–9). Bars: 75 µm (I), 50 µm (K,L). All data are mean ± SEM. * p value < 0.05. See also Figure S2.
Figure 3
Figure 3. Effect of PFKFB3 blockade on B16-F10 tumor progression and metastasis
(A) Gas chromatography-mass spectrometry (GC-MS) analysis of blood [13C]-lactate levels upon i.v. injection of [U-13C]-glucose in control (ctrl) and 3PO-treated mice (n=7–8). (B) Growth of s.c. B16-F10 tumors in ctrl and 3PO-treated mice (n=7). (C) Micrographs of sections of B16-F10 tumors from ctrl or 3PO-treated mice, stained for proliferation marker Ki67. Nuclei are counterstained with DAPI. Quantification of Ki67+ cells (Ki67+ nuclei, % of total) is indicated (n=3). (D) Dose-response analysis of the effect of 3PO on proliferation of NECs (n=3 biological repeats of pooled ECs isolated from 10–15 individual animals each). (E) Dose-response analysis of the effect of 3PO on proliferation of eTECs (n=3 biological repeats of pooled ECs isolated from 10–15 individual animals each). (F) Dose-response analysis of the effect of 3PO on proliferation of B16-F10 (n=3). (G) Dose-response analysis of the effect of 3PO on proliferation of Panc02 cells (n=3). (H) Quantification of lung metastases in s.c. B16-F10 tumor-bearing mice treated with vehicle (ctrl) or 3PO (n=17). (I) Metastatic index (lung metastases / tumor weight) in s.c. B16-F10 tumor-bearing mice treated with vehicle (ctrl) or 3PO (n=17). (J) Micrographs of H&E-stained B16-F10 tumor sections in ctrl and 3PO-treated mice. Dotted line: border between tumor and surrounding muscle; arrows: residual muscle tissue. (K) Micrographs of s.c. B16-F10 tumor sections from ctrl and 3PO-treated mice, stained for CD31 and endoglin to assess intraluminal CD31 endoglin+ cancer cells (arrows). (L) Quantification of intraluminal cancer cells per vessel in (K) (n=8). (M) Quantification of % of vessels with intraluminal cancer cells in (K) (n=8). (N) Quantification of B16-F10 cancer cell colonies, obtained upon isolation and culturing of circulating B16-F10 cancer cells from s.c. tumor-bearing mice treated with vehicle (ctrl) or 3PO (n=3 biological repeats of 3–9 pooled individual animals each). (O) Quantification of metastatic area in lungs (area of metastatic lesions, % of total lung area) upon tail vein injection of B16-F10 cancer cells in mice pretreated 3 days before cancer cell injection with vehicle (ctrl) or 3PO (n=5). Bars: 100 µm (C), 50 µm (J,K). All data are mean ± SEM. * p value < 0.05. See also Figure S3.
Figure 4
Figure 4. Effect of PFKFB3 haplodeficiency on tumor vessels, perfusion and oxygenation
(A) Micrographs of B16-F10 tumor sections from WT and Pfkfb3+/ΔEC mice, stained for CD31. (B) Quantification of tumor vessel density in s.c. B16-F10 tumors from WT and Pfkfb3+/ΔEC mice (n=10–20). (C) Quantification of vessel lumen size in s.c. B16-F10 tumors from WT and Pfkfb3+/ΔEC mice (n=6) (D) Quantification of total perfusable area in s.c. B16-F10 tumors from WT and Pfkfb3+/ΔEC mice (n=6). (E) Quantification of the % of proliferating PHH3+ CD31+ ECs in s.c. B16-F10 tumors from WT and Pfkfb3+/ΔEC mice (n=5). (F) Quantification of the % of apoptotic TUNEL+ CD31+ ECs in s.c. B16-F10 tumors from WT and Pfkfb3+/ΔEC mice (n=11). (G) Micrographs of confocal images of CD31-stained thick sections of s.c. B16-F10 tumors from WT and Pfkfb3+/ΔEC mice. (H) Quantification of vessel tortuosity in (G) (n=10–12). (I) Micrographs of confocal images of CD31+ s.c. B16-F10 tumor sections from WT and Pfkfb3+/ΔEC mice. Nuclei are counterstained with DAPI. (J) Quantification of EC nuclei per cross-sectional tumor vessel length in (I) (n=11). (K) Micrographs of lectin-FITC perfused and CD31-stained vessels in s.c. B16-F10 tumors from WT and Pfkfb3+/ΔEC mice. (L) Quantification of vessel perfusion in s.c. B16-F10 tumors from WT and Pfkfb3+/ΔEC mice (n=9–12). (M) Micrographs of H&E and pimonidazole (PIMO) staining (brown zones within dotted lines) of hypoxic zones in s.c. B16-F10 tumors from WT and Pfkfb3+/ΔEC mice. (N) Quantification of PIMO+ area (n=14–17). Bars: 75 µm (A,K), 200 µm (G), 20 µm (I), 100 µm (M). All data are mean ± SEM. * p value < 0.05. A.U.: arbitrary units.
Figure 5
Figure 5. Effect of PFKFB3 inhibition on vessel characteristics in s.c. B16-F10 tumors
(A) Micrographs of CD31-stained sections of s.c. B16-F10 tumors from ctrl and 3PO-treated mice. (B) Quantification of tumor vessel density in s.c. B16-F10 tumors from ctrl and 3PO-treated mice (n=5). (C) Quantification of vessel lumen size in s.c. B16-F10 tumors from ctrl and 3PO-treated mice (n=5). (D) Quantification of total perfusable area (sum of lumen area of all vessels, % of tumor area) in s.c. B16-F10 tumors from ctrl and 3PO-treated mice (n=5). (E) Quantification of % of proliferating PHH3+ CD31+ ECs in s.c. B16-F10 tumors from ctrl and 3PO-treated mice (n=5–7). (F) Quantification of % of apoptotic TUNEL+ CD31+ ECs in s.c. B16-F10 tumors from ctrl and 3PO-treated mice (n=7–8). (G) Micrographs of confocal images of CD31-stained sections of s.c. B16-F10 tumor from ctrl and 3PO-treated mice. Nuclei are counterstained with DAPI. (H) Quantification of EC nuclei per cross-sectional tumor vessel length (n=11). (I) Micrographs of lectin-FITC perfused and CD31-stained vessels in s.c. B16-F10 tumors from ctrl and 3PO-treated mice. (J) Quantification of vessel perfusion in s.c. B16-F10 tumors from ctrl and 3PO-treated mice (n=8). (K) Micrographs of pimonidazole (PIMO) staining (brown zones within dotted lines) of hypoxic zones in s.c. B16-F10 tumors from ctrl and 3PO-treated mice. (L) Quantification of PIMO+ area in (K) (n=10). Bars: 50 µm (A), 20 µm (G), 75 µm (I), 100 µm (K). All data are mean ± SEM. * p value < 0.05. See also Figure S4.
Figure 6
Figure 6. Effect of PFKFB3 inhibition on EC Barrier Properties
(A) Micrographs of thick sections of s.c. B16-F10 tumors from WT or Pfkfb3+/ΔEC mice, double stained for VE-cadherin (VE-cadh) and CD31. (B) Micrographs of SEM images of B16-F10 tumor vessels in WT and Pfkfb3+/ΔEC mice. (C) Images of ctrl and 3PO-treated EC monolayers, stained for VE-cadherin (Arrows: intercellular gaps). (D) Quantification of continuous versus discontinuous junctions (junctional length, % of total junctional length) in control (ctrl) and 3PO-treated ECs (n=3). (E) Quantification of gap index in ctrl and 3PO-treated ECs (n=3). (F) Quantification of transendothelial electrical resistance (TEER) of ECs upon treatment with vehicle (ctrl), 3PO (5 µM), VEGF (100 ng/ml), or VEGF plus 3PO. Data are presented as cumulative change over 4 hr in monolayer resistance normalized to TEER value of control (n=4). (G) Micrographs of ECs showing internalized phRodo-dextran (red) upon treatment with vehicle (ctrl), 3PO or endocytosis blocker dynasore. Cells were visualized in blue by cyan fluorescent protein. (H) Quantification of phRodo-dextran fluorescence intensity in (G) (n= 16–48 cells; 3 independent measurements). (I) Micrographs of ECs labeled with FITC conjugated anti-VE-cadherin antibody for ctrl, VEGF, 3PO and VEGF + 3PO pretreatment. (J) Quantification of internalized VE-cadherin in (I) (n=3). Bars: 10 mm (A,B; G), 20 mm (C; I). A.U.: arbitrary units. Data in panels D,E,F,H,J are mean ± SEM. * p value < 0.05. A.U., arbitrary units. See also Figure S5.
Figure 7
Figure 7. Effect of PFKFB3 inhibition on expression of adhesion molecules and vessel maturation
(A) Micrographs of B16-F10 cancer cells (green) adhering to an EC monolayer upon single or combined treatment with vehicle (ctrl), 3PO (10 µM), IL-1β (1 ng/ml), and 3PO plus IL-1β. (B) Quantification of number of adherent cancer cells per well in (A) (n=4). (C) Quantification of transendothelial cancer cell migration through EC monolayer, stimulated with IL-1b (1 ng/ml) or TNF-a (10 ng/ml) without or with 3PO (10 µM) (n=5). (D) RT-PCR of mRNA expression levels of VCAM-1, ICAM-1 and E-selectin in ECs upon treatment with IL-1β alone (1 ng/ml) or together with 3PO (20 µM). Values are expressed relative to IL-1b stimulated cells (n=4–5). (E) Representative micrographs of B16-F10 tumor sections from ctrl and 3PO-treated mice co-stained for CD31 and ICAM1 with quantification of ICAM+ area (% of total vessel area) (n=5–6). Right panels: ICAM1 signal channel only. (F) Quantification of NF-κB luciferase reporter activity in ECs upon treatment with vehicle (ctrl), 3PO (20 µM), IL-1β (1 ng/ml) alone and together with 3PO (n=4). (G) Immunoblot of protein levels of phosphorylated p65 (p-p65) and total p65 (upper blot), and of phosphorylated IκBα (p-IκBα) and total IκBα (bottom blot) in ctrl and 3PO-treated ECs upon treatment with vehicle, 3PO (20 µM), IL-1b (1 ng/ml) alone and together with 3PO (20 µM). b-tubulin was used as loading control. (H) Densitometric quantifications of p-p65 (relative to total p65) in G (n=3). (I) Densitometric quantifications of p-IκBα (relative to total IκBα) in G (n=3). ND, not detectable. (J) Representative micrographs of p-p65 staining of tumor vessels in s.c. B16-F10 tumors of ctrl versus 3PO-treated mice and quantification of p-p65+ signal (average pixel intensity expressed in arbitrary units) (n=5). Arrows: ECs. The top and the bottom small images at the right show the p-p65 + DAPI channels only, with a higher magnification of the boxed areas. Dotted lines: vessel wall. (K) Micrographs of sections of s.c. B16-F10 tumors from WT and Pfkfb3+/ΔEC mice, stained for CD31 and NG-2. Nuclei are counterstained with DAPI. (L) Quantification of the % of pericyte-covered vessels in (K) (n=10–11). (M) Micrographs of B16-F10 tumor sections from WT and PFKFB3+/ΔEC mice, stained for CD31 and laminin to visualize the basement membrane. Quantification of % of laminin+ vessels is indicated (n=10–19). (N) Micrographs of sections of s.c. B16-F10 tumors from ctrl or 3PO-treated mice stained for CD31 and NG-2. Nuclei are counterstained with DAPI. (O) Quantification of the % of pericyte covered vessels in N (n=4–6). Bars: 75 µm (A; E; K; N), 10µm (J), 200 µm (M). All data are mean ± SEM. * p value < 0.05. See also Figure S6.
Figure 8
Figure 8. Effect of PFKFB3 inhibition on pericytes and delivery and efficacy of chemotherapy
(A) Analysis of glutamine oxidation (QO), fatty acid oxidation (FAO), glycolysis and glucose oxidation (GO) in pericytes (n=3). (B) Effect of 3PO on pericyte glycolysis flux (n=3). (C) Effect of 3PO on pericyte proliferation (left bar; n=6) and quiescence (flow cytometric analysis upon staining for EdU, right bar; n=3). (D) Micrographs of sections of s.c. B16-F10 tumors from ctrl and 3PO-treated mice stained for EC marker isolectin B4 (IB4), pericyte marker NG-2 and proliferation marker Ki67. Nuclei are counterstained with DAPI. Arrows: Ki67+ pericyte nuclei. Dotted lines in zoom-in panels: vessel wall. (E) Quantification of proliferating tumor vessel pericytes in (D) (n=4–5). (F) Micrographs of adherent ctrl and 3PO-pretreated pericytes (green) to an EC monolayer. (G) Quantification of adherent pericytes in (F) (n=5). (H) Immunoblot of protein levels of N-cadherin (N-cadh) in ctrl and 3PO-treated pericytes. Densitometric quantification is indicated (normalized to α-tubulin; n=3). (I) Growth curve of s.c. B16-F10 tumor upon treatment with vehicle (ctrl), 3PO (25 mg/kg; 3x/week initiated when tumors reached a volume of 100 mm3) and a sub-maximal dose of CPt (2.5 mg/kg administered every other day during the last week before the termination of the experiment), alone or together with 3PO (n=20–24). (J) Metastatic index of s.c. implanted B16-F10 cancer cells disseminating to the lungs from mice in (I). (K) Quantification of metastatic liver area upon portal vein injection of B16-F10 cancer cells in mice treated with vehicle (ctrl), 3PO (25 mg/kg daily for 5 consecutive days, initiated on the 3rd day after cancer cell injection, followed by 2 day drug holiday and 5 days of daily treatment), and a standard (maximal) dose of CPt (10 mg/kg administered on day 5 and 11 after cancer cell injection), alone and together with 3PO (n=10–11). (L) Images of B16-F10 tumor sections, stained for CPt-DNA adducts from tumors treated with vehicle (ctrl) or 3PO upon administration of a single dose of Cpt (10 mg/kg). Quantification of Cpt-DNA adducts is indicated (n=19). (M) Proliferation of cultured B16-F10 cancer cells upon treatment with 25 µM CPt in the presence of increasing concentrations of 3PO (n=4). Bars: 10 µm (D), 75 µm (F), 100 µm (L). All data are mean ± SEM. * p value < 0.05. For panels B,C and H, p values were calculated by mixed model statistics (Kenward-Roger Test). In panel I, the p value refers to CPt +3PO vs ctrl. See also Figure S7.

Comment in

Comment on

References

    1. Armulik A, Genove G, Betsholtz C. Pericytes: developmental, physiological, and pathological perspectives, problems, and promises. Developmental cell. 2011;21:193–215. - PubMed
    1. Benedito R, Roca C, Sorensen I, Adams S, Gossler A, Fruttiger M, Adams RH. The notch ligands Dll4 and Jagged1 have opposing effects on angiogenesis. Cell. 2009;137:1124–1135. - PubMed
    1. Blindt R, Bosserhoff AK, Dammers J, Krott N, Demircan L, Hoffmann R, Hanrath P, Weber C, Vogt F. Downregulation of N-cadherin in the neointima stimulates migration of smooth muscle cells by RhoA deactivation. Cardiovasc Res. 2004;62:212–222. - PubMed
    1. Bogetto L, Gabriele E, Cariati R, Dolcetti R, Spessotto P, Doglioni C, Boiocchi M, Perris R, Colombatti A. Bidirectional induction of the cognate receptor-ligand alpha4/VCAM-1 pair defines a novel mechanism of tumor intravasation. Blood. 2000;95:2397–2406. - PubMed
    1. Boulant S, Kural C, Zeeh JC, Ubelmann F, Kirchhausen T. Actin dynamics counteract membrane tension during clathrin-mediated endocytosis. Nat Cell Biol. 2011;13:1124–1131. - PMC - PubMed

MeSH terms