. 2017 Feb 2;20(2):261-273.e3.
doi: 10.1016/j.stem.2016.10.004. Epub 2016 Nov 17.

Two-Way Conversion between Lipogenic and Myogenic Fibroblastic Phenotypes Marks the Progression and Resolution of Lung Fibrosis

Affiliations

Two-Way Conversion between Lipogenic and Myogenic Fibroblastic Phenotypes Marks the Progression and Resolution of Lung Fibrosis

Elie El Agha et al. Cell Stem Cell. .

Erratum in

Abstract

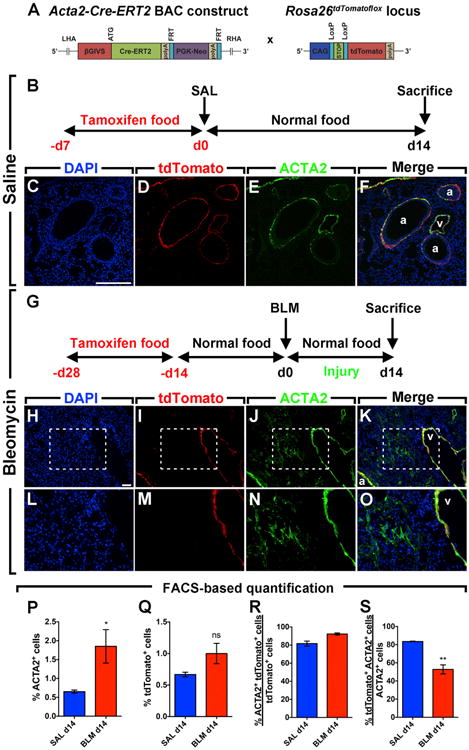
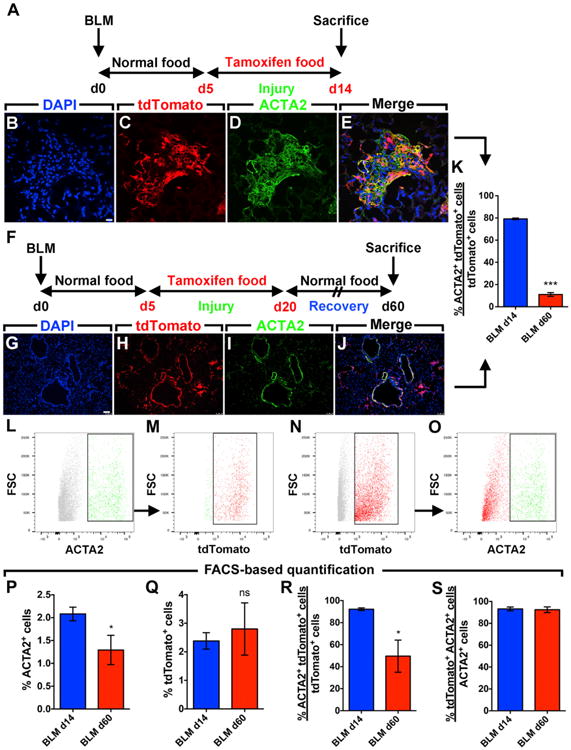
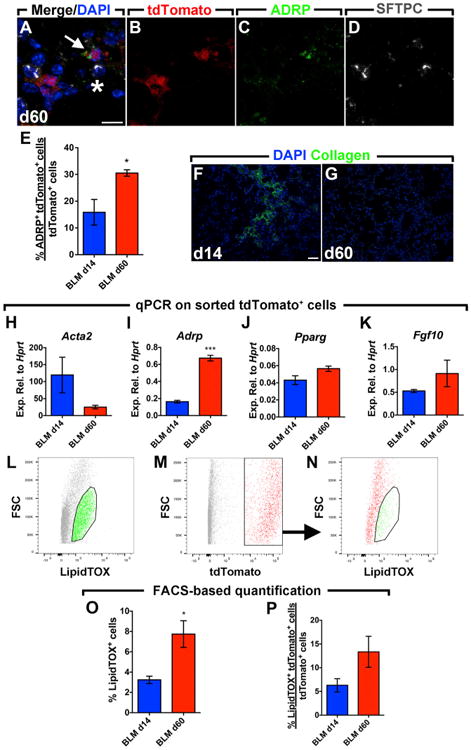
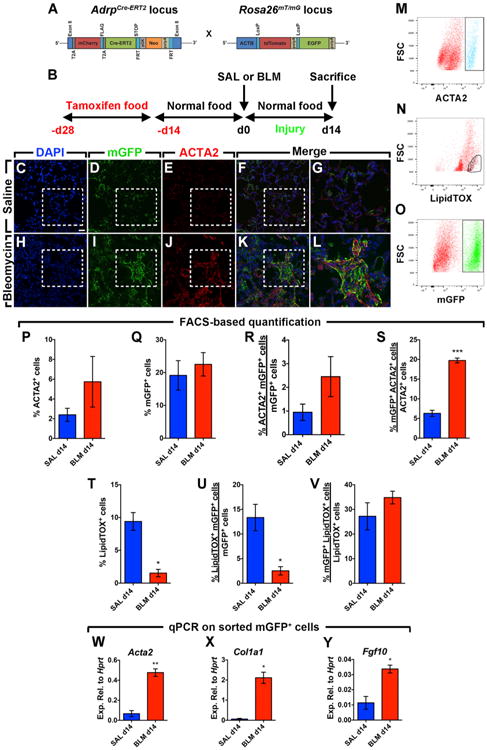
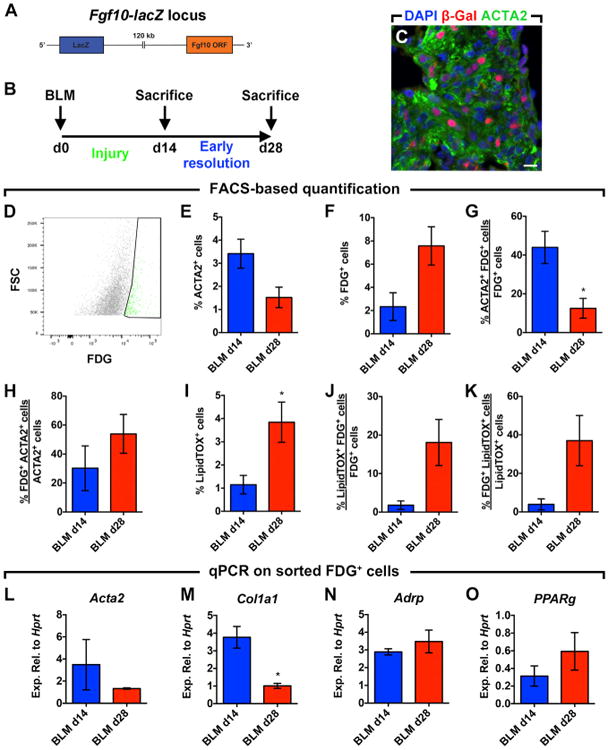
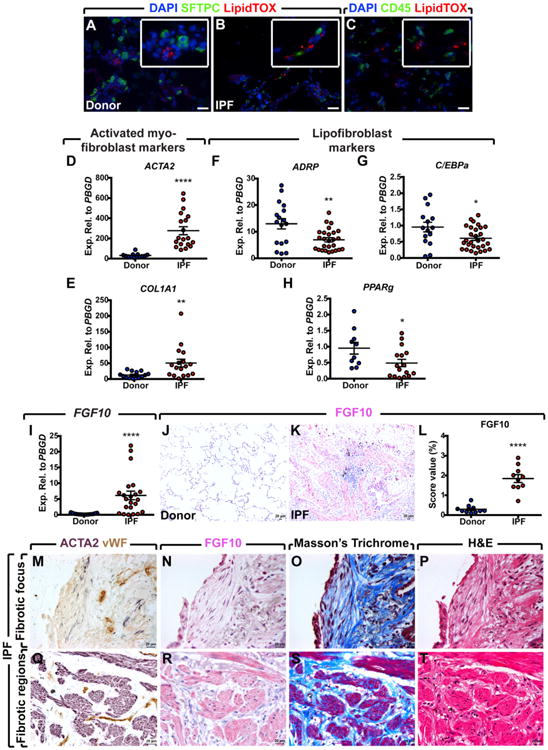
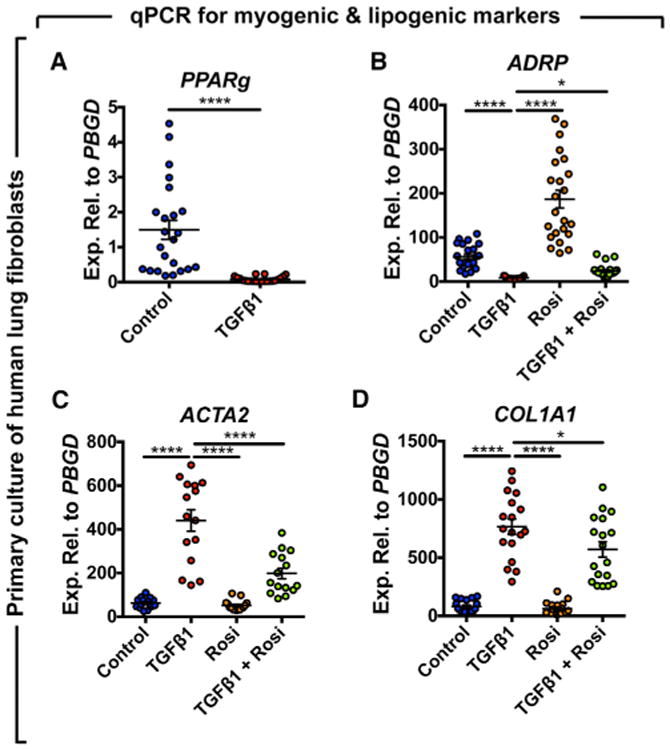
Idiopathic pulmonary fibrosis (IPF) is a form of progressive interstitial lung disease with unknown etiology. Due to a lack of effective treatment, IPF is associated with a high mortality rate. The hallmark feature of this disease is the accumulation of activated myofibroblasts that excessively deposit extracellular matrix proteins, thus compromising lung architecture and function and hindering gas exchange. Here we investigated the origin of activated myofibroblasts and the molecular mechanisms governing fibrosis formation and resolution. Genetic engineering in mice enables the time-controlled labeling and monitoring of lipogenic or myogenic populations of lung fibroblasts during fibrosis formation and resolution. Our data demonstrate a lipogenic-to-myogenic switch in fibroblastic phenotype during fibrosis formation. Conversely, we observed a myogenic-to-lipogenic switch during fibrosis resolution. Analysis of human lung tissues and primary human lung fibroblasts indicates that this fate switching is involved in IPF pathogenesis, opening potential therapeutic avenues to treat patients.


Figures

Figure 1
Figure 1. Activated Myofibroblasts Do Not Derive from Pre-existing Smooth Muscle Cells in Lung Fibrosis
(A) Schematic representation of the Acta2-Cre-ERT2 and tdTomatoflox constructs. (B) Timeline of tamoxifen and saline treatments. Mice were fed tamoxifen-containing pellets before saline was administered intratracheally. Lungs were harvested at 14 d.p.i. (C–F) Immunofluorescent staining showing DAPI, tdTomato, and ACTA2 single channels in addition to a merged image. (G) Timeline of tamoxifen and bleomycin treatments. Mice were fed tamoxifen-containing pellets for 2 weeks followed by 2 weeks of normal pellets before bleomycin was administered intratracheally. (H–K) Immunofluorescent staining showing DAPI, tdTomato, and ACTA2 single channels in addition to a merged image. (L–O) High-magnification images of the boxes in (H)–(K). (P–S) FACS-based quantification of tdTomato+ and ACTA2+ cell populations in saline and bleomycin-treated lungs at 14 d.p.i. Scale bars: (C)–(F), 250 μm; (H)–(K), 50 μm. a, airway; BLM, bleomycin; ns, not significant; SAL, saline; v, vessel. SAL d14, n = 4; BLM d14, n = 6; n represents biological replicates. Data are presented as mean values ± SEM. *p < 0.05, **p < 0.01.
Figure 2
Figure 2. Activated Myofibroblasts Lose Their Myogenic Phenotype following the Resolution of Fibrosis
(A) Timeline of bleomycin and tamoxifen treatments. Mice were treated with bleomycin and then fed tamoxifen-containing pellets between 5 and 14 d.p.i. Lungs were harvested at 14 d.p.i. (B–E) Immunofluorescent staining showing DAPI, tdTomato, and ACTA2 single channels in addition to a merged image. (F) Timeline of tamoxifen and bleomycin treatments. Mice were treated with bleomycin and then fed tamoxifen-containing pellets between 5 and 20 d.p.i. Lungs were harvested at 60 d.p.i. (G–J) Immunofluorescent staining showing DAPI, tdTomato, and ACTA2 single channels in addition to a merged image. (K) Quantification of the immunofluorescence shown in (B)–(E) and (G)–(J). (L–O) Gating strategy for FACS-based detection of ACTA2+ and tdTomato+ cell populations. (P–S) FACS-based quantification showing the change in the number of cells expressing ACTA2 and/or tdTomato. Scale bars: (B)–(E), 10 μm; (G)–(J), 75 μm. FSC, forward scatter. BLM d14, n = 6–8; BLM d60, n = 3; n represents biological replicates. Data are presented as mean values ± SEM. *p < 0.05, ***p < 0.001.
Figure 3
Figure 3. Activated Myofibroblasts Transition to a Lipofibroblast-like Phenotype after Fibrosis Resolution
(A–D) Immunofluorescent staining showing a merged image with DAPI in addition to tdTomato, ADRP, and SFTPC single channels. The arrow indicates an ADRP+ tdTomato+ cell adjacent to an SFTPC+ cell (asterisk). (E) Quantification of the immunofluorescence showing gain of ADRP expression in lineage-labeled cells at 60 d.p.i. compared to 14 d.p.i. (F and G) Immunofluorescent staining for collagen type 1 at 14 and 60 d.p.i. (H–K) qPCR for Acta2, Adrp, Pparg, and Fgf10 on lineage-labeled cells sorted from bleomycin-treated lungs at 14 and 60 d.p.i. (L–N) Gating strategy for the detection of LipidTOX+ and tdTomato+ cell populations by FACS. (O and P) FACS-based quantification of LipidTOX+ and tdTomato+ cell populations in lung suspensions at 14 and 60 d.p.i. Scale bars: (A)–(D), 10 μm; (F) and (G), 50 μm. BLM d14, n = 3–4; BLM d60, n = 2–4; n represents biological replicates. Data are presented as mean values ± SEM. *p < 0.05, ***p < 0.001.
Figure 4
Figure 4. Lipofibroblasts Give Rise to Activated Myofibroblasts during Fibrosis Formation
(A) Schematic representation of the AdrpCre-ERT2 and mT/mG constructs. (B) Timeline of tamoxifen and saline or bleomycin treatments. Mice were fed tamoxifen-containing pellets before saline or bleomycin was administered intratracheally. Lungs were harvested at 14 d.p.i. (C–F) Immunofluorescent staining of saline-treated lungs showing DAPI, mGFP, and ACTA2 single channels in addition to a merged image. (G) A high-magnification image of the region marked by the box in the merged image (F). (H–K) Immunofluorescent staining of bleomycin-treated lungs showing DAPI, mGFP, and ACTA2 single channels in addition to a merged image. (L) A high-magnification image of the region marked by the box in the merged image (K). (M–O) Gating strategy for the detection of ACTA2+, LipidTOX+, and mGFP+ cell populations by FACS. (P–V) FACS-based quantification of ACTA2+, mGFP+, and LipidTOX+ cell populations at 14 d.p.i. (W–Y) qPCR for Acta2, Col1a1, and Fgf10 on mGFP+ cells sorted from saline- and bleomycin-treated lungs at 14 d.p.i. Scale bar: 25 μm. SAL d14, n = 3; BLM d14, n = 3–4; n represents biological replicates. Data are presented as mean values ± SEM. *p < 0.05, **p < 0.01, ***p < 0.001.
Figure 5
Figure 5. Fgf10 Expression Marks Activated Myofibroblast Formation and Resolution
(A) Schematic representation of the Fgf10-lacZ construct. (B) Timeline for bleomycin treatment. Lungs were harvested at 14 or 28 d.p.i. (C) Immunofluorescent staining showing β-Gal+ cells in fibrotic (ACTA2+) areas of bleomycin-treated lungs at 14 d.p.i. (D) Gating strategy for the detection of the fluorescent lacZ substrate (FDG) by FACS. (E–K) FACS-based quantification of ACTA2+, FDG+, and LipidTOX+ cell populations at 14 and 28 d.p.i. (L–O) qPCR for Acta2, Col1a1, Adrp, and Pparg on FDG+ cells sorted from bleomycin-treated lungs at 14 and 28 d.p.i. Scale bar: 10 μm. BLM d14, n = 3; BLM d28, n = 3–4; n represents biological replicates. Data are presented as mean values ± SEM.*p < 0.05.
Figure 6
Figure 6. Human IPF Lungs Show Decreased Lipofibroblast Marker Expression and Increased FGF10 Expression
(A and B) LipidTOX staining of frozen lung tissue samples showing the presence of lipid-droplet-containing cells in close proximity to AEC2 in both donors and IPF patients. (C) Double staining for CD45 and LipidTOX showing that LipidTOX+ cells are CD45. (D–H) qPCR analysis on human lung homogenates showing significant upregulation of myofibroblast markers ACTA2 and COL1A, and significant downregulation of lipofibroblast differentiation markers ADRP, C/EBPa, and PPARg in IPF lungs compared to donor lungs. (I) qPCR analysis showing a significant increase in FGF10 expression in IPF lungs compared to donor lungs. (J and K) Immunohistochemical staining for FGF10 showing increased expression levels in IPF lungs compared to donor lungs. (L) Quantification of FGF10 immunoreactivity shown in (J) and (K). (M–P) Serial sections of a fibrotic focus stained with anti-ACTA2, anti-vWF, and anti-FGF10 antibodies in addition to Masson's trichrome and H&E stains. A similar staining is shown for dense fibrotic regions. (Q–T) Weaker FGF10 immunoreactivity is observed in the fibrotic focus compared to fibrotic regions. Scale bars: 20 μm. Donors: n = 12–17; IPF: n = 21–29 (D–H). n = 10 per group (J–L), n represents biological replicates. Data are presented as mean values ± SEM. *p < 0.05, **p < 0.01, ****p < 0.0001.
Figure 7
Figure 7. Rosiglitazone Reinforces the Lipogenic Phenotype in Human Lung Fibroblasts and Attenuates TGFβ1-Mediated Fibrogenesis
Cells were starved for 24 hr before being treated with 1 ng/mL recombinant TGFβ1 and/or 20 μM rosiglitazone. After 72 hr, cells were harvested and gene expression was analyzed by qPCR. (A) TGFβ1 strongly inhibits PPARg expression. (B) Rosiglitazone induces the expression of ADRP and attenuates TGFβ1-mediated downregulation. (C and D) TGFβ1 significantly upregulates ACTA2 and COL1A1 and rosiglitazone attenuates this effect. Rosi, rosiglitazone. Control, n = 18–23; TGFβ1, n = 15–22; Rosi, n = 15–23; TGFβ1+Rosi, n = 15–24; n represents biological replicates. Data are presented as mean values ± SEM. *p < 0.05, ****p < 0.0001.

Comment in

  • Mesenchymal metamorphosis.
    Bhattacharya M. Bhattacharya M. Sci Transl Med. 2016 Dec 21;8(370):370ec202. doi: 10.1126/scitranslmed.aal3700. Sci Transl Med. 2016. PMID: 28003541 No abstract available.

Similar articles

Cited by

References

    1. El Agha E, Herold S, Al Alam D, Quantius J, MacKenzie B, Carraro G, Moiseenko A, Chao CM, Minoo P, Seeger W, Bellusci S. Fgf10-positive cells represent a progenitor cell population during lung development and postnatally. Development. 2014;141:296–306. - PMC - PubMed
    1. Ahlbrecht K, McGowan SE. In search of the elusive lipofibroblast in human lungs. Am J Physiol Lung Cell Mol Physiol. 2014;307:L605–L608. - PubMed
    1. Akhmetshina A, Palumbo K, Dees C, Bergmann C, Venalis P, Zerr P, Horn A, Kireva T, Beyer C, Zwerina J, et al. Activation of canonical Wnt signalling is required for TGF-β-mediated fibrosis. Nat Commun. 2012;3:735. - PMC - PubMed
    1. Asaki T, Konishi M, Miyake A, Kato S, Tomizawa M, Itoh N. Roles of fibroblast growth factor 10 (Fgf10) in adipogenesis in vivo. Mol Cell Endocrinol. 2004;218:119–128. - PubMed
    1. Barkauskas CE, Cronce MJ, Rackley CR, Bowie EJ, Keene DR, Stripp BR, Randell SH, Noble PW, Hogan BLM. Type 2 alveolar cells are stem cells in adult lung. J Clin Invest. 2013;123:3025–3036. - PMC - PubMed

Publication types

MeSH terms