. 2017 Feb 2;20(2):218-232.e5.
doi: 10.1016/j.stem.2016.10.005. Epub 2016 Nov 17.

Cardiac Fibroblasts Adopt Osteogenic Fates and Can Be Targeted to Attenuate Pathological Heart Calcification

Affiliations

Cardiac Fibroblasts Adopt Osteogenic Fates and Can Be Targeted to Attenuate Pathological Heart Calcification

Indulekha C L Pillai et al. Cell Stem Cell. .

Abstract

Mammalian tissues calcify with age and injury. Analogous to bone formation, osteogenic cells are thought to be recruited to the affected tissue and induce mineralization. In the heart, calcification of cardiac muscle leads to conduction system disturbances and is one of the most common pathologies underlying heart blocks. However the cell identity and mechanisms contributing to pathological heart muscle calcification remain unknown. Using lineage tracing, murine models of heart calcification and in vivo transplantation assays, we show that cardiac fibroblasts (CFs) adopt an osteoblast cell-like fate and contribute directly to heart muscle calcification. Small-molecule inhibition of ENPP1, an enzyme that is induced upon injury and regulates bone mineralization, significantly attenuated cardiac calcification. Inhibitors of bone mineralization completely prevented ectopic cardiac calcification and improved post injury heart function. Taken together, these findings highlight the plasticity of fibroblasts in contributing to ectopic calcification and identify pharmacological targets for therapeutic development.


Figures

Figure 1
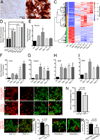
Figure 1. Cardiac fibroblasts (CFs) can adopt osteogenic cell like fates and contribute to calcification in vitro
(A,B) Cardiac fibroblasts stained with Alizarin Red following 21 day treatment with (A) control medium or (B) osteogenic differentiation medium (arrowheads point to calcium deposition) (n=20). (C) Heatmap of temporal changes in gene expression of CFs undergoing osteogenic differentiation. Each row represents the scaled expression level of a gene across the 21-day differentiation period with red designating high expression and blue low expression). The genes are clustered into 4 main groups blue, magenta, orange and green. The blue cluster includes 470 genes and is dominated by low expression in the control samples and peak expression at the later time point day 14 and 21. The magenta cluster includes 91 genes and is dominated by peak expression at day 7. The orange cluster includes 466 genes and is dominated by peak expression at day 14. The green cluster includes 660 genes and is dominated by peak expression in the control samples with low expression throughout the differentiation period (n=2 independent cultures/time point are shown. Ctrl 1 and 2 represent control CFs harvested at Day 0). (D) Bar chart of the mean expression fold change of CFs undergoing osteogenic differentiation across a set of 37 osteogenic related genes with 2 samples analyzed at each time point. (*p<0.002, compared to controls). (E–I) q-PCR to confirm changes in expression of canonical osteoblast genes (E) Runx2 (F) osteocalcin (OCN) (G) Osterix (Osx) (H) Bone sialoprotein (BSP) (I) Osteopontin (OPN) in CFs induced to differentiate (mean±S.E.M., n=3, *p<0.05 compared to control) (J–N) CFs isolated from Col1a2-CreERT:R26RtdTomato or FSP1Cre:R26RtdTomato mice were subjected to osteogenic differentiation and wells stained for calcium hydroxyapatite (HA) (green) following 21 day treatment with (J,L) control medium or (K,M) differentiation medium (representative images, n=6, arrows show tdTomato labeled CFs surrounded by calcium hydroxyapatite) (N) Area of mineralization induced by differentiation of CFs labeled by the Col1a2 or FSP1Cre drivers (n=6). (O) Calcium HA (green) deposition following differentiation of FSP1 labeled Sca-1+ and Sca-1 negative fractions and (P) quantitation of the area of mineralization (representative images, mean±S.E.M, n=6) (Q) Calcium HA deposition following osteogenic differentiation of FSP1 labeled PDGFRβ+ and PDGFRβ negative fractions and (R) Quantitation of the area of mineralization (representative images, mean±S.E.M, n=5).
Figure 2
Figure 2. Cardiac fibroblasts (CFs) can adopt osteogenic cell like fates in murine models of myocardial calcification
(A–H) Hearts of C3H mice demonstrating (A,B) absence of any calcification in the uninjured state, but calcific lesions following (C,D) high dose systemic steroids (E,F) cryo-injury or (G,H) ischemic injury; (blue arrowheads; representative images, n=15) (B–H) Von Kossa staining to identify calcium deposition. (I,J) Region of myocardial calcification (following systemic steroids) stained with (I) Von Kossa or (J) Masson trichrome showing region of calcification (I, arrowheads) associated with collagen deposition (J, arrowheads). (K) Experimental strategy for labeling CFs and induction of cardiac calcification. (L-N) Uninjured hearts of Col1a2-CreERT:R26RtdTomato mice do not have calcium (blue), nor do labeled fibroblasts express osteogenic markers (green). (O-T) Expression of osteogenic markers in labeled CFs following systemic steroid administration showing calcium HA formation within the myocardium (blue, arrowheads), tdTomato labeled cardiac fibroblasts (red, arrowheads), osteogenic markers (green, arrowheads) (O) Runx2, (Q) Osteocalcin and (S) Osterix with merged image demonstrating labeled fibroblasts expressing osteogenic markers (arrowheads). (P-T) Magnified images demonstrating labeled CFs expressing osteogenic markers in close proximity to the deposited calcium HA (arrowheads, representative images, n=5). (U) Quantitation of the fraction of tdTomato labeled CFs expressing osteogenic markers in hearts of uninjured or steroid injected animals (mean±S.E.M., n=3, *p<0.05, compared to control uninjured hearts).
Figure 3
Figure 3. Cardiac fibroblasts (CFs) express osteogenic markers in myocardial calcification induced by cryo injury or myocardial infarction
Col1a2CreERT:R26RtdTomato mice (C3H background) were subjected to (A–F) cryo injury or (G–K) myocardial infarction and calcified region of the heart analyzed (A) Section through the calcified injured region demonstrates abundant tdTomato cells (red, arrows) present within deposits of calcium hydroxyapatite (green). (B,C) Low magnification images of tdTomato labeled CFs expressing (B) Runx2 and (C) Osteocalcin (OCN) (representative images, n=5). (D,E) Higher magnification images of tdTomato labeled CFs (arrows) expressing (D) Runx2 or (E) OCN with merged image demonstrating colocalization of fluorophores (arrows). (F) Quantitation of the fraction of labeled CFs expressing Runx2 and OCN in uninjured versus cryo-injured calcific regions (mean±S.E.M., n=3, *p<0.001 compared to uninjured control hearts). (G–K) Immunofluorescent staining of calcific regions of infarcted hearts of Col1a2CreERT:R26RtdTomato animals 4 weeks after infarction shows tdTomato labeled cells (arrows) in area of calcification expressing (G) Runx2 with merged image showing tdTomato cells expressing Runx2 (arrows) and (H) in higher magnification or (I) OCN with merged image demonstrating tdTomato cells expressing OCN (arrows) and (J) in higher magnification. (K) Quantitation of the fraction of tdTomato labeled CFs expressing Runx2 or OCN in uninjured and calcified regions of infarcted hearts (mean±S.E.M., n=3, *p<0.01 compared to control uninjured hearts).
Figure 4
Figure 4. Cardiac fibroblasts (CFs) identified by the TCF21 label express osteogenic markers following cryo-injury induced cardiac calcification
(A–B) Heart sections of tamoxifen injected but uninjured TCF21MerCreMer:R26RtdTomato (C3H background) hearts show tdTomato cells not expressing (A)Runx2 or (B)OCN. (C,D) Immunofluorescent staining of injured calcified regions shows multiple tdTomato labeled cells expressing (C) Runx2 or (D) OCN (merged image, arrowheads) (representative images, n=3). (E) Quantitation of tdTomato labeled CFs expressing Runx2 and OCN in calcified regions versus uninjured TCF21MerCreMer:R26RtdTomato mice (mean±S.E.M., n=3, *p<0.05)
Figure 5
Figure 5. Fibroblasts isolated from calcific heart lesions can induce soft tissue calcification when injected into another host
(A) Experimental strategy where genetically labeled cardiac fibroblasts (CFs) harvested following explant culture of calcified or uninjured myocardium are injected into subcutaneous pockets fashioned on the dorsum of animals. Medium without cells is injected into a third pocket over the lower dorsum. (B) Explant culture of calcified myocardial lesion (cryo-injury induced) with tdTomato labeled CFs migrating from the lesion (arrowheads) (C,D) Migrating tdTomato labeled cells expressing (C) Runx2 and (D) OCN (green, arrowheads) and (E) quantification of the fraction of migrating tdTomato labeled CFs expressing Runx2 or OCN (representative images, n=3, mean±S.E.M, n=8, *p<0.01 and **p<0.001 compared to fibroblasts from uninjured animals). (F) Surgical technique of injecting tdTomato labeled cells into subcutaneous pocket, where a single incision and blunt dissection was performed to create a pocket and sutured to close the pocket following injection of cells. (G) Dorsum of representative animal demonstrating typical sites of injection (solid arrowhead-area of injection of tdTomato cells isolated from calcific myocardium; unfilled arrowhead-area of injection of tdTomato cells isolated from uninjured myocardium; yellow unfilled arrowhead-area of injection of medium without cells) (H–I) CT scan showing (H) lateral view with minimal calcification noted in region of injection of medium without cells (yellow unfilled arrowhead) and robust calcification in area injected with labeled fibroblasts from calcific myocardium (solid arrowhead) (I) Antero-posterior view demonstrating minimal calcification on region injected with labeled fibroblasts from uninjured myocardial explant cultures (unfilled arrowhead) in contrast to that noted with injection of cells from calcific myocardium (solid arrowhead) (J) Quantification of the extent of calcification expressed as a fold change compared to region injected without cells. Fold change was calculated by comparing the density of calcification in Hounsfield units (mean±S.E.M., n=8, *p<0.05, one way Anova with Tukey’s post test analysis) (K)18NaF PET scan demonstrating increased signal in region injected with labeled fibroblasts from calcific myocardium (solid arrowhead) compared to that injected with fibroblasts from uninjured myocardium (unfilled arrowhead) (representative images, n=8) (L) Merged PET/CT scan demonstrating co-localization of PET signal in region of subcutaneous soft tissue calcification seen on CT (arrowhead) (PET signals are normalized to injected dose (ID) and images presented as percent injected dose per gram (%ID/g). (M–N) Histological staining of subcutaneous calcific tissue dissected from dorsal subcutaneous pocket with (M) Von Kossa and (N) Hematoxylin-eosin stains identifies areas of calcification (yellow arrows). (O–T) Immunofluorescent staining of calcific region in dissected subcutaneous tissue shows (O) expression of OCN or (P) Runx2 by tdTomato labeled cells (arrowheads) with (Q,R) corresponding merged images with bright field demonstrating expression of (Q) OCN or (R) Runx2 by tdTomato labeled cells (solid arrowheads) residing on edges of calcific deposits (unfilled arrowheads) and (S,T) higher magnification of merged image with bright field showing tdTomato labeled cells expressing (S) OCN or (T) Runx2. (representative images, n=4)
Figure 6
Figure 6. Role of ENPP1-PPi-Pi axis in ectopic cardiac calcification
(A) Expression of ENPP1 by qPCR in injured and uninjured regions of hearts of B6 and C3H mice 7 days after cryo injury (mean± S.E.M., n=6, *p<0.01). (B–D) Immunofluorescent staining for ENPP1 in (B) uninjured B6 heart (C) injured B6 heart and (D) uninjured C3H heart (green, arrowheads). (E–G) Immunofluorescent staining of (E) ENPP1 in injured calcified regions of Col1a2Cre:R26Rtdtomato (C3H) heart (arrowheads) (F) ENPP1 expressing cells in higher magnification (G) tdTomato expressing fibroblasts in the same field and (H) merged image demonstrating expression of ENPP1 by tdTomato cells (arrowheads). (I) Confocal Raman microscopy demonstrating spectra of myocardial calcific deposits (blue line) compared to that of pure CPPD (black line) and hydroxyapatite (HA, red line) crystals (n=3). (J) Phosphate concentrations in injured and uninjured regions of non-calcified (B6) and calcified hearts (C3H) (mean±S.E.M.; n=6 animals; *p<0.01). (K–P) Cryo injured C3H animals treated with (K,M) vehicle or ENPP1 inhibitor (L,N) SYL-001 or (O,P) ARL67156 demonstrating calcium deposition on (K–O) gross inspection and (M–P) CT scan and following 3D reconstruction (ribs removed to visualize cardiac calcification in retrosternal region) (yellow and white arrow) (Q) Biochemical measurements of myocardial calcium deposits (n=6 in vehicle treated and n=9 animals for SYL-001 and n=5 or ARL67156, mean±S.E.M., *p<0.05 versus vehicle injected group). (R–U) Cryo-injured C3H animals treated with (R,S) normal saline or (T,U) etidronate demonstrating calcification on (R,T) gross inspection and (S,U) CT scan and following 3D reconstruction (yellow and white arrow). Note complete absence of any calcium deposits in the etidronate injected animals (representative images of n=3 for vehicle treated animals and n=6 for etidronate injected animals)
Figure 7
Figure 7. Inhibition of calcification following injury is associated with better preservation of cardiac function
(A,B) 2D Echocardiography 7 days after cardiac cryo-injury in C3H mice treated with either (A) vehicle or (B) etidronate (representative images of n=6 animals for vehicle and n=8 animals for etidronate (C–F) Quantitation of (C) Ieft ventricular end diastolic dimension (LVEDD) and (D) left ventricular end systolic dimension (LVESD) (E) ejection fraction and (F) fractional shortening pre injury, post injury and following sham injury in vehicle and etidronate injected animals. (p<0.05, mean±S.E.M., n=6 in vehicle, n=8 in etidronate and n=4 in sham injured groups, ns: p>0.05)

Comment in

References

    1. Abdallah BM, Ditzel N, Kassem M. Assessment of bone formation capacity using in vivo transplantation assays: procedure and tissue analysis. Methods Mol Biol. 2008;455:89–100. - PubMed
    1. Acharya A, Baek ST, Banfi S, Eskiocak B, Tallquist MD. Efficient inducible Cre-mediated recombination in Tcf21 cell lineages in the heart and kidney. Genesis. 2011;49:870–877. - PMC - PubMed
    1. Aherrahrou Z, Axtner SB, Kaczmarek PM, Jurat A, Korff S, Doehring LC, Weichenhan D, Katus HA, Ivandic BT. A locus on chromosome 7 determines dramatic up-regulation of osteopontin in dystrophic cardiac calcification in mice. Am J Pathol. 2004;164:1379–1387. - PMC - PubMed
    1. Buttitta LA, Edgar BA. Mechanisms controlling cell cycle exit upon terminal differentiation. Curr Opin Cell Biol. 2007;19:697–704. - PMC - PubMed
    1. Chen C, Uludag H, Wang Z, Jiang H. Noggin suppression decreases BMP-2-induced osteogenesis of human bone marrow-derived mesenchymal stem cells in vitro. J Cell Biochem. 2012;113:3672–3680. - PubMed

Publication types

MeSH terms