

High-throughput monitoring of wild bee diversity and abundance via mitogenomics
- PMID: 27867467
- PMCID: PMC5111398
- DOI: 10.1111/2041-210X.12416
High-throughput monitoring of wild bee diversity and abundance via mitogenomics
Abstract
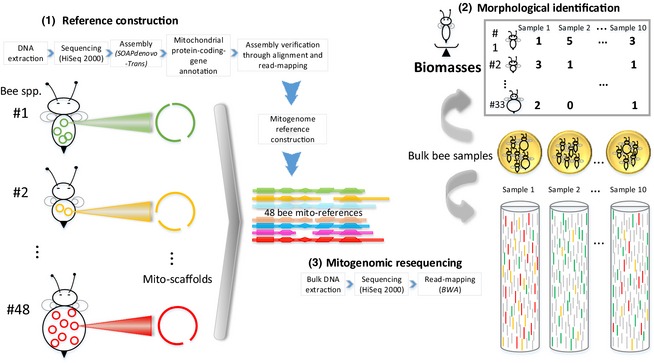
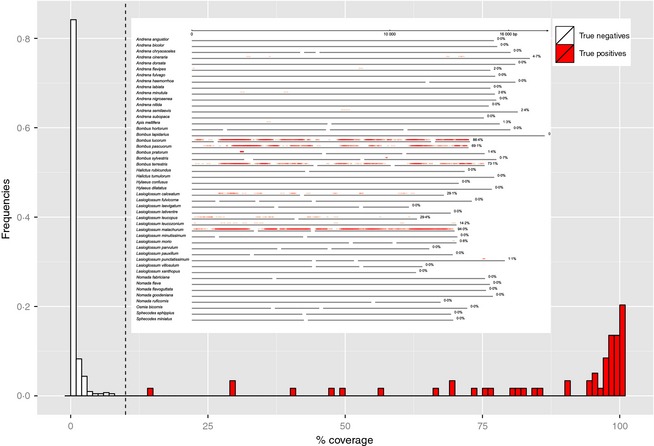
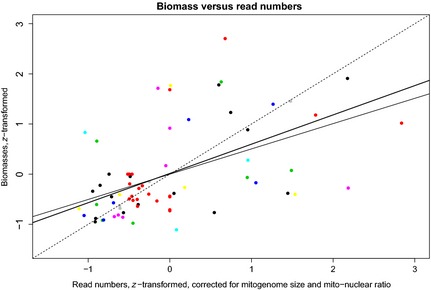
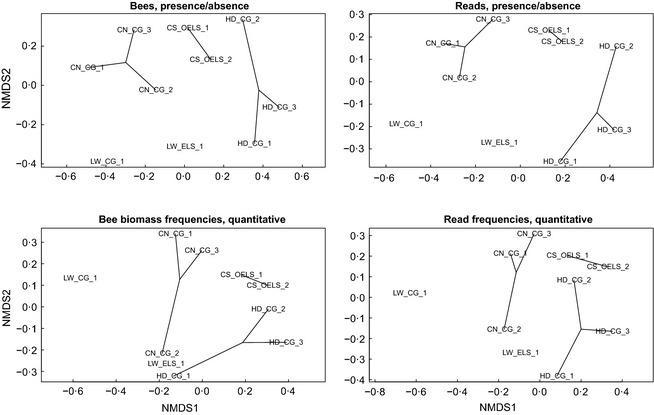
Bee populations and other pollinators face multiple, synergistically acting threats, which have led to population declines, loss of local species richness and pollination services, and extinctions. However, our understanding of the degree, distribution and causes of declines is patchy, in part due to inadequate monitoring systems, with the challenge of taxonomic identification posing a major logistical barrier. Pollinator conservation would benefit from a high-throughput identification pipeline.We show that the metagenomic mining and resequencing of mitochondrial genomes (mitogenomics) can be applied successfully to bulk samples of wild bees. We assembled the mitogenomes of 48 UK bee species and then shotgun-sequenced total DNA extracted from 204 whole bees that had been collected in 10 pan-trap samples from farms in England and been identified morphologically to 33 species. Each sample data set was mapped against the 48 reference mitogenomes.The morphological and mitogenomic data sets were highly congruent. Out of 63 total species detections in the morphological data set, the mitogenomic data set made 59 correct detections (93·7% detection rate) and detected six more species (putative false positives). Direct inspection and an analysis with species-specific primers suggested that these putative false positives were most likely due to incorrect morphological IDs. Read frequency significantly predicted species biomass frequency (R2 = 24·9%). Species lists, biomass frequencies, extrapolated species richness and community structure were recovered with less error than in a metabarcoding pipeline.Mitogenomics automates the onerous task of taxonomic identification, even for cryptic species, allowing the tracking of changes in species richness and distributions. A mitogenomic pipeline should thus be able to contain costs, maintain consistently high-quality data over long time series, incorporate retrospective taxonomic revisions and provide an auditable evidence trail. Mitogenomic data sets also provide estimates of species counts within samples and thus have potential for tracking population trajectories.
Keywords: Hymenoptera; agri‐environment schemes; biodiversity and ecosystem services; farmland biodiversity; genome skimming; metabarcoding; metagenomics; mitogenomes; neonicotinoids; pollination.
Figures
Similar articles
-
Evaluating next-generation sequencing (NGS) methods for routine monitoring of wild bees: Metabarcoding, mitogenomics or NGS barcoding.Mol Ecol Resour. 2019 Jul;19(4):847-862. doi: 10.1111/1755-0998.13013. Epub 2019 Apr 29. Mol Ecol Resour. 2019. PMID: 30912868 Free PMC article.
-
Comparing modern identification methods for wild bees: Metabarcoding and image-based morphological taxonomic assignment.PLoS One. 2024 Apr 2;19(4):e0301474. doi: 10.1371/journal.pone.0301474. eCollection 2024. PLoS One. 2024. PMID: 38564614 Free PMC article.
-
SPIKEPIPE: A metagenomic pipeline for the accurate quantification of eukaryotic species occurrences and intraspecific abundance change using DNA barcodes or mitogenomes.Mol Ecol Resour. 2020 Jan;20(1):256-267. doi: 10.1111/1755-0998.13057. Epub 2019 Aug 7. Mol Ecol Resour. 2020. PMID: 31293086
-
The effects of urbanization on pollinators and pollination: A meta-analysis.Ecol Lett. 2023 Sep;26(9):1629-1642. doi: 10.1111/ele.14277. Epub 2023 Jun 22. Ecol Lett. 2023. PMID: 37345567 Review.
-
Critical links between biodiversity and health in wild bee conservation.Trends Ecol Evol. 2022 Apr;37(4):309-321. doi: 10.1016/j.tree.2021.11.013. Epub 2021 Dec 23. Trends Ecol Evol. 2022. PMID: 34955328 Review.
Cited by
-
Pollination ecology in China from 1977 to 2017.Plant Divers. 2018 Aug 7;40(4):172-180. doi: 10.1016/j.pld.2018.07.007. eCollection 2018 Aug. Plant Divers. 2018. PMID: 30740562 Free PMC article. Review.
-
Sorting things out: Assessing effects of unequal specimen biomass on DNA metabarcoding.Ecol Evol. 2017 Jul 28;7(17):6918-6926. doi: 10.1002/ece3.3192. eCollection 2017 Sep. Ecol Evol. 2017. PMID: 28904771 Free PMC article.
-
Strategies for sample labelling and library preparation in DNA metabarcoding studies.Mol Ecol Resour. 2022 May;22(4):1231-1246. doi: 10.1111/1755-0998.13512. Epub 2021 Oct 13. Mol Ecol Resour. 2022. PMID: 34551203 Free PMC article. Review.
-
A DNA barcode-based survey of wild urban bees in the Loire Valley, France.Sci Rep. 2021 Feb 26;11(1):4770. doi: 10.1038/s41598-021-83631-0. Sci Rep. 2021. PMID: 33637824 Free PMC article.
-
The potential of genomics for restoring ecosystems and biodiversity.Nat Rev Genet. 2019 Oct;20(10):615-628. doi: 10.1038/s41576-019-0152-0. Epub 2019 Jul 12. Nat Rev Genet. 2019. PMID: 31300751 Review.
References
-
- Amend, A.S. , Seifert, K.A. & Bruns, T.D. (2010) Quantifying microbial communities with 454 pyrosequencing: does read abundance count? Molecular Ecology, 19, 5555–5565. - PubMed
-
- Andújar, C. , Arribas, P. , Ruzicka, F. , Crampton‐Platt, A. , Timmermans, M.J.T.N. & Vogler, A.P. (2015) Phylogenetic community ecology of soil biodiversity using mitochondrial metagenomics. Molecular Ecology. doi:10.1111/mec.13195 [Epub ahead of print]. - DOI - PubMed
-
- Biesmeijer, J.C. , Roberts, S.P.M. , Reemer, M. , Ohlemuller, R. , Edwards, M. , Peeters, T. et al (2006) Parallel declines in pollinators and insect‐pollinated plants in Britain and the Netherlands. Science, 313, 351–354. - PubMed
-
- Breeze, T.D. , Bailey, A.P. , Balcombe, K.G. & Potts, S.G. (2011) Pollination services in the UK: how important are honeybees? Agriculture Ecosystems & Environment, 142, 137–143.
LinkOut - more resources
Full Text Sources
Other Literature Sources