. 2016 Nov 15:2:16041.
doi: 10.1038/celldisc.2016.41. eCollection 2016.

NANOG reprograms prostate cancer cells to castration resistance via dynamically repressing and engaging the AR/FOXA1 signaling axis

Affiliations

NANOG reprograms prostate cancer cells to castration resistance via dynamically repressing and engaging the AR/FOXA1 signaling axis

Collene R Jeter et al. Cell Discov. .

Abstract

The pluripotency transcription factor NANOG has been implicated in tumor development, and NANOG-expressing cancer cells manifest stem cell properties that sustain tumor homeostasis, mediate therapy resistance and fuel tumor progression. However, how NANOG converges on somatic circuitry to trigger oncogenic reprogramming remains obscure. We previously reported that inducible NANOG expression propels the emergence of aggressive castration-resistant prostate cancer phenotypes. Here we first show that endogenous NANOG is required for the growth of castration-resistant prostate cancer xenografts. Genome-wide chromatin immunoprecipitation sequencing coupled with biochemical assays unexpectedly reveals that NANOG co-occupies a distinctive proportion of androgen receptor/Forkhead box A1 genomic loci and physically interacts with androgen receptor and Forkhead box A1. Integrative analysis of chromatin immunoprecipitation sequencing and time-resolved RNA sequencing demonstrates that NANOG dynamically alters androgen receptor/Forkhead box A1 signaling leading to both repression of androgen receptor-regulated pro-differentiation genes and induction of genes associated with cell cycle, stem cells, cell motility and castration resistance. Our studies reveal global molecular mechanisms whereby NANOG reprograms prostate cancer cells to a clinically relevant castration-resistant stem cell-like state driven by distinct NANOG-regulated gene clusters that correlate with patient survival. Thus, reprogramming factors such as NANOG may converge on and alter lineage-specific master transcription factors broadly in somatic cancers, thereby facilitating malignant disease progression and providing a novel route for therapeutic resistance.

Keywords: AR; FOXA1; NANOG; cancer stem cells; castration resistance; prostate cancer.


Figures

Figure 1
Figure 1
Requirement of NANOG for CRPC growth. (a) NANOG western blot analysis (Cell Signaling, D73G4; Supplementary Table S1) in LAPC4 and LAPC9 tumors serially passaged in castrated (AI; passage number indicated) vs intact (AD) hosts. The blot was probed for AR, FOXA1 and GAPDH. *, a non-specific band. Note that the NANOG band upregulated in LAPC9 AI tumors was relatively faint, although the upregulation was corroborated by immunohistochemical (IHC) (b) and confocal immunofluorescence (IF) analysis (c). (b) IHC staining for NANOG (Kamiya; Supplementary Table S1) in AD vs AI LAPC4 and LAPC9 xenografts. Shown on top is the NANOG staining of LNCaP tumors grown in castrated hosts (pLVX, control cells expressing empty vector). (c) Representative confocal IF images for NANOG (Cell Signaling, D73G4) in AD vs AI LAPC9 tumors. (d, e) Freshly purified LAPC4 and LAPC9 AI cells were transduced with the indicated lentiviral Nanog-short interfering RNA construct (vs LL3.7 control) and subcutaneously injected (1 K or 10 K) in castrated nonobese diabetic/severe combined immunodeficiency mice (n=8–12). Endpoint tumor weight (mean±s.d.), P-values for weight (Student’s t-test) and tumor incidence (χ2-test for statistic) are indicated. (f) Enzalutamide resistance in LNCaP cells overexpressing NP8 relative to pLVX control. LNCaP-pLVX and LNCaP-NP8 cells were plated in the presence of DOX (1 μg ml−1, 48 h) and then cultured in charcoal-dextran stripped serum plus 40 μm MDV3100 for the indicated time periods. Presented is the % cell viability upon MDV3100 treatment. **P<0.01. NS, nonsignificant.
Figure 2
Figure 2
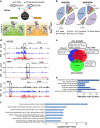
Distinct genomic occupancy of NANOG. (a) Scheme for ChIP-Seq and RNA-Seq in LNCaP cells expressing NANOG1 (N1) or NANOGP8 (NP8) vs vector control (pLVX) for the indicated time with or without DOX. (b) Genomic distribution of NANOG occupancy relative to the transcription start site (TSS) or transcription end site (TES) of the nearest gene. 5′ distal (−15 kb to −5 kb from the TSS), promoter (−5 kb to +0.5 kb from the TSS), 3′ proximal (−0.5 kb to +5 kb from TES), 3′ distal (+5 kb to +15 kb from the TES); gene desert is all other genomic regions. (c) Venn diagram of the promoter region (−8 kb to +2 kb) occupancy of NANOG in ESCs [16] vs N1 and NP8 in LNCaP cells. (d) Representative ChIP-Seq traces recovered from the UCSC genome browser. (e) Promoter region (−8 kb to +2 kb) occupancy gene ontology (GO) analysis via DAVID. Presented are GO Term Biological Processes, level 4; *P<0.05; **P<0.01; ***P<0.001. (f) Distal occupancy GO analysis via GREAT. MSigDB correlations are shown and plotted according to the binomial raw P-value.
Figure 3
Figure 3
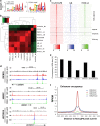
NANOG co-occupies the AR and FOXA1 sites in LNCaP cell genome. (a) MEME motif analysis identifies the FOXA1 motif (right) as the most frequently occupied motif by NP8 (the E-value for the occurrence of this motif=1.3e−310) in LNCaP cells. (b) Pearson’s correlation of transcription factor (NANOG, AR, FOXA1 and NKX3.1) chromatin occupancy in LNCaP under AD and AI conditions. CTCF occupancy in LNCaP and NANOG1 occupancy in H1 ESCs are shown for comparison. (c) Signal distribution heatmap analysis of peaks (NANOGP8, FOXA1 and AR) centered on NANOGP8, ±10 kb from the peak, sorted according to NANOG peak intensity and grouped according to classification (three-way common, two-way common and NP8 only) as indicated. (d) Representative ChIP-Seq tracings reveal multiple transcription factor loci co-occupied by NANOG. (e) Bar chart showing the proportion of NANOG-binding sites co-occupied by FOXA1, AR and/or NKX3.1 in the presence of androgen. (f) Distribution of histone marks ±10 kb around NP8 ChIP-Seq peaks occurring in non-promoter occupied regions (peaks excluded from −8 kb to +2 kb relative to a TSS). H3K4me1, H3K4me3 and H3K27me3 data were acquired by ChIP-Seq; H3K4me2 data are from published data (GSM503905). RPKM, reads per kilobase of transcript per million mapped reads.
Figure 4
Figure 4
NANOG co-localizes and interacts with AR and FOXA1. (a) Multispectral confocal immunofluorescence analysis of NANOG (rabbit mAb, green), AR (mouse mAb, red) and FOXA1 (goat pAb, gray) in LNCaP-NP8 cells (the lower right panel being the four-color merge). Cells were counterstained by 4,6-diamidino-2-phenylindole (blue). Arrows indicate NP8- or AR-expressing cells, whereas the arrowhead marks a NP8/AR co-expressing cell. Shown below are semi-quantitative spectral peaks of four cells (left) circumscribed on the right image in white dashed line. (b) CentriMo analysis of the positional distribution of FOXA family motifs (motif 1, FOXA1 and FOXA2) ±500 bp of the pinnacle. (c) CentriMo analysis of the positional distribution of AR family motifs (AR full motif MA0007.1 and AR half motifs ARE_A and ARE_B) ±500 bp of the pinnacle. (d, e) NANOG interacts with both AR and FOXA1 in LNCaP cells. Whole-cell lysate from the indicated cell types (that is, LNCaP-pLVX control and LNCaP-overexpressing NANOG1 or NP8) were used in immunoprecipitation (IP) with either anti-AR rabbit pAb followed by western blot (WB) with anti-AR mouse mAb, anti-FOXA1 goat pAb and anti-NANOG mouse mAb (d) or IP with anti-FOXA1 goat pAb followed by WB with anti-FOXA1 rabbit pAb, anti-AR mouse mAb and anti-NANOG rabbit mAb (e). N-tera EC cell lysate was used as a positive control for NANOG (42 kDa; lane 1). (f) Recombinant NP8 interacts with both AR and FOXA1 in cell-free systems. GST pull-down assays were performed as described in Supplementary Methods and bound proteins were separated by SDS–polyacrylamide gel electrophoresis (SDS/PAGE) and used in WB with an anti-NANOG antibody (Cell Signaling). Shown below is a Coomassie blue-stained gel image. The rhNANOG proteins were detected as 48, 42 and 35 kDa species [14]. (g) NP8 binds the FOXA1 consensus DNA motif. EMSA was performed using biotinylated FOXA1 motif in the UBE2C gene promoter as the probe (lane 1). Upon incubating the indicated recombinant proteins (lanes 2–8) or GST alone (lane 9) with the probe, interacting proteins were separated by SDS–PAGE and detected using streptavidin horseradish peroxidase. Note that cold unlabeled probes significantly reduced binding of FOXA1 (lane 3) or NP8 (lane 5) to the biotinylated probe. The arrowheads (right) indicate the increasing amounts of FOXA1 and decreasing amounts of NANOG with increasing ratio of FOXA1 over NP8 (lanes 6–8).
Figure 5
Figure 5
NANOG induces distinct gene expression changes correlated with castration resistance and patient survival. (a) Schematic showing RNA-Seq analysis of LNCaP cells overexpressing NANOG in either androgen-dependent (AD) or in androgen-independent (AI) conditions for the indicated time. (b) Unsupervised hierarchical clustering and heatmap presentation of all DEGs from the indicated groups (up/down >1.5× and P<0.05 relative to the pLVX control) in at least one group. Shown on the right are six clusters of genes that showed distinct patterns (Supplementary Figure S5). (c) IPA Upstream Regulator analysis implicated AR as a key NANOG target gene repressed under AD d5 (activation Z-score=−2.9), manifested by the downregulation of multiple AR target genes. (d) GSEA of cluster 1 genes in multiple data sets link them as AR-regulated pro-differentiation genes. (e) Integrative analysis of NP8 genomic occupancy (ChIP-Seq) and NANOG-induced DEG clusters. The analysis was performed by Fisher’s exact test to determine the enrichment of DEGs co-occupied by NP8 with AR and/or FOXA1 within a ±50 kb window of each peak. (f, g) GSEA of cluster 4 (f) and cluster 5 (g) genes in the data sets indicated implicate their involvement in castration resistance. (h) Heatmap presentation of the 127 genes in cluster 5 involved in DNA replication, cell cycle regulation and cytokinesis. (i, j) Survival analysis links cluster 5 genes to poor patient survival. A 58-gene signature from cluster 5 genes was used to stratify PCa patient survival in the Setlur data set (Supplementary Method), in which patients with higher expression of the signature had significantly shorter overall survival (that is, high risk of dying) than those with lower expression of the signature (i). The same signature also predicts for poor patient survival in a testing data set (j). In cluster 5, higher expression corresponds to higher risk.
Figure 6
Figure 6
NANOG upregulates cell motility genes and engages oncogenic MYC. (ac) GSEA showing that NP8 upregulated genes at AD d5 (a, top) or AI d7 and d22 (b) were all enriched in LAPC9 AI tumors. In contrast, NP8 downregulated genes at AD d5 were enriched in LAPC9 AD tumors (a, bottom). Reciprocally, the LNCaP AI-Up genes were enriched in the NP8 AI d22 cells, whereas LNCaP AD-Up genes were enriched in the control (pLVX) AI d22 cells (c). (d) IPA Biological Processes analysis of NANOG-induced DEGs (both up/down >1.5× and P<0.05) under indicated five conditions. Presented are the major ‘Cellular & Molecular Functions’ enriched in each condition. (e) IPA Canonical Pathway analysis of DEGs (both up/down >1.5× and P<0.05) under AD d5 in response to NP8 overexpression. (f) Heatmap of the 53 migration-related genes (from Supplementary Figure S7G; presented here alphabetically) persistently induced by NANOG expression. (g) IPA Canonical Pathway analysis of DEGs (both up/down >1.5× and P<0.05) in AI d22 cells. (h, i) GSEA showing the MYC oncogenic signature (h) and MYC target genes (i) are enriched in both NP8 AD and AI LNCaP cells.
Figure 7
Figure 7
Biological integration of NANOG-reprogrammed PCa cell resistance to androgen deprivation. (a) WB analysis of two AR-regulated differentiation proteins (PSA and NKX3.1) in LNCaP cells expressing NANOG1 (N1) or NANOGP8 (NP8) under regular culture (AD) conditions. (b, c) ChIP–qPCR analysis of NANOG binding to the promoter (Prom) and/or enhancers (Enh) of the indicated genes (see Supplementary Figure S8A for locations of the loci) in Dox-induced LNCaP cells under AD (b) and AI (c) conditions. ChIP was performed with R&D anti-NANOG goat pAb. (d) Functional analysis of NANOG target genes by siRNA-mediated knockdown. NP8-expressing and control (pLVX) LNCaP cells maintained in charcoal-dextran stripped serum and transfected with the siRNAs (100 nm, 72 h) against UBE2C or MYC (positive control) were used in cell proliferation assays. Presented are % EdU+ cells (mean±s.e.m.; n=3). (e) A model depicting modes of operation (a–d) of NANOG during reprogramming of androgen-dependent PCa cells to the CRPC state.

Similar articles

Cited by

References

    1. Jeter CR, Yang T, Wang J, Chao HP, Tang DG. Concise review: NANOG in cancer stem cells and tumor development: an update and outstanding questions. Stem Cells 2015; 33: 2381–2390. - PMC - PubMed
    1. Wang ML, Chiou SH, Wu CW. Targeting cancer stem cells: emerging role of Nanog transcription factor. Onco Targets Ther 2013; 6: 1207–1220. - PMC - PubMed
    1. Jeter CR, Badeaux M, Choy G et al. Functional evidence that the self-renewal gene NANOG regulates human tumor development. Stem Cells 2009; 27: 993–1005. - PMC - PubMed
    1. Zhang J, Wang X, Li M et al. NANOGP8 is a retrogene expressed in cancers. FEBS J 2006; 273: 1723–1730. - PubMed
    1. Zbinden M, Duquet A, Lorente-Trigos A, Ngwabyt SN, Borges I, Ruiz i Altaba A. NANOG regulates glioma stem cells and is essential in vivo acting in a cross-functional network with GLI1 and p53. EMBO J 2010; 29: 2659–2674. - PMC - PubMed