. 2016 Sep 6;7(10):3882-3898.
doi: 10.1364/BOE.7.003882. eCollection 2016 Oct 1.

Mental stress assessment using simultaneous measurement of EEG and fNIRS

Affiliations

Mental stress assessment using simultaneous measurement of EEG and fNIRS

Fares Al-Shargie et al. Biomed Opt Express. .

Abstract

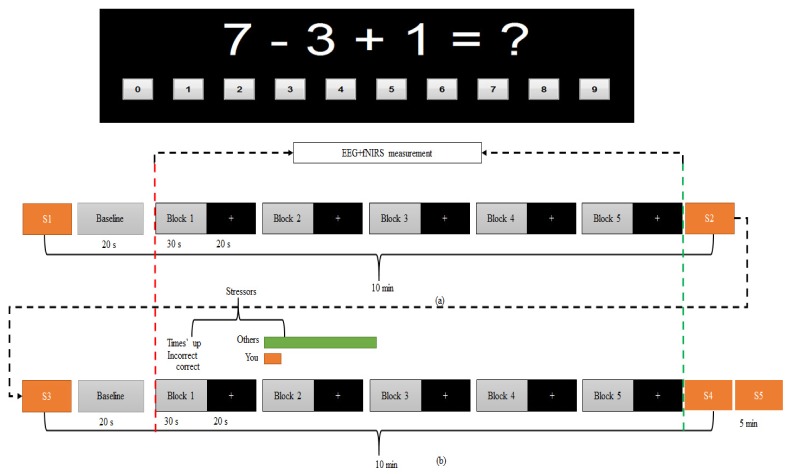
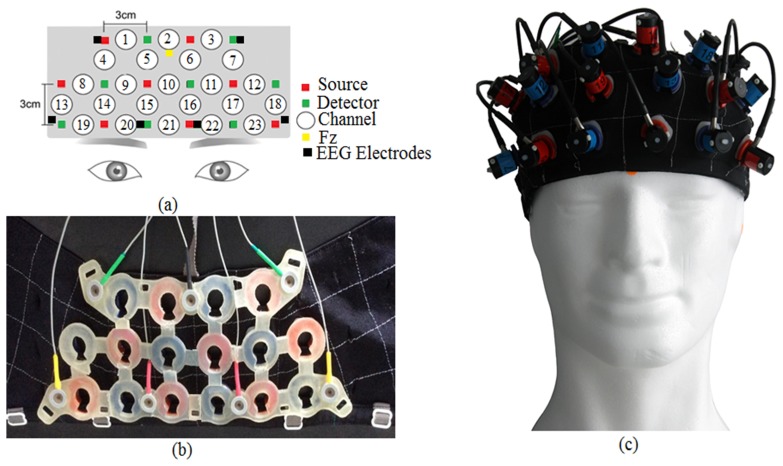
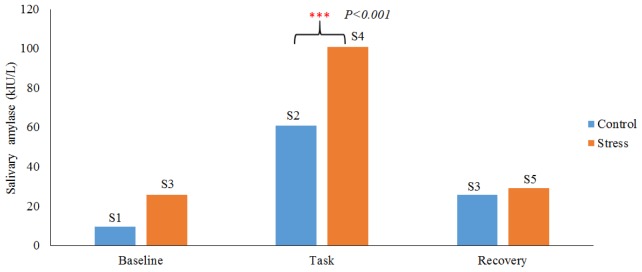
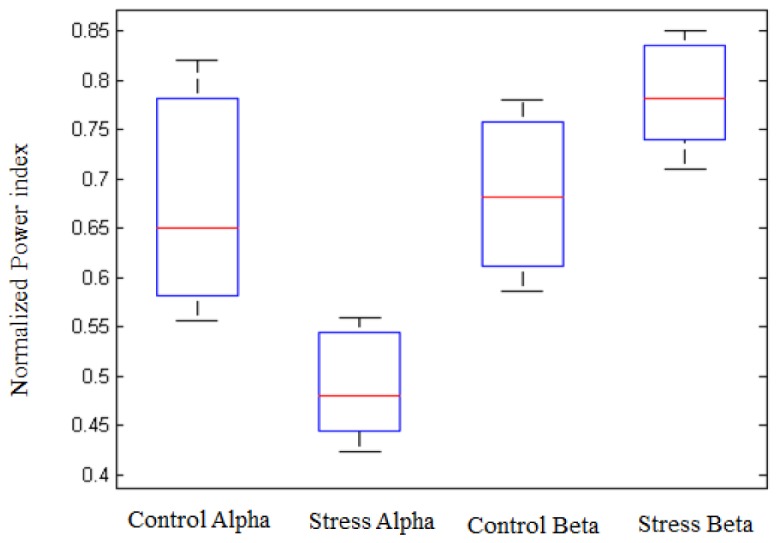
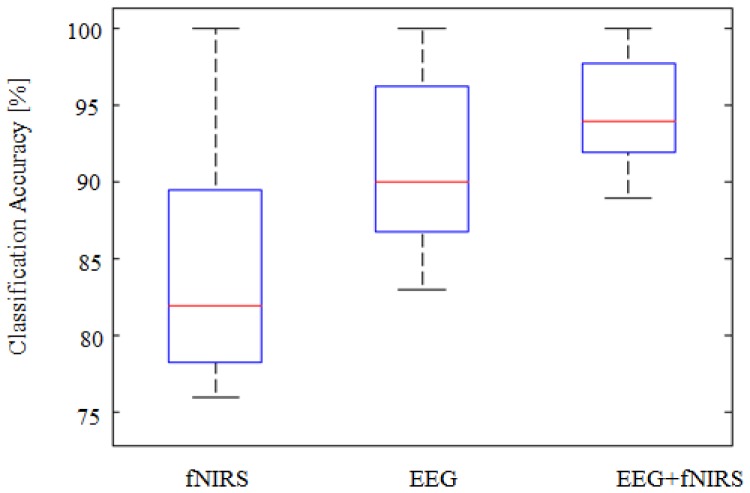
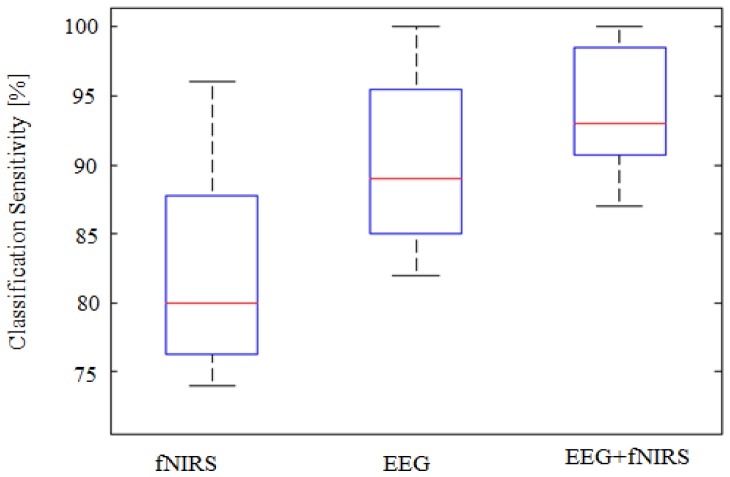
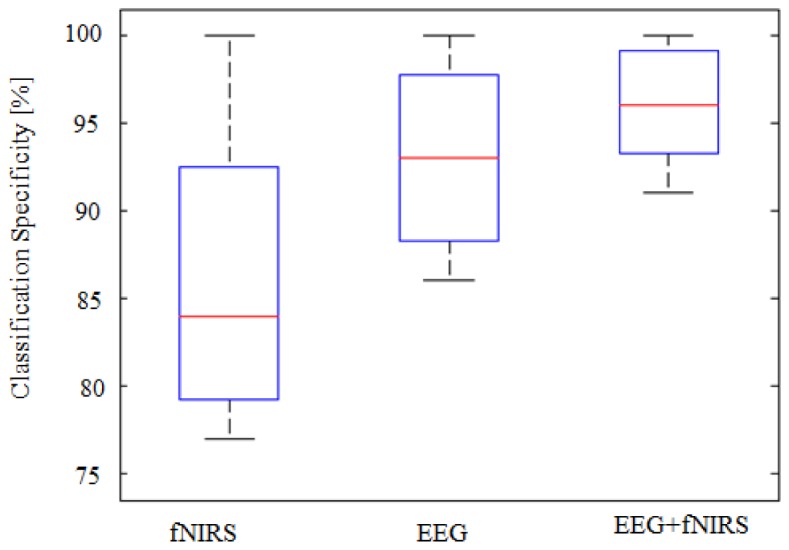
Previous studies reported mental stress as one of the major contributing factors leading to various diseases such as heart attack, depression and stroke. An accurate stress assessment method may thus be of importance to clinical intervention and disease prevention. We propose a joint independent component analysis (jICA) based approach to fuse simultaneous measurement of electroencephalography (EEG) and functional near-infrared spectroscopy (fNIRS) on the prefrontal cortex (PFC) as a means of stress assessment. For the purpose of this study, stress was induced by using an established mental arithmetic task under time pressure with negative feedback. The induction of mental stress was confirmed by salivary alpha amylase test. Experiment results showed that the proposed fusion of EEG and fNIRS measurements improves the classification accuracy of mental stress by +3.4% compared to EEG alone and +11% compared to fNIRS alone. Similar improvements were also observed in sensitivity and specificity of proposed approach over unimodal EEG/fNIRS. Our study suggests that combination of EEG (frontal alpha rhythm) and fNIRS (concentration change of oxygenated hemoglobin) could be a potential means to assess mental stress objectively.

Keywords: (110.2960) Image analysis; (170.1610) Clinical applications; (350.2660) Fusion.


Figures

Fig. 1
Fig. 1
Experiment block design. A total of five active blocks existed for each of the (a) control and (b) stress condition. In each block, arithmetic tasks produced for thirty second followed by twenty second rest. During the 30 s task, several arithmetic questions would be posted depend on how fast the respond of the participant in answering each question. If the respond rate is 2 s per question, the total number of questions per block would be 15 questions and the total number of questions would be 75 questions, for example. During the 20 s rest, the computer screen would display with a fixation cross with black background and participants were instructed to look at the fixation cross as a visual cue for trial onset. The red dashed-line marks the start of the task and the green dashed-line marks the end of the task (the marker was presented in every block). The stressors were based on time pressure and negative feedback of individual performance as demonstrated in (b). Five samples (S1-S5) of alpha amylase were collected; 5-minutes before the control condition as baseline for control, immediately after control condition, 5-minutes before stress condition, immediately after stress condition and 5-minutes after stress condition as marked in the figure with yellow rectangular.
Fig. 2
Fig. 2
EEG + fNIRS probe holder, (a) fNIRS channels and electrodes marking in the probe holder, (b) inner-view of the probe holder, (c) outer-view of the probe holder. The holder consisted of eight sources/emission probes and eight detection probes. Total of twenty three channels and seven active EEG electrodes involved in the probe holder.
Fig. 3
Fig. 3
Salivary alpha amylase responses under control and stress condition. Blue color shows the salivary alpha amylase response under control condition at three measurement instances (5 min before (baseline), at the end of control condition (Task), 5 min after the task (recovery). Red colour shows the salivary alpha amylase response under stress condition with three measurement times (5 min before (baseline), at the end of stress condition (Task), 5 min after the stress task (recovery).The marks “***” indicate that, the task is significant with p<0.001.
Fig. 4
Fig. 4
Normalized Alpha and Beta rhythm power values in two mental state: control and stress for average of 22-subjects. The Alpha and Beta rhythm power values were calculated from all the measured electrodes on the PFC.
Fig. 5
Fig. 5
Mean time-courses of oxygenated hemoglobin concentration changes, (a) control and stress conditions at Ch14 and (b) control and stress conditions at Ch17. The vertical red dash-line marks the start of the task and the vertical green dash-line marks the end of the task condition.
Fig. 6
Fig. 6
Topographical map of oxygenated hemoglobin activation for average of 22 subjects, (a) under control condition and (b) under stress condition. Red colour indicates higher activation and blue colour indicates less activation. Under stress condition, reduced hemodynamic response around the right PFC region.
Fig. 7
Fig. 7
Boxplots representing the classification accuracy measured by SVM for 22 subjects. The results demonstrate significant improvements in the mean classification accuracy when combining both modalities, p<0.001. High improvement in the classification due to combining both modalities with + 3.4% compared to EEG alone and + 11% compared to fNIRS alone.
Fig. 8
Fig. 8
Boxplots representing the classification sensitivity calculated for 22 subjects. High improvement in the sensitivity occurred when combining both modalities with + 3.8% compared to EEG alone and + 11.8% compared to fNIRS alone, p<0.001.
Fig. 9
Fig. 9
Boxplots representing the classification specificity calculated for 22 subjects. High improvements in the specificity obtained when combining both modalities with + 3.2% compared to EEG alone and + 10.6% compared to fNIRS alone, p<0.001.

References

    1. Decker J., “The Stress Syndrome,” Am. J. Nurs. 65(3), 97–99 (1965). - PubMed
    1. Murphy L. R., “Stress management in work settings: a critical review of the health effects,” Am. J. Health Promot. 11(2), 112–135 (1996).10.4278/0890-1171-11.2.112 - DOI - PubMed
    1. Czéh B., Michaelis T., Watanabe T., Frahm J., de Biurrun G., van Kampen M., Bartolomucci A., Fuchs E., “Stress-induced changes in cerebral metabolites, hippocampal volume, and cell proliferation are prevented by antidepressant treatment with tianeptine,” Proc. Natl. Acad. Sci. U.S.A. 98(22), 12796–12801 (2001).10.1073/pnas.211427898 - DOI - PMC - PubMed
    1. Vander Weele C. M., Saenz C., Yao J., Correia S. S., Goosens K. A., “Restoration of hippocampal growth hormone reverses stress-induced hippocampal impairment,” Front. Behav. Neurosci. 7, 66 (2013).10.3389/fnbeh.2013.00066 - DOI - PMC - PubMed
    1. Vyas A., Mitra R., Shankaranarayana Rao B. S., Chattarji S., “Chronic stress induces contrasting patterns of dendritic remodeling in hippocampal and amygdaloid neurons,” J. Neurosci. 22(15), 6810–6818 (2002). - PMC - PubMed

LinkOut - more resources