. 2016 Jun 27;121(12):7079-7087.
doi: 10.1002/2015JD024702. Epub 2016 Jun 18.

Surface dimming by the 2013 Rim Fire simulated by a sectional aerosol model

Affiliations

Surface dimming by the 2013 Rim Fire simulated by a sectional aerosol model

Pengfei Yu et al. J Geophys Res Atmos. .

Abstract

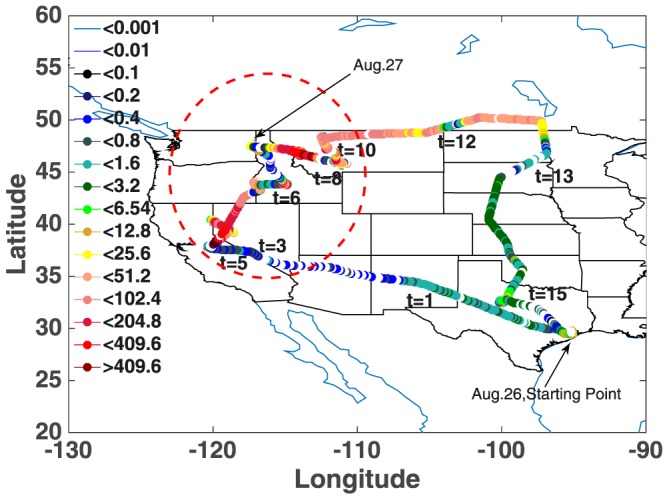
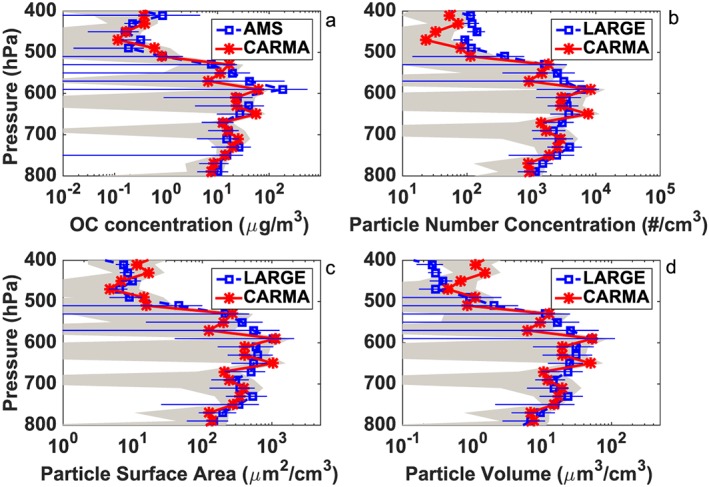
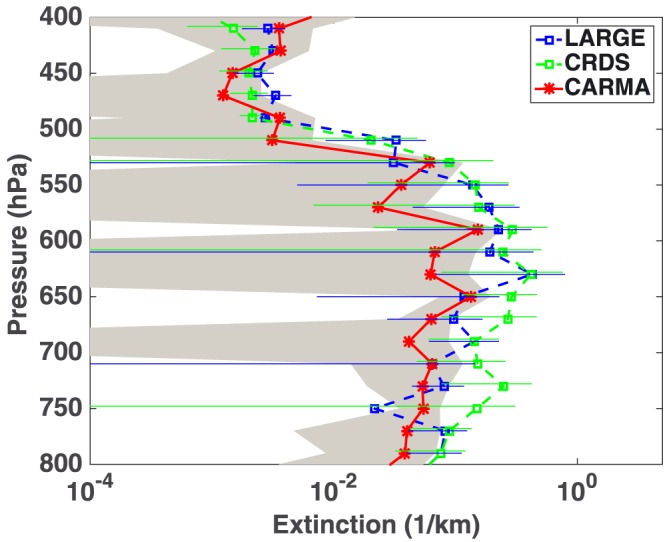
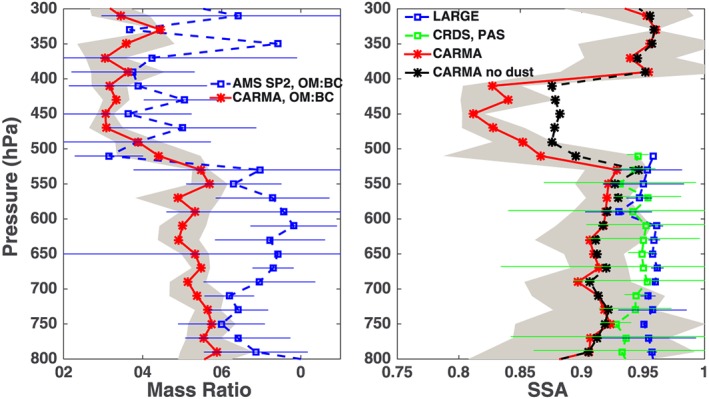
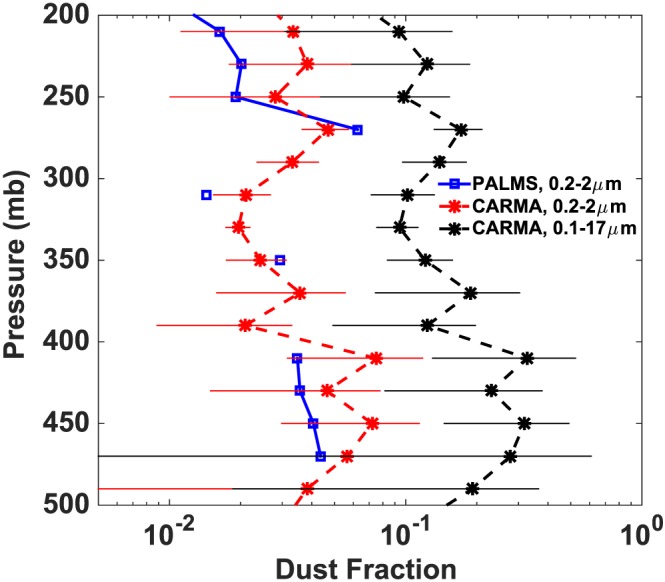
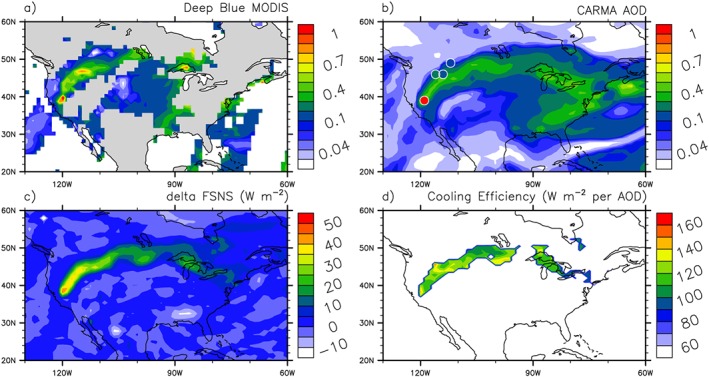
The Rim Fire of 2013, the third largest area burned by fire recorded in California history, is simulated by a climate model coupled with a size-resolved aerosol model. Modeled aerosol mass, number, and particle size distribution are within variability of data obtained from multiple-airborne in situ measurements. Simulations suggest that Rim Fire smoke may block 4-6% of sunlight energy reaching the surface, with a dimming efficiency around 120-150 W m-2 per unit aerosol optical depth in the midvisible at 13:00-15:00 local time. Underestimation of simulated smoke single scattering albedo at midvisible by 0.04 suggests that the model overestimates either the particle size or the absorption due to black carbon. This study shows that exceptional events like the 2013 Rim Fire can be simulated by a climate model with 1° resolution with overall good skill, although that resolution is still not sufficient to resolve the smoke peak near the source region.

Keywords: Rim Fire; radiative forcing; sectional aerosol model.


Figures

Figure 1
Figure 1
Concentration of OA in standard air (unit: µg/std m3) along the flight tracks of the DC‐8 from 26 to 27 August. Study region is marked by red dashed circle. Starting points of flight of 26 and 27 August are denoted by the black text arrows.
Figure 2
Figure 2
(a) OA concentration, (b) particle number density, (c)aerosol surface area density, and (d) aerosol volume density of standard air simulated by CARMA (shown in solid red lines) and observed in SEAC4RS (show in dashed blue lines). The error bars denote variability (1 standard deviation) of observations. The grey shadings denote temporal and spatial variability of the model (1 standard deviation). Data are averaged from California to Montana along the flight track inside the dashed circle in Figure 1.
Figure 3
Figure 3
Extinction coefficients at midvisible wavelength simulated by CARMA (red) and observed by LARGE (blue), CRDS (green). The error bars denote data variability (1 standard deviation) of observations. The grey shading denotes temporal and spatial variability of model (1 standard deviation).
Figure 4
Figure 4
(left) OA to BC mass ratio. CARMA simulations are shown in red, while observations are shown in blue dashed lines. The error bars denote variability (standard deviation) of observations; the grey shading denotes data variability of model. (right) Single scattering albedo (SSA) at midvisible wavelength simulated by CARMA (red) and observed by LARGE (blue). The green lines denote calculated SSA using CRDS for dry extinction coefficient and PAS for dry absorption coefficient. The black dashed lines denote modeled SSA in CARMA without dust aerosols.
Figure 5
Figure 5
Dust mass fraction: the red dashed line denotes simulated in CARMA for aerosol in the size range of 0.2 to 2 µm in diameter; the black dashed line denotes simulated in CARMA for aerosol in the size range of 0.1 to 17 µm in diameter; the blue line denotes observations from PALMS for the size range of 0.2 to 2 µm in diameter.
Figure 6
Figure 6
(a) MODIS deep blue midvisible AOD of 27 August; the grey area denotes no retrieval by MODIS. (b) CARMA simulated midvisible AOD for 20Z–22Z of 27 August. (c) Net solar flux (W m−2 at midvisible) at surface simulated in CARMA for the to Rim Fire smoke simulation minus the control, 20Z–22Z of 27 August. (d) Surface dimming efficiency for rim fire smoke for 20Z–22Z of 27 August: surface dimming per AOD of smoke (W m−2 per unit of midvisible AOD). Observation of midvisible AOD (level 2) by AERONET sites (University of Nevada‐Reno: 39°N, 119°W; Rimrock: 46°N, 116°W; Missoula: 46°N, 114°W; University of Lethbridge: 49°N, 112°W) close to the smoke, are shown in filled cycles. AERONET observations are mostly taken between 20 and 22Z of 27 August. Due to limited observation on 27 August, the AOD data of University of Nevada‐Reno is taken at 23Z of 27 August.
Figure 7
Figure 7
Simulated solar heating rate (K/d) difference between runs with and without Rim Fire smoke along the DC8 flight track from 21Z on 26 August to 22Z on 27 August. Pressure altitudes of DC8 are shown in black lines.

References

    1. Amann, M. , et al. (2011), Cost effective control of air quality and greenhouse gases in Europe: Modeling and policy applications, Environ. Modell. Software, 26, 1489–1501.
    1. Chen, G. , et al. (2011), Observations of Saharan dust microphysical and optical properties from the Eastern Atlantic during NAMMA airborne field campaign, Atmos. Chem. Phys., 11, 723–740, doi:10.5194/acp-11-723-2011. - DOI
    1. Cubison, M. J. , et al. (2011), Effects of aging on organic aerosol from open biomass burning smoke in aircraft and laboratory studies, Atmos. Chem. Phys., 11, 12,049–12,064, doi:10.5194/acp-11-12049-2011. - DOI
    1. Darmenov, A. , and da Silva A. M. (2014), The Quick Fire Emissions Dataset (QFED) Documentation of versions 2.1, 2.2 and 2.4, NASA TM‐2013‐104606, vol. 35, 183 pp.
    1. Dunlea, E. J. , et al. (2009), Evolution of Asian aerosols during transpacific transport in INTEX‐B, Atmos. Chem. Phys., 9, 7257–7287, doi:10.5194/acp-9-7257-2009. - DOI

LinkOut - more resources