

doi: 10.1038/ncomms13528.
A radial map of multi-whisker correlation selectivity in the rat barrel cortex
Affiliations
- PMID: 27869114
- PMCID: PMC5121329
- DOI: 10.1038/ncomms13528
Item in Clipboard
A radial map of multi-whisker correlation selectivity in the rat barrel cortex
Nat Commun.
.
Abstract
In the barrel cortex, several features of single-whisker stimuli are organized in functional maps. The barrel cortex also encodes spatio-temporal correlation patterns of multi-whisker inputs, but so far the cortical mapping of neurons tuned to such input statistics is unknown. Here we report that layer 2/3 of the rat barrel cortex contains an additional functional map based on neuronal tuning to correlated versus uncorrelated multi-whisker stimuli: neuron responses to uncorrelated multi-whisker stimulation are strongest above barrel centres, whereas neuron responses to correlated and anti-correlated multi-whisker stimulation peak above the barrel-septal borders, forming rings of multi-whisker synchrony-preferring cells.
Figures
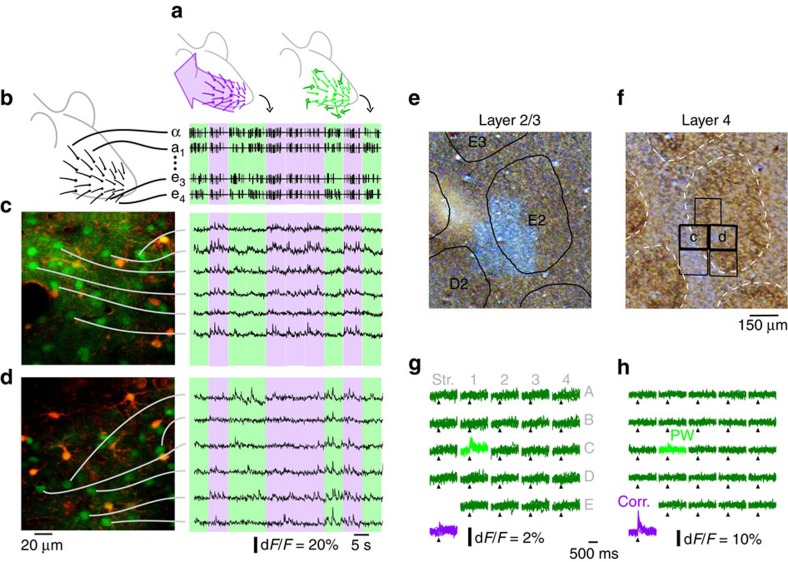
(a) Cartoon representation of correlated (purple) and uncorrelated (green) multi-whisker stimulations. (b) Representative example of multi-whisker stimuli. Purple/green backgrounds: correlated/uncorrelated stimuli. (c) Left: example two-photon microscope field of view located above the barrel border. Green: neurons. Red: astrocytes. Right: fluorescence trace of selected neurons. (d) Same as c for a field of view located inside the area above barrel. (e) Histological identification in cytochrome oxidase-stained tangential slices of the barrel cortex of five fields of view acquired next to each others in layer 2/3. Overlay: position and name of layer 4 barrels. (f) Corresponding layer 4 slice (barrels inside dashed lines highlight). Overlay: position of the fields of view, including fields displayed in c and d. (g) Representative examples of stimulus-averaged neuronal responses to whisker deflections during uncorrelated stimulations (green, whisker labelled; light green, corresponding anatomical PW) and during correlated deflections (purple). The responses to the different stimulus phase/direction are overlapped. Note the preference for uncorrelated over correlated stimulations (h) Same as g for a neuron that only responds to correlated stimulations.
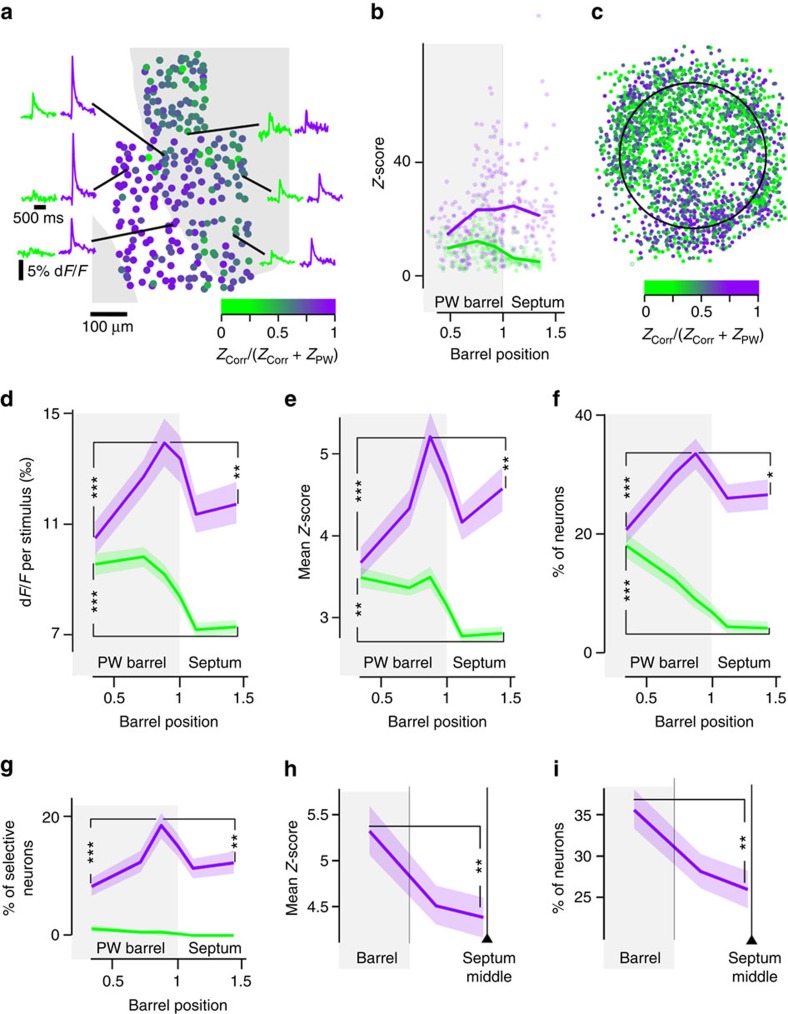
(a) Z-score-derived correlated/uncorrelated stimulation preference index in an individual experiment. Marginal curves: example stimulus-triggered average calcium transients. Grey background: layer 4 barrel. White: septum. (b) Projection of Z-scores from a in normalized barrel radius coordinates. Lines: local Z-score median. (c) Projection in a normalized barrel of all recorded neurons. Colour code: Z-score-derived correlated/uncorrelated stimulation preference index. (d) Radial profile (364 neurons per bin) of mean correlated/uncorrelated stimulation-evoked dF/F, for all recorded neurons. Light background: bootstrap-derived 70% confidence interval. ***Mann–Whitney P=5.3E-4 for uncorrelated and 2.1E-6 for correlated stimulation-evoked responses. **P=2.0E-3. (e) Same as d for Z-scores. **Mann–Whitney P=2.1E-3 for uncorrelated and 3.6E-3 for correlated stimulation-evoked responses. ***Mann–Whitney P=5.0E-7. (f) Normalized radial profile (364 neurons per bin) of the proportion of neurons preferring correlated (purple) or uncorrelated (green) stimulations, among all responsive neurons. ***Fisher exact P=3.5E-9 for correlated and 1.9E-4 for uncorrelated stimulation-preferring neurons. **P=3.3E-2. (g) Same as f for significant tuning to correlated versus uncorrelated stimulations. ***Fisher exact P=6.1E-5. **P=8.2E-3 (364 neurons per bin). (h) Correlated stimulation-evoked mean Z-scores for all neurons, in normalized septal coordinate (444 neurons per bin). From left to right, equal neuron count bins contain neurons from area above barrel edge, septum edge and septum centre. **Mann–Whitney P=2.8E-3. (i) Same as h for the proportion of responsive correlation-preferring neurons over all cells. **Fisher exact P=2.2E-3 (444 neurons per bin).
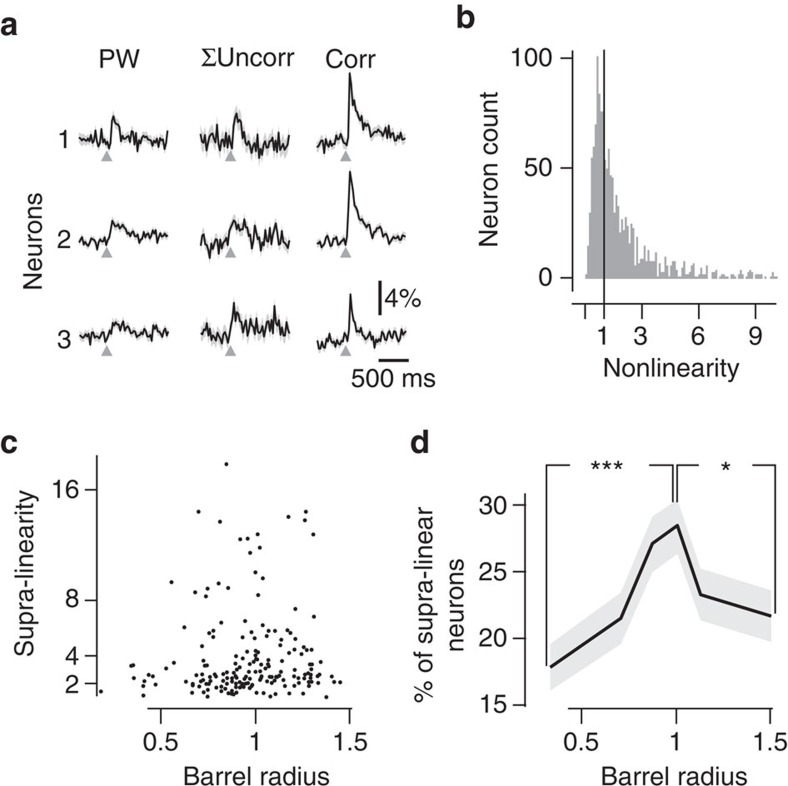
(a) Three examples of neurons' functional responses to PW stimulation (left), sum of the response to PW and two closest adjacent whiskers (middle), and to correlated stimulation (right). (b) Distribution of the NL index. Sixty-eight per cent of neurons are supra-linear. (c) Radial distribution of NL for significantly supra-linear neurons (that is, bootstrap-derived response P<0.05). (d) The radial distribution (517 neurons per bin) of the proportion of supra-linear neurons (NL>1), among all responsive neurons, shows a significant peak. *Mann–Whitney P=1.4E-2. ***P=9.0E-5.
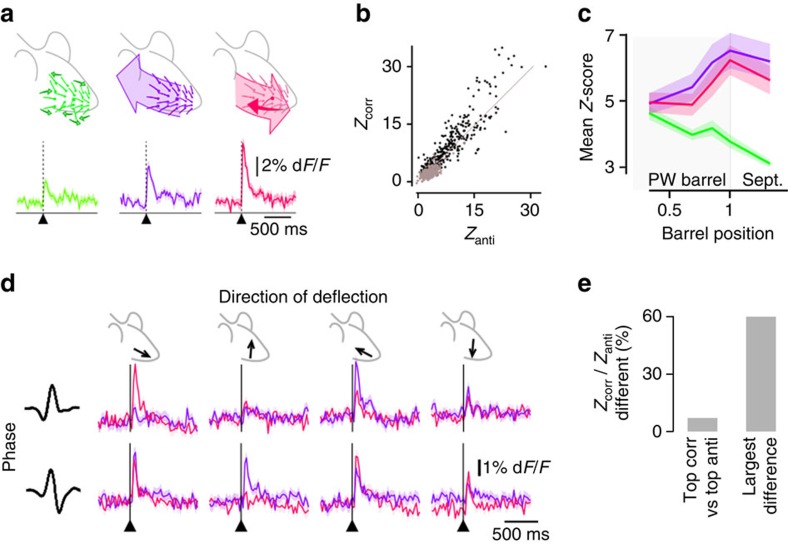
(a) Top: cartoon representation of uncorrelated (green), correlated (purple) and anti-correlated (pink) multi-whisker stimulations. Bottom: representative example of the average calcium transients triggered by each stimulation for a neuron preferring anti-correlated stimulations. Light background: bootstrap-derived 70% confidence interval of the calcium transient estimate. (b) Scatter plot of the Z-score of all neurons in response to correlated PW stimulation (Zcorr) versus anti-correlated stimulations (Zanti). Grey: neurons preferring uncorrelated over correlated stimulations. (c) Mean uncorrelated (green), correlated (purple) and anti-correlated (pink) Z-score radial distribution. Through barrel radius, correlated Z-scores are not significantly different from anti-correlated Z-scores. Light background: bootstrap-derived 70% confidence interval of the mean Z-score estimate. (d) Responses of a representative neuron to anti-correlated (pink) stimuli across two phases and four directions (rostral, caudal, dorsal and ventral) of stimulation. Same for correlated stimuli, in purple. (e) Proportion of responsive cells showing a significant difference between responses to correlated (corr) and anti-correlated stimuli, on their largest response (all phases and directions confounded, left), or at least in one condition of phase and direction out of eight (right). Sept., septum.
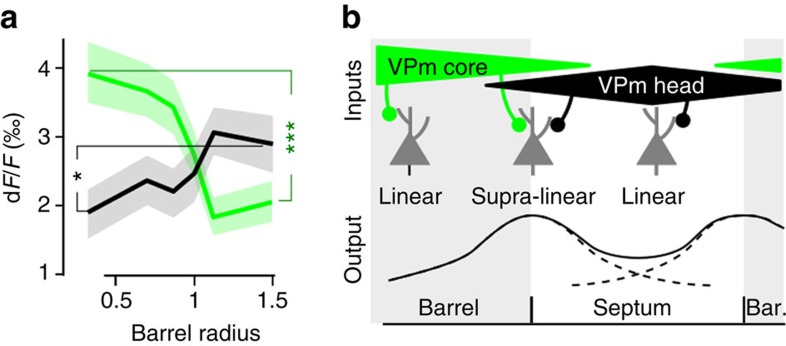
(a) Radial distribution of mean dF/F response to the PW (green) and to the sum of the two closest adjacent whiskers (black). ***Mann-Whitney P=8.1 × 10⁻⁴ for PW and *P=0.024 for adjacent whiskers. (b) A simple model of the projections to the barrel and septal compartments. A supra-linear integration of VPm-head and VPm-core inputs during correlated stimulation may occur in neurons above the barrel-septa border that receive both inputs, while neurons above barrel centre and septum centre mainly receive a single source of input and are therefore not subjected to the same mechanism. Bar., barrel.
Similar articles
-
Imprecise Whisker Map in the Neonatal Rat Barrel Cortex.Cereb Cortex. 2015 Oct;25(10):3458-67. doi: 10.1093/cercor/bhu169. Epub 2014 Aug 6. Cereb Cortex. 2015. PMID: 25100857
-
Stimulus-specific and stimulus-nonspecific firing synchrony and its modulation by sensory adaptation in the whisker-to-barrel pathway.J Neurophysiol. 2009 May;101(5):2328-38. doi: 10.1152/jn.91151.2008. Epub 2009 Mar 11. J Neurophysiol. 2009. PMID: 19279146 Free PMC article.
-
Representation of tactile scenes in the rodent barrel cortex.Neuroscience. 2018 Jan 1;368:81-94. doi: 10.1016/j.neuroscience.2017.08.039. Epub 2017 Aug 23. Neuroscience. 2018. PMID: 28843997 Review.
-
Response sensitivity of barrel neuron subpopulations to simulated thalamic input.J Neurophysiol. 2010 Jun;103(6):3001-16. doi: 10.1152/jn.01053.2009. Epub 2010 Apr 7. J Neurophysiol. 2010. PMID: 20375248
-
Information processing streams in rodent barrel cortex: the differential functions of barrel and septal circuits.Cereb Cortex. 2008 May;18(5):979-89. doi: 10.1093/cercor/bhm138. Epub 2007 Aug 16. Cereb Cortex. 2008. PMID: 17702950 Review.
Cited by
-
Tuning instability of non-columnar neurons in the salt-and-pepper whisker map in somatosensory cortex.Nat Commun. 2022 Nov 3;13(1):6611. doi: 10.1038/s41467-022-34261-1. Nat Commun. 2022. PMID: 36329010 Free PMC article.
-
Global and local neuronal coding of tactile information in the barrel cortex.Front Neurosci. 2024 Jan 5;17:1291864. doi: 10.3389/fnins.2023.1291864. eCollection 2023. Front Neurosci. 2024. PMID: 38249584 Free PMC article.
-
Cross-Streams Through the Ventral Posteromedial Thalamic Nucleus to Convey Vibrissal Information.Front Neuroanat. 2021 Oct 28;15:724861. doi: 10.3389/fnana.2021.724861. eCollection 2021. Front Neuroanat. 2021. PMID: 34776879 Free PMC article.
-
Sensory coding is impaired in rat absence epilepsy.J Physiol. 2019 Feb;597(3):951-966. doi: 10.1113/JP277297. Epub 2019 Jan 4. J Physiol. 2019. PMID: 30548850 Free PMC article.
-
Organization of orientation-specific whisker deflection responses in layer 2/3 of mouse somatosensory cortex.Neuroscience. 2018 Jan 1;368:46-56. doi: 10.1016/j.neuroscience.2017.07.067. Epub 2017 Aug 4. Neuroscience. 2018. PMID: 28827090 Free PMC article.
References
-
- Fregnac Y. & Bathellier B. Cortical correlates of low-level perception: from neural circuits to percepts. Neuron 88, 110–126 (2015). - PubMed
-
- Ghazanfar A. A. & Nicolelis M. A. Nonlinear processing of tactile information in the thalamocortical loop. J. Neurophysiol. 78, 506–510 (1997). - PubMed
-
- Estebanez L., El Boustani S., Destexhe A. & Shulz D. E. Correlated input reveals coexisting coding schemes in a sensory cortex. Nat. Neurosci. 15, 1691–1699 (2012). - PubMed
-
- Merzenich M. M., Kaas J. H. & Roth G. L. Auditory cortex in the grey squirrel: tonotopic organization and architectonic fields. J. Comp. Neurol. 166, 387–401 (1976). - PubMed
Publication types
MeSH terms
Substances
LinkOut - more resources
Full Text Sources
Other Literature Sources
