. 2016 Nov 21:7:13404.
doi: 10.1038/ncomms13404.

Direct identification of clinically relevant neoepitopes presented on native human melanoma tissue by mass spectrometry

Affiliations

Direct identification of clinically relevant neoepitopes presented on native human melanoma tissue by mass spectrometry

Michal Bassani-Sternberg et al. Nat Commun. .

Abstract

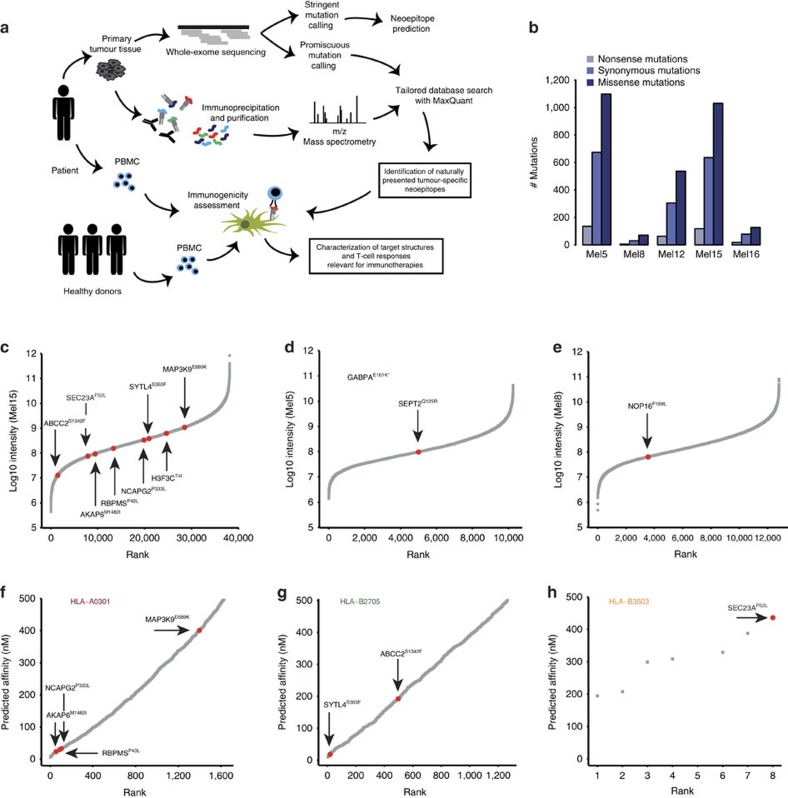
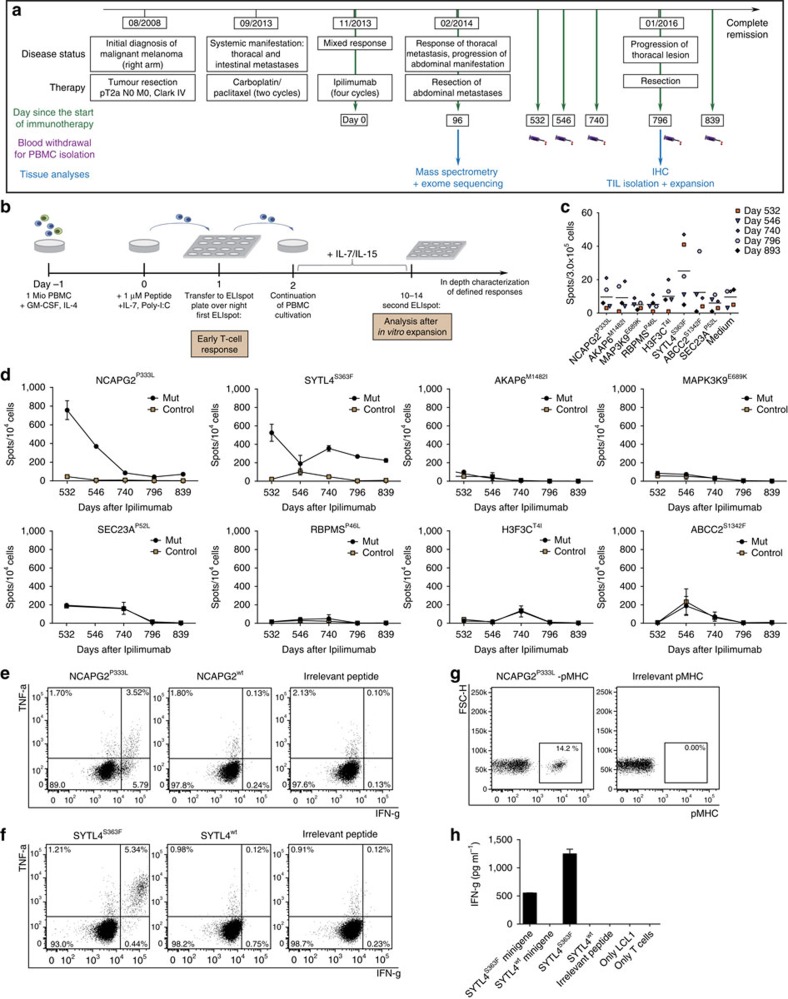
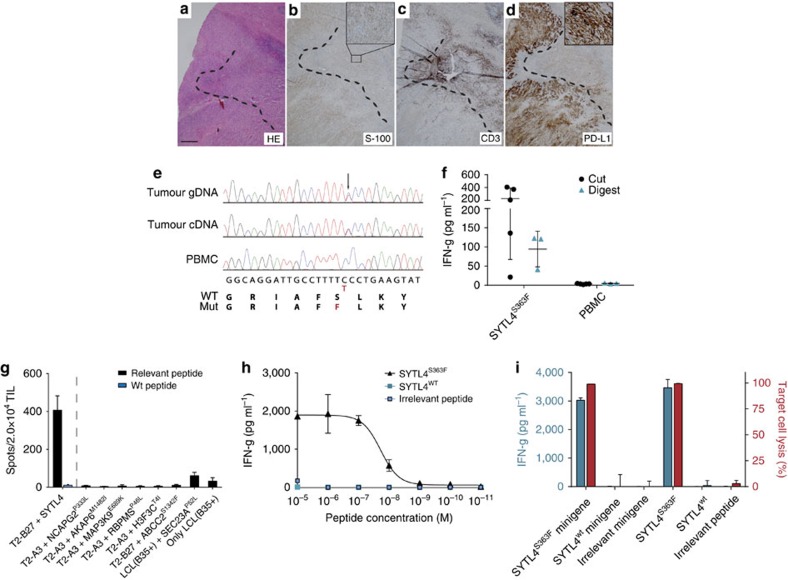
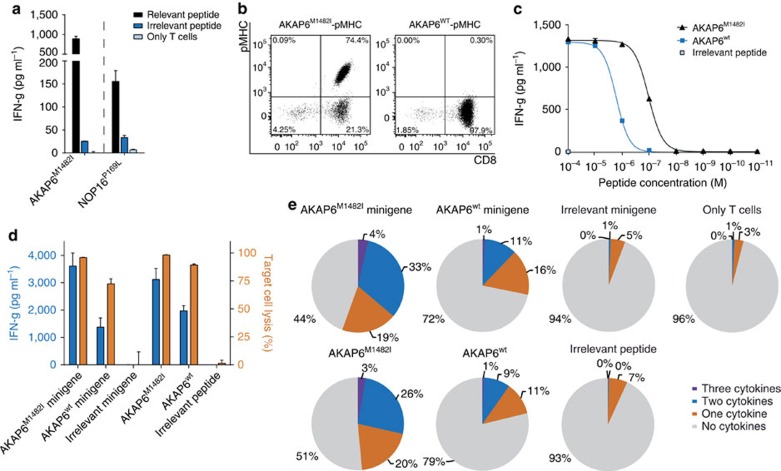
Although mutations may represent attractive targets for immunotherapy, direct identification of mutated peptide ligands isolated from human leucocyte antigens (HLA) on the surface of native tumour tissue has so far not been successful. Using advanced mass spectrometry (MS) analysis, we survey the melanoma-associated immunopeptidome to a depth of 95,500 patient-presented peptides. We thereby discover a large spectrum of attractive target antigen candidates including cancer testis antigens and phosphopeptides. Most importantly, we identify peptide ligands presented on native tumour tissue samples harbouring somatic mutations. Four of eleven mutated ligands prove to be immunogenic by neoantigen-specific T-cell responses. Moreover, tumour-reactive T cells with specificity for selected neoantigens identified by MS are detected in the patient's tumour and peripheral blood. We conclude that direct identification of mutated peptide ligands from primary tumour material by MS is possible and yields true neoepitopes with high relevance for immunotherapeutic strategies in cancer.


Figures

Figure 1
Figure 1. In depth analysis of the melanoma-associated ligandome.
Number of epitopes identified per patient. Asterisk marks samples for which no HLA-II peptidomics have been performed (a). Typical length distribution of eluted HLA-I and HLA-II peptides in Mel15 and Mel16. HLA-I peptides clustered to reveal the main binding motifs that fit the patients' HLA type (Supplementary Table 2) (b,c). Predicted affinity of eluted 9-mer peptides from Mel15 and Mel16 using NetMHC (d,e) using the threshold of top 2% ranked predicted sequences. The grey line represents the 500 nM threshold of binding affinity.
Figure 2
Figure 2. Presentation of common tumour-associated antigens.
Heat map presentation of the number of epitopes per patients that derived from a panel of 24 melanoma antigens (a). Alignment of the 99 epitopes from PMEL reveals hot spots presented by several patients in common (b). Expression of PMEL, tyrosinase and PRAME on mRNA and protein level is exemplarily compared with the number of HLA ligands for patients Mel15 and Mel16 normalized to the total number of identified HLA ligands. mRNA expression is depicted as log2 relative expression as compared with Mel16. Scale bars of Mel16-PMEL, Mel15-Tyrosinase, Mel15- and Mel16-PRAME: 50 μm; scale bars of Mel15-PMEL, Mel16-Tyrosinase: 100 μm (c). The number of PMEL-derived HLA class I or II ligands identified by immunopeptidomics was normalized to the total number of identified HLA ligands in the respective patient sample. Square root transformation was applied to deal with deviations from a normal distribution (c). Normalized HLA ligand numbers of PMEL of 12 patients with > 2000 HLA I ligands are plotted against per cent positive cells per tissue section as determined by IHC (d,e) or against log2 fold mRNA expression relative to a tissue panel consisting of 20 human tissues (f,g). Pearson correlation was calculated and the respective p value was corrected for multiple testing. For visual guidance a regression line is depicted on each panel.
Figure 3
Figure 3. Characterization of phosphorylation on eluted HLA peptides.
Percentage of phospho-HLA peptides commonly detected in two or more patients (a) as well as percentage of known phosphorylation sites deposited on the PhosphoSitePlus database (b). Percentage of defined amino acids affected by phosphorylation within the phosphopeptide ligandome (c). Position of phosphorylation within the eluted phospho-HLA peptides according to the peptide length, from 9 mer to 12 mer peptides (d). Logo plots of residue frequency at each position of phospho-HLA peptides according to their length (e).
Figure 4
Figure 4. Identification of mutated peptide ligands by matching exome sequencing and mass spectrometry immunopeptidomics.
Overview of the experimental approach. Patient tumour tissue was used for MS analysis and exome sequencing. Mutations were called and matched with MS data. Mutated peptide ligands were then further evaluated for recognition by patient's autologous and matched allogeneic T cells (a). Overview of the number of non-synonymous and synonymous mutations per patient (b). Ranked intensity values of MS data derived from the immunopeptidome of the three patients with identified mutated peptide ligands (Mel15, Mel5 and Mel8). Positions of the mutated peptide ligands are projected on the curve (ce). GABPAE161K was detected at the MSMS level only, therefore no intensity is reported (d). Predicted affinity of neoantigen candidates using the 500 nM threshold for binders using NetMHC and ranking of neoepitope candidates for Mel15 with respect to HLA-A0301 (n=1,632), HLA-B2705 (n=1,265) and HLA-B3503 (n=8). The mutated peptide ligands detected by MS are not among the top 10 for HLA-A0301 or – B2705 (fh).
Figure 5
Figure 5. Immune responses against mutated ligands in PBMC of patient Mel15.
Clinical course and retrieval of patient material (a). Schematic overview of the experimental design of recall immune responses among blood-derived T cells from patient Mel15 (b). Early immune responses detected in PBMC derived from different blood withdrawals two days after in-vitro peptide stimulation (c). Time course of specific reactivities of blood-derived PBMC obtained at different time points against the eight identified mutated epitopes from patient Mel15. All analyses were performed in duplicates and spot counts were adjusted to 104 cells (d). Intracellular cytokine staining (ICS) of an expanded NCAPG2P333L specific T-cell line from day 546 (PBMC-NCAPG2-546) after co-incubation with peptide pulsed T2-A3 target cells for 5 h (e). ICS of T-cell line PBMC-SYTL4-740 stimulated with SYTL4S363F from day 740 after co-culture with peptide pulsed T2-B27 target cells (f). Staining of line PBMC-NCAPG2-546 with the specific multimer in comparison to irrelevant multimer staining (g) IFN-g secretion after coincubation of T-cell clone PBMC-SYTL4clone1 derived from line PBMC-SYTL4-740 with peptide pulsed and minigene-transduced LCL1 (results of triplicates) (h). Data from experiments with triplicates are shown as mean±s.d., data resulting from duplicates are shown as mean.
Figure 6
Figure 6. In-depth characterization of tumour and peptide-reactivity of SYTL4-specific T cells derived from PBMC as well as TILs.
HE (a) staining of a lung metastasis after metastasectomy (01/2016, day 796) as well as immunohistochemistry stainings with anti-S100 (b), anti-CD3 (c) and anti-PD-L1 (d); (b,d) Inset: × 20 magnification. Scale bar, 500 μm. Sanger sequencing of the mutated region from SYTL4 in processed tumour material from day 796 using either isolated genomic DNA (gDNA) or coding DNA (cDNA) as template (e). IFN-g secretion of T-cell line PBMC-SYTL4-740 on co-culture with cut (5 wells) or digested (3 wells) fresh tumour material for 36 h (f). Non-stimulated PBMC from Mel15 served as controls. Horizontal lines and error bars show mean and s.d., respectively. Co-incubation of in-vitro expanded TIL with target cells pulsed with mutated peptide ligands (g). SYTL4wt served as negative control, analysis was performed using triplicates and depicted as mean±s.d. Reactivity of the TIL-derived T-cell clone TIL-SYTL4clone1 against T2-B27 target cells pulsed with titrated concentrations of mutated, wt or irrelevant peptide (h). Co-culture of TIL-SYTL4clone1 with LCL1 either peptide pulsed or transduced with mutated or wt minigenes (i) with results shown as mean of duplicates. Amount of IFN-g secretion was assessed in supernatants (left Y-axis) and amount of target cell lysis was analysed by FACS-based acquisition of total number of vital target cells in relation to untreated LCL (right Y-axis); coincubation was performed in triplicates and results are shown as mean and s.d.
Figure 7
Figure 7. Characterization of mutant-specific T-cell responses in HLA-matched healthy donors.
T-cell responses of two different matched healthy donors against neoepitopes AKAP6M1482I and NOP16P169L. Effector cells were coincubated in duplicates with T2-A3 or T2-B7 pulsed either with the relevant peptide or control peptides with the same HLA restriction as the mutated ligands, results are shown as mean (a). Staining of T-cell line HD1-AKAP6 with the mutated or wt multimer (b). IFN-g release of the T-cell line on peptide titration of AKAP6M1482I and its non-mutated counterpart using T2-A3 as targets (duplicates are depicted as mean) (c). IFN-g secretion (left Y-axis) and target-cell lysis (right Y-axis) after coincubation of the T-cell line HD1-AKAP6 with peptide-pulsed and minigene-transduced LCL1 cells performed in triplicates, data shown as mean±s.d. (d). Intracellular cytokine staining (IFN-g, TNF-a and IL-2) on co-culture of the T-cell line HD1-AKAP6 with LCL1 cells, either peptide-pulsed or minigene-transduced, determined by flow cytometry. Cells were gated on ethidium monoazide bromide-negative and CD8-positive events (e).

References

    1. Page D. B., Postow M. A., Callahan M. K., Allison J. P. & Wolchok J. D. Immune modulation in cancer with antibodies. Ann. Rev. Med. 65, 185–202 (2014). - PubMed
    1. Weber J. S. et al. Nivolumab versus chemotherapy in patients with advanced melanoma who progressed after anti-CTLA-4 treatment (CheckMate 037): a randomised, controlled, open-label, phase 3 trial. Lancet Oncol. 16, 375–384 (2015). - PubMed
    1. van Baren N. et al. Tumoral and immunologic response after vaccination of melanoma patients with an ALVAC virus encoding MAGE antigens recognized by T cells. J. Clin. Oncol.: Off. J. Am. Soc. Clin. Oncol. 23, 9008–9021 (2005). - PubMed
    1. Schwartzentruber D. J. et al. gp100 peptide vaccine and interleukin-2 in patients with advanced melanoma. N. Engl. J. Med. 364, 2119–2127 (2011). - PMC - PubMed
    1. Robbins P. F. et al. Tumor regression in patients with metastatic synovial cell sarcoma and melanoma using genetically engineered lymphocytes reactive with NY-ESO-1. J. Clin. Oncol.: Off. J. Am. Soc. Clin. Oncol. 29, 917–924 (2011). - PMC - PubMed