. 2017 Jan;23(1):49-59.
doi: 10.1038/nm.4233. Epub 2016 Nov 21.

Engineered human pluripotent-stem-cell-derived intestinal tissues with a functional enteric nervous system

Affiliations

Engineered human pluripotent-stem-cell-derived intestinal tissues with a functional enteric nervous system

Michael J Workman et al. Nat Med. 2017 Jan.

Abstract

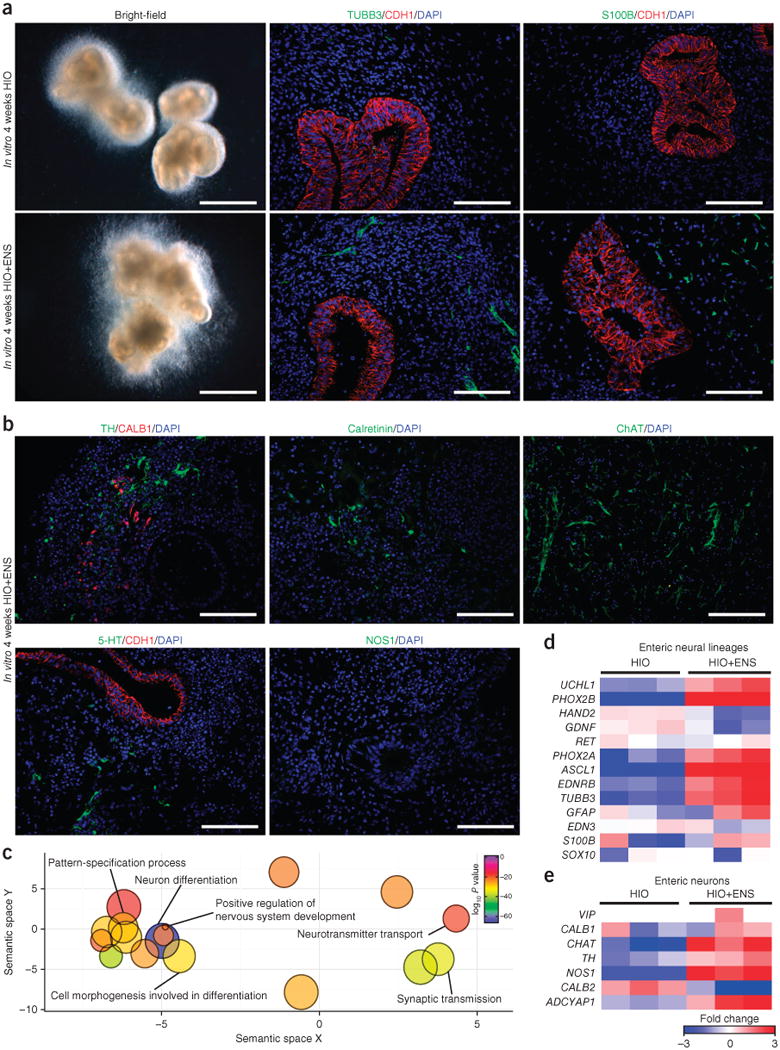
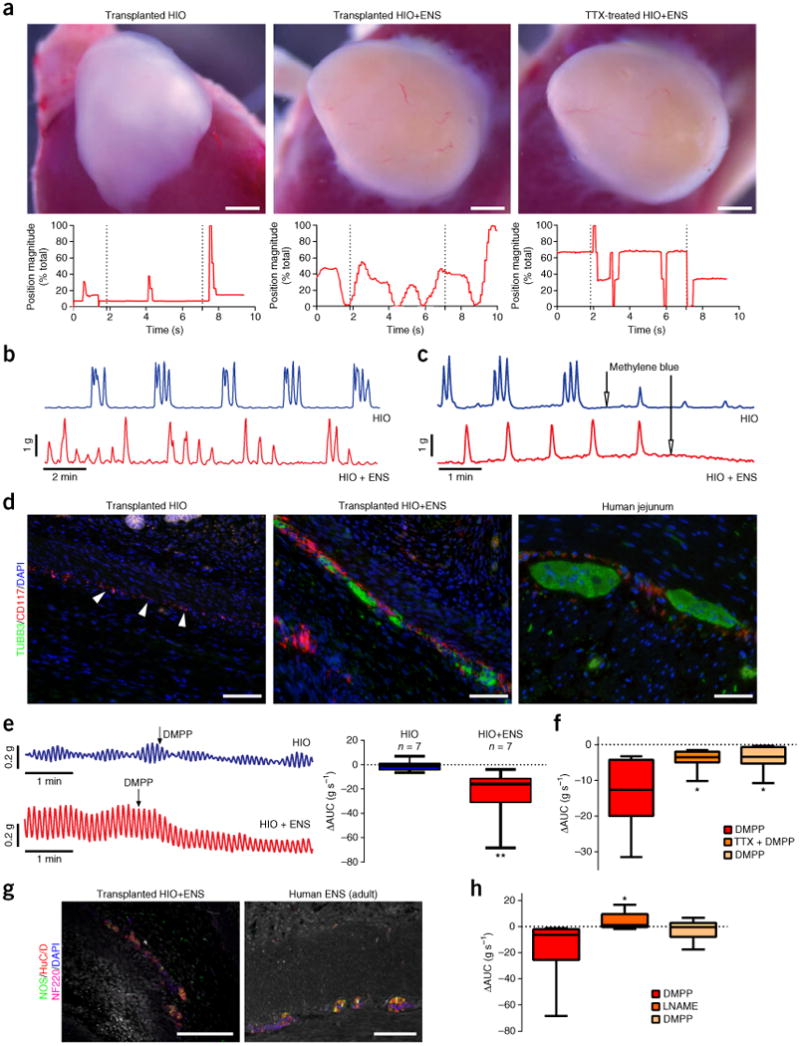
The enteric nervous system (ENS) of the gastrointestinal tract controls many diverse functions, including motility and epithelial permeability. Perturbations in ENS development or function are common, yet there is no human model for studying ENS-intestinal biology and disease. We used a tissue-engineering approach with embryonic and induced pluripotent stem cells (PSCs) to generate human intestinal tissue containing a functional ENS. We recapitulated normal intestinal ENS development by combining human-PSC-derived neural crest cells (NCCs) and developing human intestinal organoids (HIOs). NCCs recombined with HIOs in vitro migrated into the mesenchyme, differentiated into neurons and glial cells and showed neuronal activity, as measured by rhythmic waves of calcium transients. ENS-containing HIOs grown in vivo formed neuroglial structures similar to a myenteric and submucosal plexus, had functional interstitial cells of Cajal and had an electromechanical coupling that regulated waves of propagating contraction. Finally, we used this system to investigate the cellular and molecular basis for Hirschsprung's disease caused by a mutation in the gene PHOX2B. This is, to the best of our knowledge, the first demonstration of human-PSC-derived intestinal tissue with a functional ENS and how this system can be used to study motility disorders of the human gastrointestinal tract.


Figures

Figure 1
Figure 1
Incorporation of NCCs into developing HIOs in vitro. (a) Immunofluorescence analysis of organoids generated in vitro with (HIO+ENS) and without (HIO) NCC addition. Left, bright-field images. Middle, immunostaining for neurons (TUBB3) and epithelium (CDH1). Right, immunostaining for glial cells (S100β+) and epithelium (CDH1). Scale bars, 1 mm (left) and 100 μm (middle and right). Data are representative of 14 independent experiments combining HIOs with NCCs in vitro. (b) Analysis of different neuronal cell types using neurochemical markers of ENS neurons in HIOs+ENS cultured in vitro. Dopaminergic neurons (TH), interneurons (5-HT), sensory neurons (CALB1), excitatory neurons (calretinin, ChAT) and inhibitory neurons (nNOS) were studied. Scale bars, 100 μm. (c) HIOs and HIOs+ENS generated in vitro were analyzed by RNA-seq, and the gene ontology terms found were visualized using ReVIGO approach, which converts a list of gene-ontology terms into a semantic, similarity-based scatterplot after removing redundant terms. (d,e) HIOs and HIOs+ENS generated in vitro were analyzed by RNA-seq (n = 3 per condition). Expression of a curated list of enteric neural lineage and enteric neuron genes is shown.
Figure 2
Figure 2
Formation of a three-dimensional neuronal plexus in HIOs+ENS grown in vivo. (a) Gross morphology of HIOs and HIOs+ENS transplanted into the kidney subcapsular space of NOD-SCID IL-2Rγnull NSG mice for 6 weeks. Scale bar, 1 mm. (b) Left, H&E staining of intestinal tissue after transplantation. Middle, the smooth-muscle marker desmin (DES) shows the formation of smooth-muscle fibers located in myenteric and submucosal layers of HIO and HIO+ENS samples. Neurons (TUBB3+) were found only in HIOs+ENS samples. Right, neurons in HIOs+ENS surround the epithelium (CDH1). Scale bar, 100 μm. Data are representative of three independent transplantation experiments (HIOs, n = 9; HIOs+ENS, n = 14). (c) Whole-mount immunostaining and three-dimensional imaging of human intestine and HIOs+ENS. En face view of human adult and infant myenteric plexus and HIOs+ENS, showing the arrangement of neurons (TUBB3) and neuronal bodies (HuC/D) into a neuronal plexus. Scale bars represent 100 μm. (d) En face view of human adult and infant myenteric plexus and HIOs+ENS showing arrangement of glia (S100β) into a plexus. Scale bars, 100 μm (middle) and 200 μm (left and right). Data are representative of two independent experiments (human adult, n = 5; infant, n = 2; HIOs+ENS, n = 5).
Figure 3
Figure 3
Live imaging of neural activity in HIOs+ENS. (a) Live imaging of Ca2+ flux in the neural-crest-derived ENS cells revealed periodic activity. Shown are snapshots from a 20-min time-lapse video (see Supplementary Video 3) of neural activity in HIOs+ENS. Colored arrows point to cells whose pixel intensity was measured over time. Numbers in snapshots correspond to numbered peaks in the graph. The graph measures fluorescence values as ΔF/F0, (ΔF = FtF0), where Ft is observed fluorescence at time t and F0 is fluorescence at t = 0. The color of the line corresponds to the same colored arrowhead in the snapshots. Scale bars, 50 μm. (b) Live imaging of Ca2+ flux in HIOs+ENS grown in vitro before (left) and after KCl treatment, which induced a rapid calcium efflux in the ENS cells (see Supplementary Video 4). Data are representative of two independent experiments. Scale bars, 100 μm. (c) Live imaging of Ca2+ flux in HIOs+ENS grown in vivo shows calcium transients in nerve bundles before and after KCl treatment, which induces a broad calcium efflux and contraction of the tissue (see Supplementary Videos 5 and 6). In vivo data are representative of two independent experiments with n = 3 organoids engrafted into individual mice per experiment. Scale bars, 100 μm (left) and 500 μm (right).
Figure 4
Figure 4
ENS-independent and dependent control of contractile activity. (a) The ENS in HIOs mediates peristaltic-like contractions (see Supplementary Videos 7–9). In vivo grown tissues were explanted and subjected to EFS. HIOs without ENS subjected to high-voltage EFS (1-ms pulse at 100 V) showed one contraction (left, n = 2). HIOs+ENS subjected to low-voltage EFS (1-ms pulse at 50 V) showed a sustained series of wave-like contractions (middle, n = 5) that were lost when tissues were cultured in TTX (TTX-treated HIOs+ENS, right; n = 2). Automated point tracking demonstrated a differential movement in HIOs+ENS, as compared to HIOs, that was lost after TTX treatment. Scale bars, 1 mm. (b) Recordings of spontaneous contractions in transplanted HIO and HIO+ENS tissue strips. Phasic contractions were observed after tissue equilibration (no stimulation), suggestive of ICCs in both HIO (n = 7) and HIO+ENS (n = 7) tissues. (c) Inhibition of ICC activity with methylene blue led to loss of contractile activity (n = 3). (d) Detection of ICCs (CD117, red) in both HIOs and HIOs+ENS in vivo. HIOs without NCCs did not form neurons (TUBB3, green). Scale bars, 100 μm. (e) DMPP stimulation in HIOs and HIOs+ENS. Right, area under the curve (AUC) during DMPP (10 μM) stimulation measured for 2 min before and after stimulation (n = 7). (f) TTX inhibition of ENS activation. DMPP stimulation measured for 2 min, followed by TTX (10 μM) treatment of HIOs+ENS (n = 7). (g) NOS+ neurons were present in HIOs+ENS grown in vivo. Scale bars, 100 μm. (h) ENS-induced relaxation by a NO-dependent mechanism. Shown is the AUC during DMPP stimulation measured for 2 min, followed by L-NAME treatment of HIOs+ENS (n = 7). For box and whisker plots, the black line across the box represents the median, the box represents interquartile range and the whiskers represent the minimum and maximum. *P < 0.05, **P < 0.01, Mann–Whitney test.
Figure 5
Figure 5
ENS effects on the epithelium. (a–c) Heat maps of RNA-sequencing data from in vitro HIOs and HIOs+ENS. Curated list of digestive-tract development (a) and digestive function (b) genes revealed a differential regulation in HIOs+ENS, as compared to HIOs. A curated list of epithelial lineage markers, including enterocytes, goblet cells, enteroendocrine cells, Paneth cells and stem cell/transit-amplifying cells, is shown in c. Each lineage seemed to be affected by the presence of an ENS. (d) Double chromogenic staining with CDH1 and KI67 was performed to examine cell proliferation. HIOs+ENS (n = 4) showed increased proliferation, as compared to HIOs (n = 3), that was similar to human intestinal crypts (n = 3). Student's t test, two-tailed, unpaired. Data are presented as means ± s.e.m. (e) Imaging of enteroendocrine (SYN1, synapsin1; CHGA, chromogranin A) and neuronal cells (TUBB3) in HIOs+ENS (n = 6) showed no apparent interaction between neurons and enteroendocrine cells, as compared with human intestinal tissue (n = 4). Left, arrow indicates enteroendocrine cell neuropod in human ENS. Right, arrow indicates association of neurons and enteroendocrine cell in human ENS. Scale bars, 5 μm.
Figure 6
Figure 6
Modeling a Hirschsprung's-disease-causing mutation in PHOX2B. (a) Clustering of RNA-seq results from 4-week old in vitro HIOs+ENS with and without the PHOX2BY14X mutation. Genes shown display statistically significant differences of at least twofold change in expression between homozygous and wild-type NCC conditions (ANOVA with Benjamini–Hochberg false discovery at a threshold of P < 0.05). (b) The top gene-ontology categories displaying differences in gene expression between HIOs+ENS generated with PHOX2BY14X/Y14X NCCs, as compared to HIOs+ENS generated with wild-type PHOX2B+/+ NCCs. Categories in red were upregulated in the homozygous condition, whereas categories in blue were downregulated. (c) In vivo growth of HIOs+ENS generated with PHOX2B NCCs. Top row, bright-field images of harvested organoids after 7 weeks of post-transplantation growth under the murine kidney capsule. Fractions indicate the number of organoids that grew and contained intestinal epithelium. Scale bars, 2 mm. Middle row, development of neurons (TUBB3+) in the transplanted organoids. Bottom row, development of glia (S100β+) in the transplanted organoids. Scale bars, 100 μm.

Comment in

References

    1. Furness JB. The enteric nervous system and neurogastroenterology. Nat Rev Gastroenterol Hepatol. 2012;9:286–294. - PubMed
    1. Sasselli V, Pachnis V, Burns AJ. The enteric nervous system. Dev Biol. 2012;366:64–73. - PubMed
    1. Obermayr F, Hotta R, Enomoto H, Young HM. Development and developmental disorders of the enteric nervous system. Nat Rev Gastroenterol Hepatol. 2013;10:43–57. - PubMed
    1. Saffrey MJ. Cellular changes in the enteric nervous system during ageing. Dev Biol. 2013;382:344–355. - PubMed
    1. McKeown SJ, Stamp L, Hao MM, Young HM. Hirschsprung disease: a developmental disorder of the enteric nervous system. Wiley Interdiscip Rev Dev Biol. 2013;2:113–129. - PubMed

Publication types

MeSH terms