. 2016 Dec;299(12):1734-1752.
doi: 10.1002/ar.23484.

The Biomechanics of Zygomatic Arch Shape

Affiliations

The Biomechanics of Zygomatic Arch Shape

Amanda L Smith et al. Anat Rec (Hoboken). 2016 Dec.

Abstract

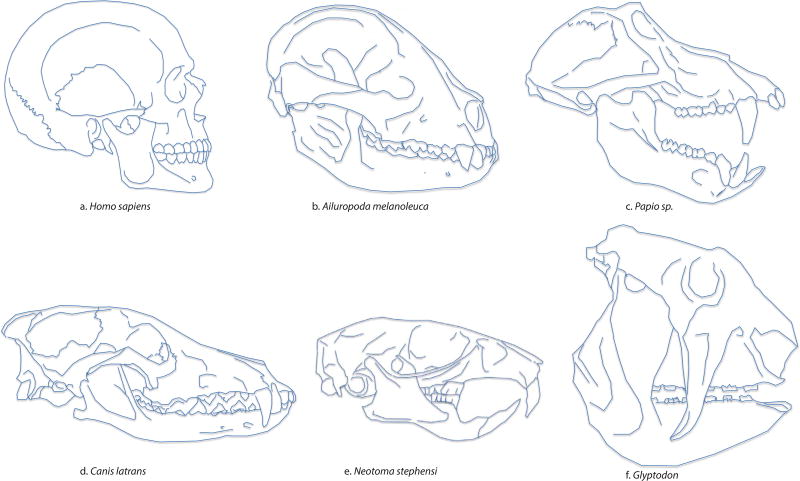
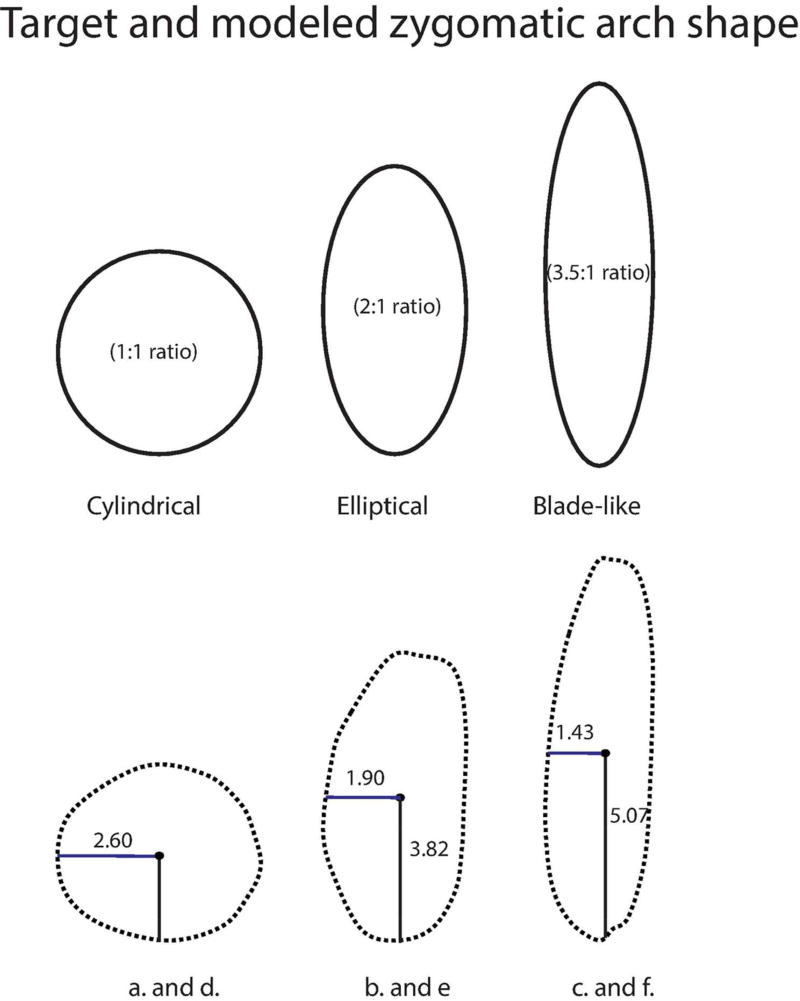
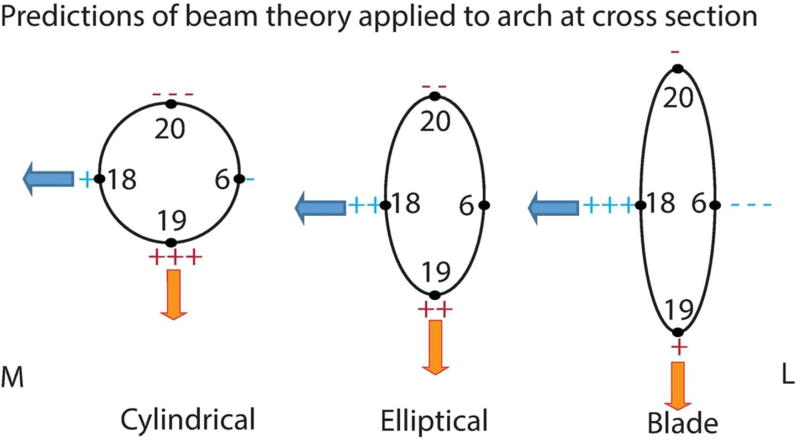
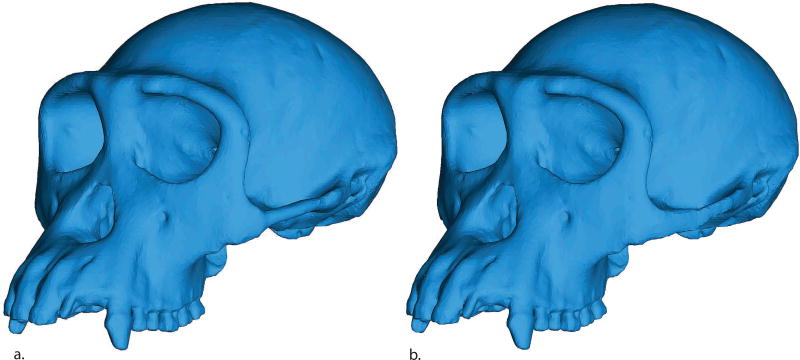
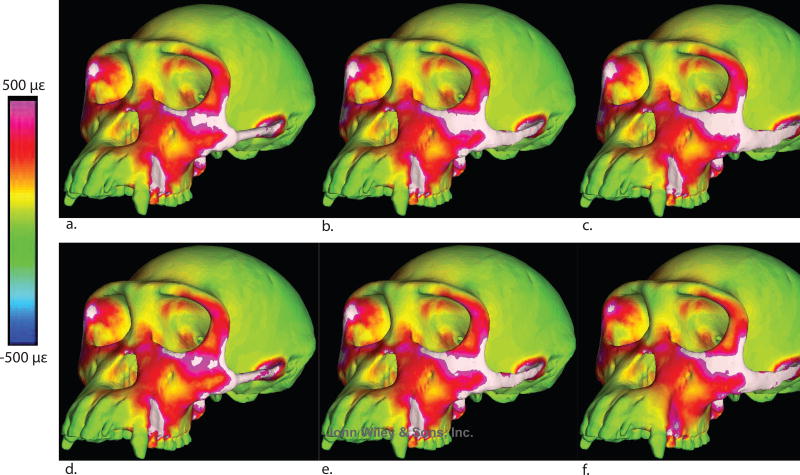
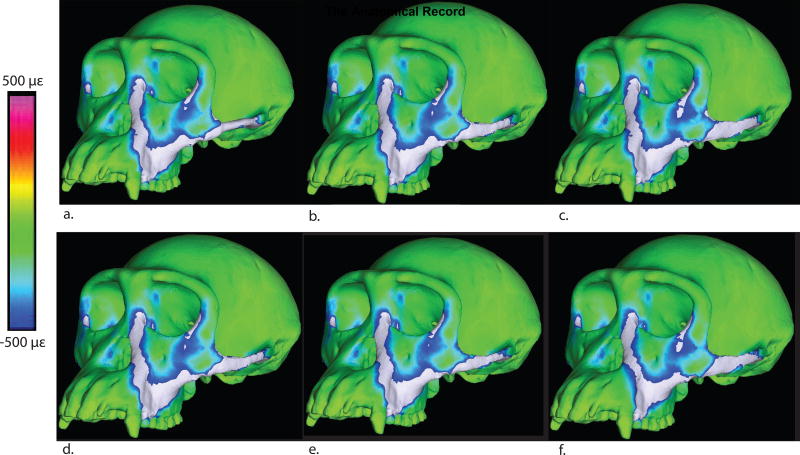
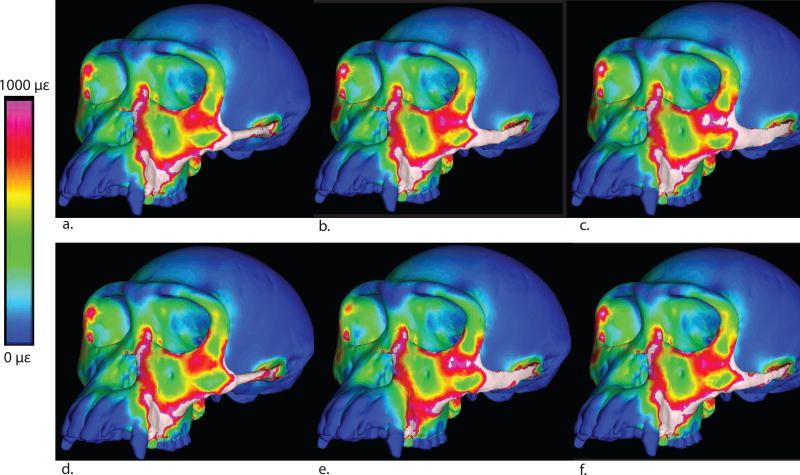
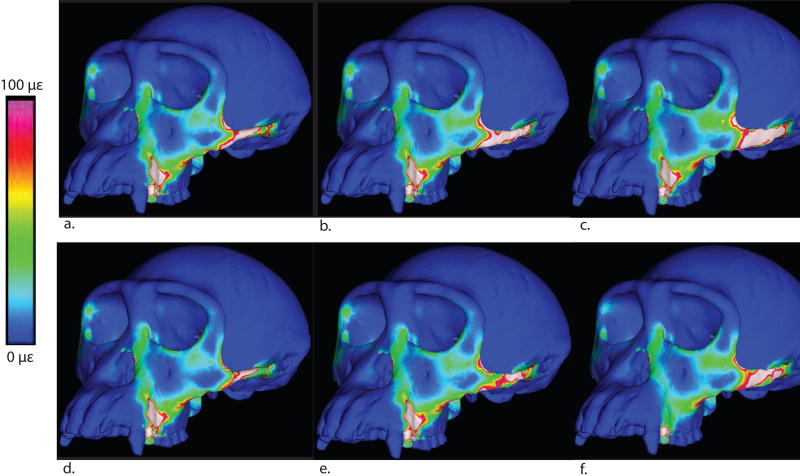
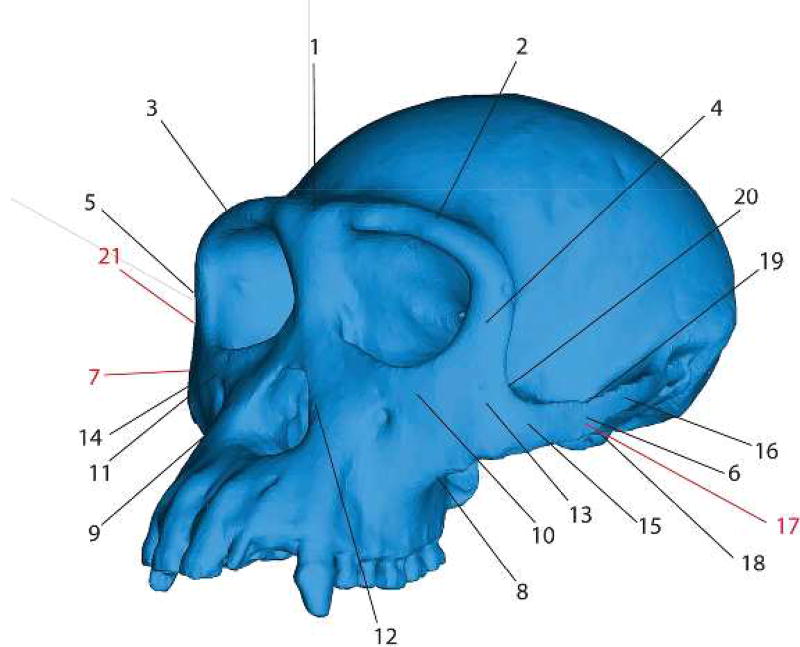
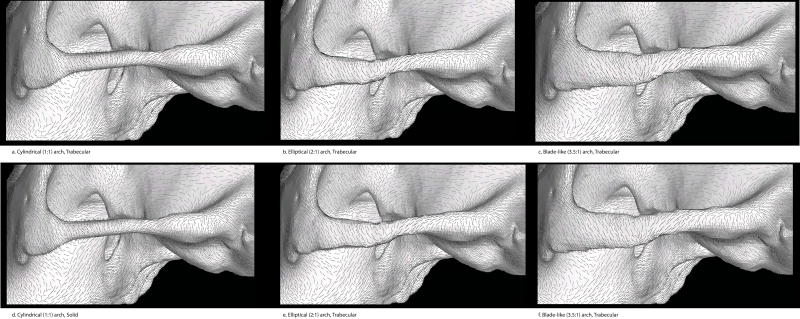
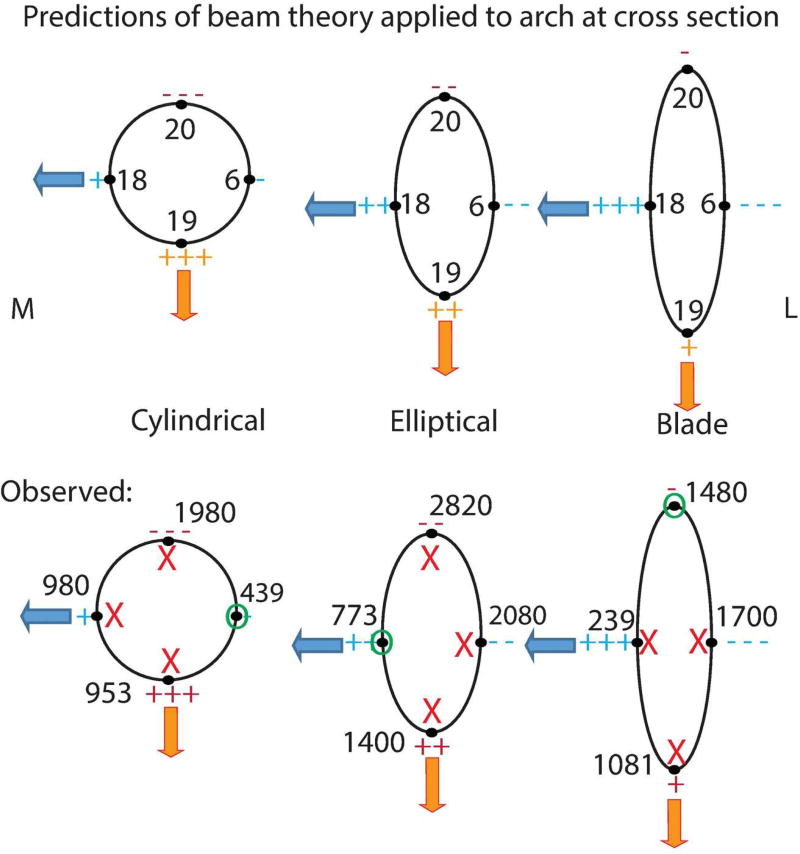
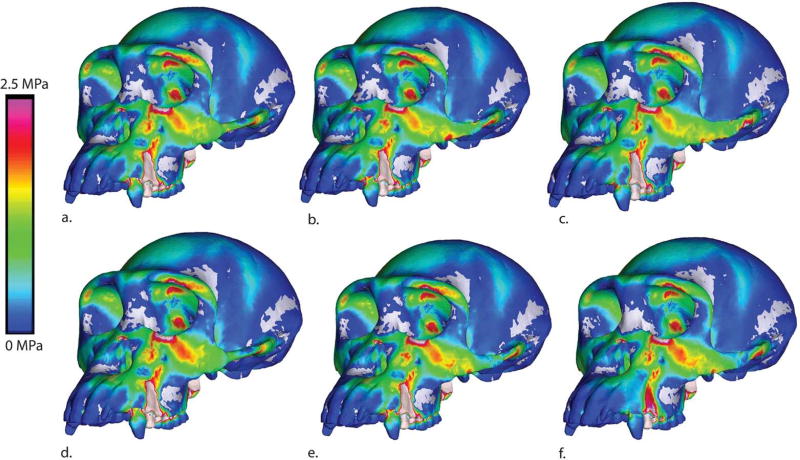
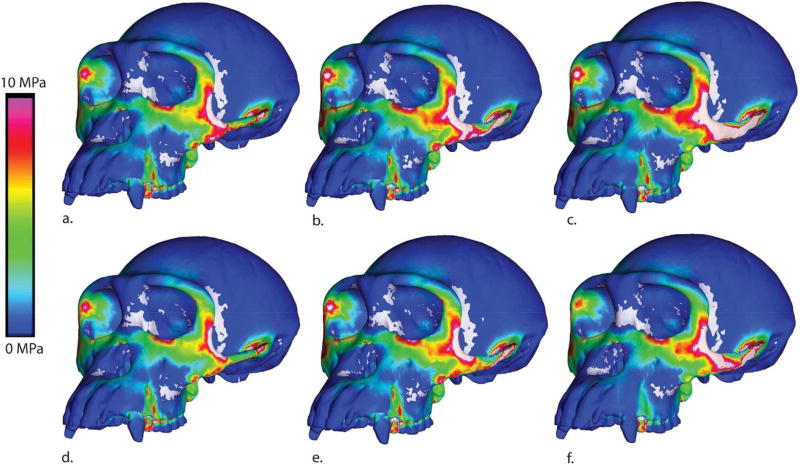
Mammalian zygomatic arch shape is remarkably variable, ranging from nearly cylindrical to blade-like in cross section. Based on geometry, the arch can be hypothesized to be a sub-structural beam whose ability to resist deformation is related to cross sectional shape. We expect zygomatic arches with different cross sectional shapes to vary in the degree to which they resist local bending and torsion due to the contraction of the masseter muscle. A stiffer arch may lead to an increase in the relative proportion of applied muscle load being transmitted through the arch to other cranial regions, resulting in elevated cranial stress (and thus, strain). Here, we examine the mechanics of the zygomatic arch using a series of finite element modeling experiments in which the cross section of the arch of Pan troglodytes has been modified to conform to idealized shapes (cylindrical, elliptical, blade-like). We find that the shape of the zygomatic arch has local effects on stain that do not conform to beam theory. One exception is that possessing a blade-like arch leads to elevated strains at the postorbital zygomatic junction and just below the orbits. Furthermore, although modeling the arch as solid cortical bone did not have the effect of elevating strains in other parts of the face, as had been expected, it does have a small effect on stress associated with masseter contraction. These results are counterintuitive. Even though the arch has simple beam-like geometry, we fail to find a simple mechanical explanation for the diversity of arch shape. Anat Rec, 299:1734-1752, 2016. © 2016 Wiley Periodicals, Inc.

Keywords: FEA; Pan troglodytes; force; shape; strain; stress; zygomatic arch.


Figures

Figure 1
Figure 1
Variation in zygomatic arch shape across mammalian taxa. a: Modern human, b: Giant Panda, c: Baboon, d: Coyote, e: Wood Rat, f: Glyptodon. Skulls are scaled for viewing and do not reflect actual size of species.
Figure 2
Figure 2
Schematic of theoretical zygomatic arch shape in cross-section. Top shapes represent target shapes and bottom shapes depict outline of achieved shape. Please note target height and width ratios and achieved maximum height and width at mid-arch. Height and width of each model in millimeters. Cylindrical arch refers to models a. and d., Elliptical arch refers to models b. and e, Blade-like arch refers to models c. and f.
Figure 3
Figure 3
Predictions of beam theory applied to different cross sectional shapes. Numbers correspond to sampling locations. “M” is medial and “L” is lateral. Orange arrows represent parasaggital bending and blue arrows represent mediolateral bending. Tension is represented by “+” and compression is represented by “−“ with +, ++ and +++ (−, −−, and −−−) representing least, intermediate and most tension respectively.
Figure 4
Figure 4
Figure 5
Figure 5
Maximum principal strain color maps for all models. a: Cylindrical trabecular. b: Elliptical trabecular, c: Blade-like trabecular, d: Solid cylindrical, e: Solid elliptical, f: Solid blade-like.
Figure 6
Figure 6
Minimum principal strain colormaps for all models. a: Cylindrical trabecular. b: Elliptical trabecular, c: Blade-like trabecular, d: Solid cylindrical, e: Solid elliptical, f: Solid blade-like.
Figure 7
Figure 7
von Mises strain colormaps for all models. a: Cylindrical trabecular. b: Elliptical trabecular, c: Blade-like trabecular, d: Solid cylindrical, e: Solid elliptical, f: Solid blade-like.
Figure 8
Figure 8
SED colormaps for all models. a: Cylindrical trabecular. b: Elliptical trabecular, c: Blade-like trabecular, d: Solid cylindrical, e: Solid elliptical, f: Solid blade-like.
Figure 9
Figure 9
Key to regions where strains were sampled in finite element models. 1 = Dorsal interorbital. 2 = Working side dorsal orbital. 3 = Balancing side dorsal orbital. 4 = Working side postorbital bar. 5 = Balancing side postorbital bar. 6 = Working side zygomatic arch. 7 = Balancing side zygomatic arch. 8 = Working side zygomatic root. 9 = Balancing size zygomatic root. 10 = Working side infraorbital. 11 = Balancing side infraorbital. 12 = Working side nasal margin. 13= Working zygomatic body. 14= Balancing zygomatic body. 15= Working side anterior zygomatic arch. 16= Working side posterior zygomatic arch. 17= Working side zygomatic arch (mid-arch, medial aspect). 18= Working side inferior margin of zygomatic arch (mid-arch). 19= Working side superior margin of zygomatic arch (mid-arch). 20= Working side zygomatic-postorbital junction. 21= Balancing side zygomatic-postorbital junction. Red indicates that the point is not visible in this view.
Figure 10
Figure 10
Strain directions for all models. in lateral view (working side). a: Cylindrical trabecular. b: Elliptical trabecular, c: Blade-like trabecular, d: Cylindrical solid, e: Elliptical solid, f: Blade-like solid
Figure 11
Figure 11
Predictions of beam theory for different cross sectional shapes compared to strain results measured in FEMs. Top row depicts predictions (as in Figure 3) and bottom row includes strain results in microstrain (either maximum or minimum principal strain). Numbers in top illustrations correspond to sampling locations. “M” is medial and “L” is lateral. Orange arrows represent parasaggital bending and blue arrows represent mediolateral bending. Tension is represented by “+” and compression is represented by “-“ with +, ++ and +++ (−, −−, and −−−) representing least, intermediate and most tension respectively. Bottom row: strains are in microstrain. Red "X' indicates that strains at this location do not match predictions of beam theory. Green "O" indicates that strains at this location do match predictions of beam theory.
Figure 12
Figure 12
Maximum principal stress colormap for models loaded without the masseter muscle
Figure 13
Figure 13
Maximum principal stress colormap for models loaded by only the masseter muscle

References

    1. Ashman RB, Rho JY, Turner CH. Anatomical variation of orthotropic elastic moduli of the human proximal tibia. J Biomech. 1989;22:895–900. - PubMed
    1. Attard MRG, Parr WCH, Wilson LAB, Archer M, Hand SJ, Rogers TL, Wroe S. Virtual reconstruction and prey size preference in the mid Cenozoic Thylacinid, Nimbacinus dicksoni (Thylacinidae, Marsupialia) PLOSOne. 2014:e93088. - PMC - PubMed
    1. Bramble DM. Origin of the mammalian feeding complex: models and mechanisms. Paleobiol. 1978;4(3):271–301.
    1. Buckland-Wright JC. Bone structure and the pattern of force transmission in the cat skull (Felis catus) J Morphol. 1978;155(1):35–61. - PubMed
    1. Christiansen P. Evolution of skull and mandible shape in cats (Carnivora: Felidae) PLOSOne. 2008;3(7):e2807. doi: 10.1371/journal.pone.0002807. - DOI - PMC - PubMed

Publication types

LinkOut - more resources