. 2017 Jan;19(1):17-27.
doi: 10.1038/ncb3444. Epub 2016 Nov 21.

Clonal fate mapping quantifies the number of haematopoietic stem cells that arise during development

Affiliations

Clonal fate mapping quantifies the number of haematopoietic stem cells that arise during development

Jonathan Henninger et al. Nat Cell Biol. 2017 Jan.

Erratum in

Abstract

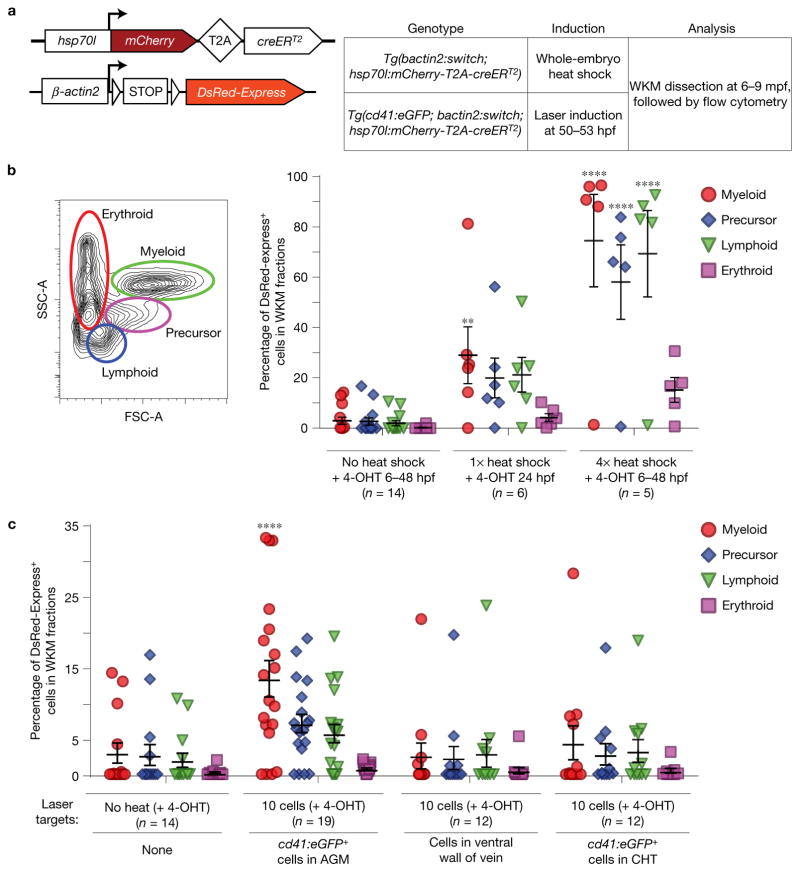
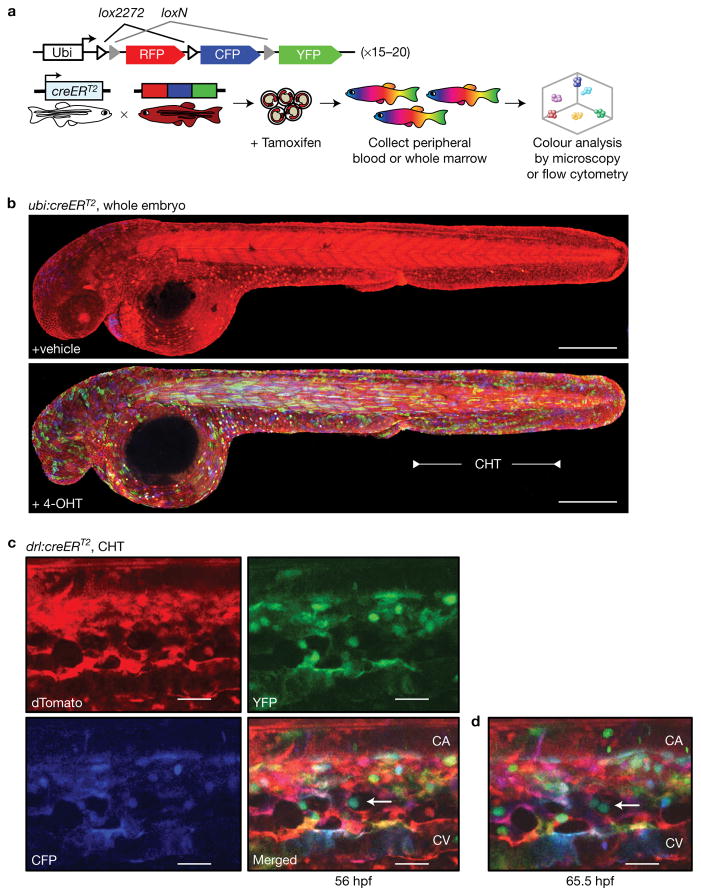
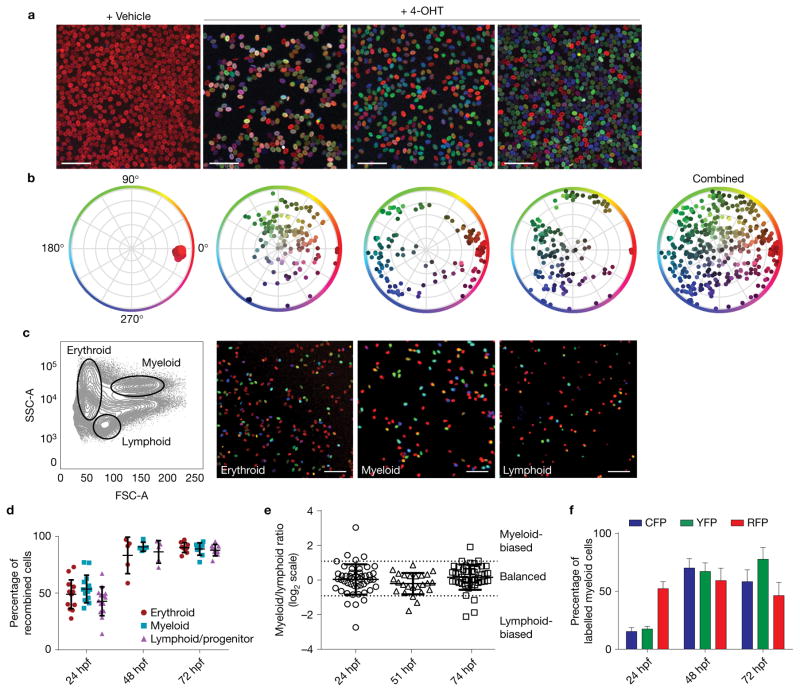
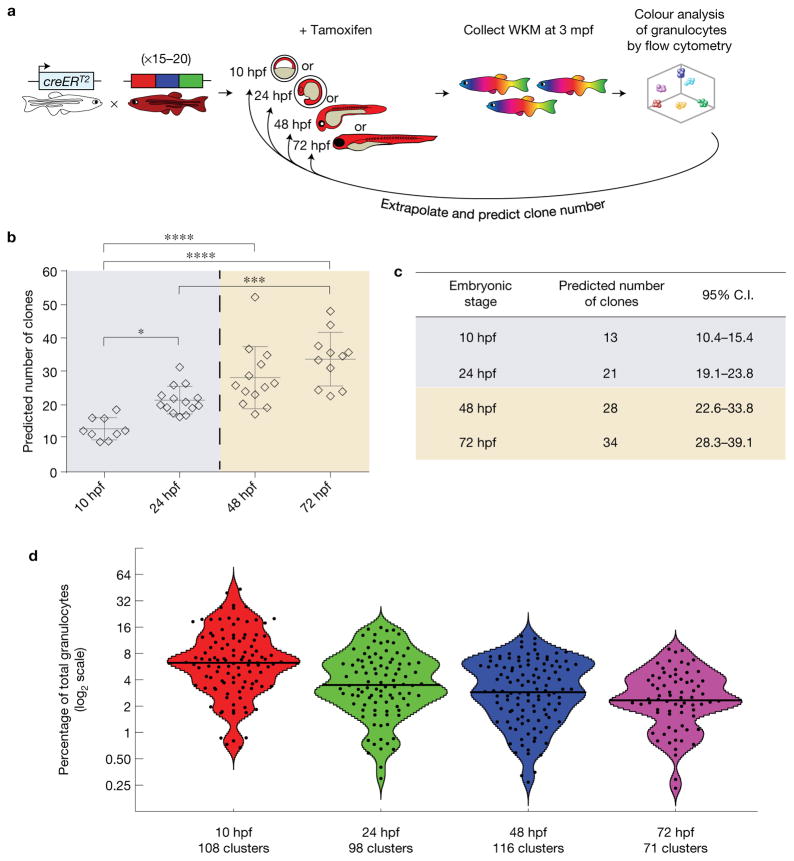
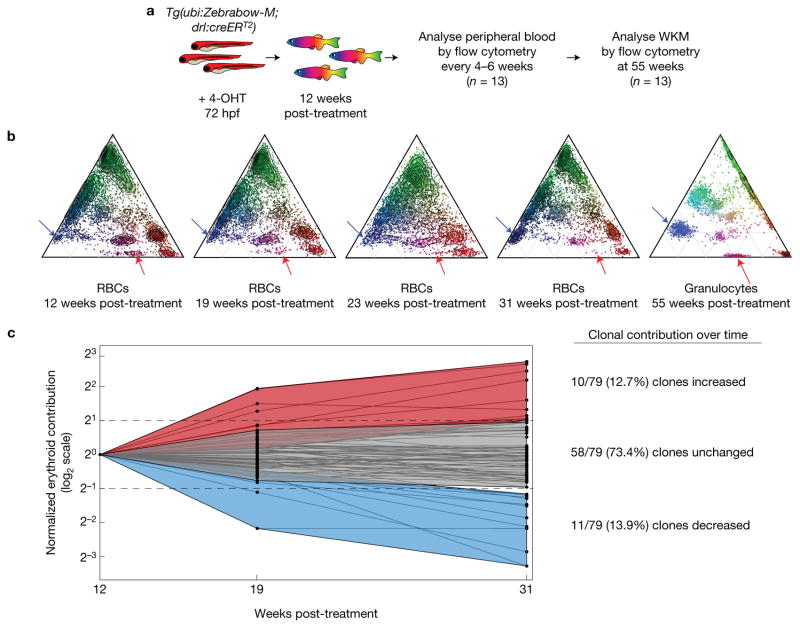
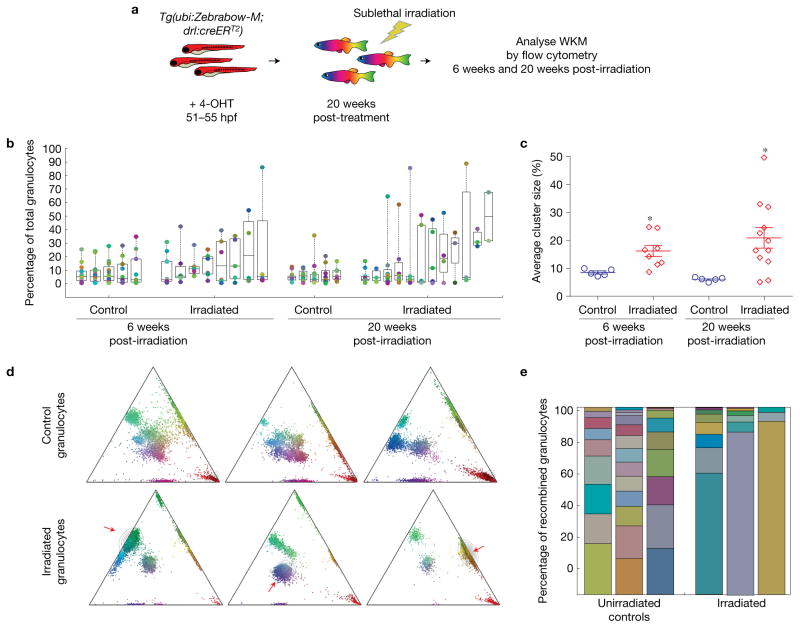
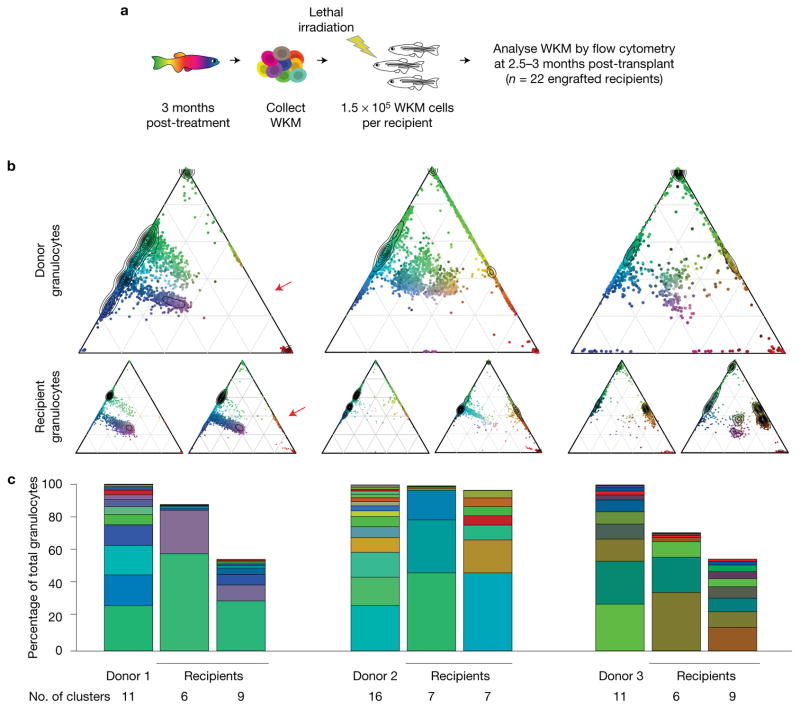
Haematopoietic stem cells (HSCs) arise in the developing aorta during embryogenesis. The number of HSC clones born has been estimated through transplantation, but experimental approaches to assess the absolute number of forming HSCs in a native setting have remained challenging. Here, we applied single-cell and clonal analysis of HSCs in zebrafish to quantify developing HSCs. Targeting creERT2 in developing cd41:eGFP+ HSCs enabled long-term assessment of their blood contribution. We also applied the Brainbow-based multicolour Zebrabow system with drl:creERT2 that is active in early haematopoiesis to induce heritable colour barcoding unique to each HSC and its progeny. Our findings reveal that approximately 21 HSC clones exist prior to HSC emergence and 30 clones are present during peak production from aortic endothelium. Our methods further reveal that stress haematopoiesis, including sublethal irradiation and transplantation, reduces clonal diversity. Our findings provide quantitative insights into the early clonal events that regulate haematopoietic development.


Conflict of interest statement

COMPETING FINANCIAL INTERESTS

L.Z. is a founder and stock holder of Fate, Inc., and Scholar Rock.

Figures

Figure 1
Figure 1
Contribution of embryonic cd41:eGFP+ HSCs to adult kidney marrow. (a) Transgenes used for DsRed-Express labelling: bactin2:switch and hsp70l:mCherry-T2A-creERT2. mpf, months post-fertilization. (b) Quantification showing the percentage of DsRed-Express+ cells in each of the four WKM fractions after whole-embryo heat shock, with mean and s.e.m. (c) Quantification showing the percentage of DsRed-Express+ cells in each of the four WKM fractions after targeted laser induction, with mean and s.e.m. Each circle represents one animal. **P = 0.0067, ****P < 0.0001, with two-way analysis of variance (ANOVA).
Figure 2
Figure 2
Zebrabow label induction with drl:creERT2 induces mosaic colour barcoding in blood and vasculature during embryogenesis. (a) The Zebrabow transgene and strategy to induce clonal labelling during early blood development. (b) Tg(Zebrabow-M;ubi:creERT2) embryos were treated with vehicle control (top) or 4-OHT (bottom) at 24 hpf and imaged by confocal microscopy at 48 hpf to measure mosaic label induction (the blue heart of the vehicle control is eGFP signal from a heart-specific cmlc2:eGFP marker on the ubi:creERT2 construct; scale bar, 300 μm). (c) Tg(Zebrabow-M;drl:creERT2) embryos were treated at 24 hpf and the CHT region was imaged by confocal microscopy at 48 hpf. Merging images of the three fluorescent proteins gives the blood and vasculature a variety of hues (CA, caudal artery; CV, caudal vein; scale bar, 25 μm). (d) Time-lapse confocal microscopy of these embryos reveals division of putative stem cells (white arrow) in perivascular niches that yield progeny with identical colours. (scale bar, 25 μm)
Figure 3
Figure 3
Label induction in Zebrabow embryos leads to multilineage, polyclonal colour labelling in adult blood and marrow. (a) Tg(ubi:Zebrabow-M;drl:creERT2) embryos were treated with 4-OHT during development and grown to adulthood. Peripheral blood smears were imaged by confocal microscopy and show multicoloured blood in treated fish (scale bar, 50 μm). (b) Multiple, unique colours are evident by measurement of hue and saturation. (c) Mature blood lineages were sorted by fluorescence-activated cell sorting (FACS) and imaged, demonstrating labelling of multipotent HSCs (scale bar, 50 μm). (d) Quantification of labelling efficiency in the mature blood populations at multiple treatment times, measured by flow cytometry (n = 14, 5 and 9 fish for 24, 48 and 72 hpf, respectively). (e) Quantification of lineage contribution at multiple treatment times by flow cytometry. Each marker corresponds to an individual colour clone with the ratio of its myeloid/lymphoid contribution on a log2 scale. Thresholds for lineage bias are defined as ratios below 0.5 or above 2 (mean with s.d., n = 48, 25 and 46 clones for 24, 51 and 74 hpf, respectively). (f) Quantification of fluorophore-positive cells in multiple fish at multiple treatment times. Comparison of CFP+ and YFP+ percentages by two-tailed t-test showed no statistically significant differences at any time (P = 0.594, 0.792 and 0.192 and n = 12, 5 and 10 fish for 24, 48 and 72 hpf, respectively). Error bars show mean and s.e.m. (d,f).
Figure 4
Figure 4
Quantification of colour barcodes in mature granulocytes from Zebrabow-labelled marrow. The intensity levels of the three fluorescent Zebrabow-derived proteins can be analysed by flow cytometry. (1) Myeloid cells are isolated by FSC and SSC characteristics. (2) Their intensity values are transformed and normalized. R, red; B, blue; G, green. (3) Ternary plots show the relative contribution of each fluorescent protein to the colour of the cell. (4) Colour barcodes are determined by supervised, density-based clustering to identify cluster centres. ρ, local density; δ, distance from points of higher density. (5) Clusters can be pseudo-coloured by mean colour of the cluster, and bar graphs show quantification of the clonal contribution to the entirety of the myeloid population. (6) The quality of clustering is evaluated by calculating a silhouette value (s-value) for each cell with a given clustering solution. s-values are plotted for each cell belonging to each colour cluster (grey bars), where the total average (solid black line) of s-values for a given cluster measures the quality of that cluster (dashed black line, threshold for high quality clusters). Cells with s-values below zero most probably do not belong to that cluster (red arrows). The asterisk indicates polyclonal RFP+-only cells derived from unrecombined clones.
Figure 5
Figure 5
Clonal analysis with fate mapping predicts the number of stem cells born during development. (a) Tg(ubi:Zebrabow-M;drl:creERT2) embryos were treated at distinct developmental times and grown to adulthood. (b) Colour barcodes in granulocytes were quantified and extrapolated to predict the number of clones present during label induction that contribute to adult blood (the dashed line marks the beginning of definitive haematopoiesis; n = 9, 14, 13 and 11 fish for 10, 24, 48 and 72 hpf, respectively). Each marker represents one animal. Error bars show mean and s.e.m. (*P = 0.026, ***P = 0.0003, ****P < 0.0001, one-way ANOVA). (c) Table showing quantification of these predicted values with 95% confidence intervals (C.I.). (d) Violin plots showing the distribution of all colour clones from all analysed zebrafish. The x axis shows the treatment time, while the y axis shows the log2 percentage contribution of each clone (black dots) to the total granulocyte pool. At later treatment times, the mean clonal contribution (black line) decreases as the number of clones increases (n = 108, 98, 116 and 71 colour clusters for 10, 24, 48 and 72 hpf, respectively). Cluster data are available in Supplementary Table 1.
Figure 6
Figure 6
Longitudinal dynamics of labelled erythrocytes. (a) Strategy to evaluate clonal dynamics in the erythroid lineage. (b) Example ternary diagrams that show colour barcode distribution measured by flow cytometry from a single fish over time. The last ternary plot shows colours in granulocytes at a final time (red arrows, clone with decreased contribution over time in erythrocytes (RBCs); blue arrows, clone with increased contribution). (c) Quantification of individual clonal contribution over three analysis times. The contributions of individual colour clones (black dots) were compared across multiple times (log2 scale). Data were normalized to the contribution at the first time. The majority of clones maintain a stable contribution to the blood pool, while a few clones increase (>2-fold) or decrease (>2-fold) in contribution over time relative to the initial time.
Figure 7
Figure 7
Sublethal irradiation of Zebrabow-labelled marrow. (a) Strategy to measure the effects of sublethal irradiation on clonal diversity in Zebrabow-labelled marrow. (b) Quantification of colour barcodes in mature granulocytes as a percentage of total cells (log2 scale) in control or irradiated animals. Each column of circles corresponds to an individual animal. Box plots show the median and interquartile range (n = 6 and 8 fish for control and irradiated conditions at 6 weeks post irradiation, n = 5 and 12 fish for control and irradiated conditions at 20 weeks post irradiation). (c) Summary of sublethal irradiation data, showing mean cluster sizes in control and irradiated animals (error bars, s.e.m.). Each marker corresponds to an individual animal (n values are identical to those in (b), *P < 0.05, P = 0.017 at 6 weeks, P = 0.021 at 20 weeks, two-tailed t-test). (d) Example ternary plots from control and irradiated adult zebrafish demonstrating severe reduction of clonal diversity. The red arrows indicate an expanded clone. (e) Stacked bar graphs showing the clonal distribution of control and irradiated adult zebrafish.
Figure 8
Figure 8
Transplant of Zebrabow-labelled marrow into lethally irradiated recipients. (a) Transplantation strategy for labelled marrow. (b) Example ternary diagrams showing colour distribution in granulocytes for three donors with two recipients per donor (red arrow, new colour barcode in recipient). (c) Bar graphs show colour barcode distributions in granulocytes of donors and recipients depicted in b. Each column corresponds to a single animal.

References

    1. Bertrand JY, et al. Haematopoietic stem cells derive directly from aortic endothelium during development. Nature. 2010;464:108–111. - PMC - PubMed
    1. Chen MJ, Yokomizo T, Zeigler BM, Dzierzak E, Speck NA. Runx1 is required for the endothelial to haematopoietic cell transition but not thereafter. Nature. 2009;457:887–891. - PMC - PubMed
    1. Zovein AC, et al. Fate tracing reveals the endothelial origin of hematopoietic stem cells. Cell Stem Cell. 2008;3:625–636. - PMC - PubMed
    1. Boisset JC, et al. In vivo imaging of haematopoietic cells emerging from the mouse aortic endothelium. Nature. 2010;464:116–120. - PubMed
    1. Kissa K, et al. Live imaging of emerging hematopoietic stem cells and early thymus colonization. Blood. 2008;111:1147–1156. - PubMed

Substances