. 2016 Nov 21;11(11):e0166803.
doi: 10.1371/journal.pone.0166803. eCollection 2016.

Activin Receptor Type IIB Inhibition Improves Muscle Phenotype and Function in a Mouse Model of Spinal Muscular Atrophy

Affiliations

Activin Receptor Type IIB Inhibition Improves Muscle Phenotype and Function in a Mouse Model of Spinal Muscular Atrophy

Min Liu et al. PLoS One. .

Abstract

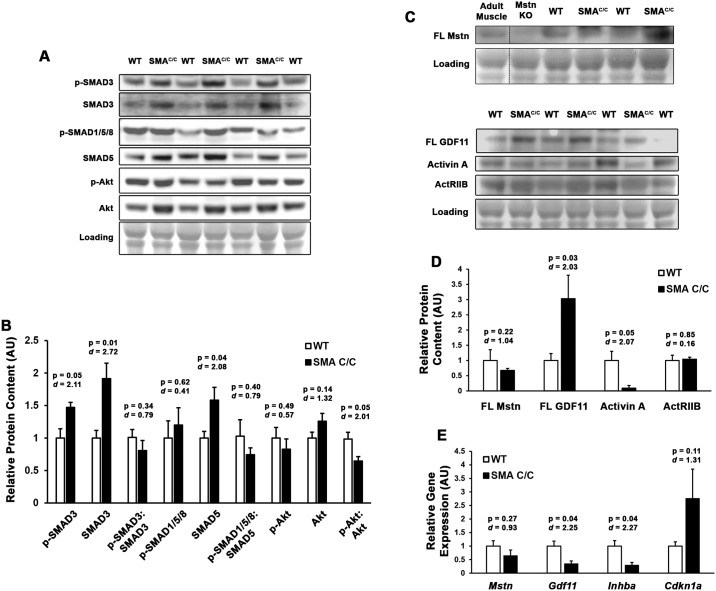
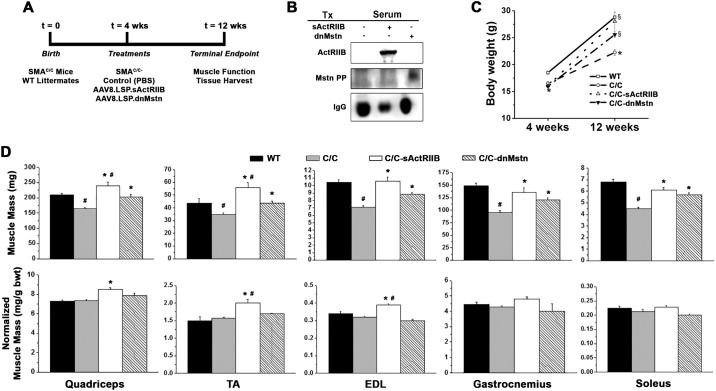
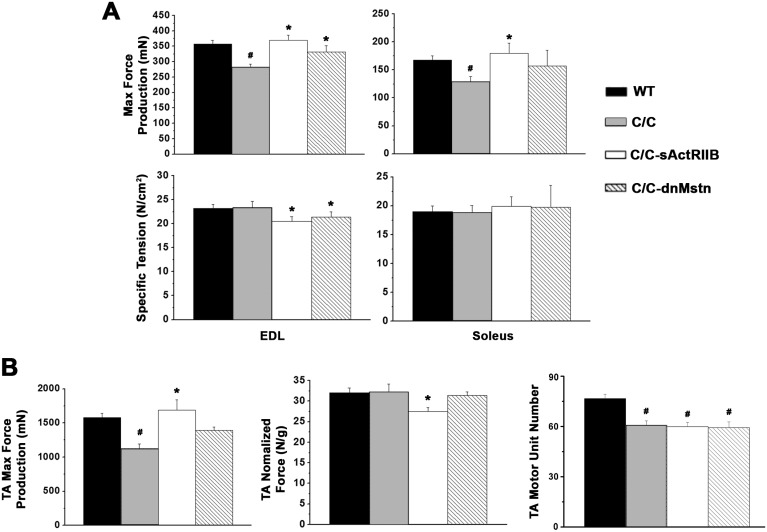
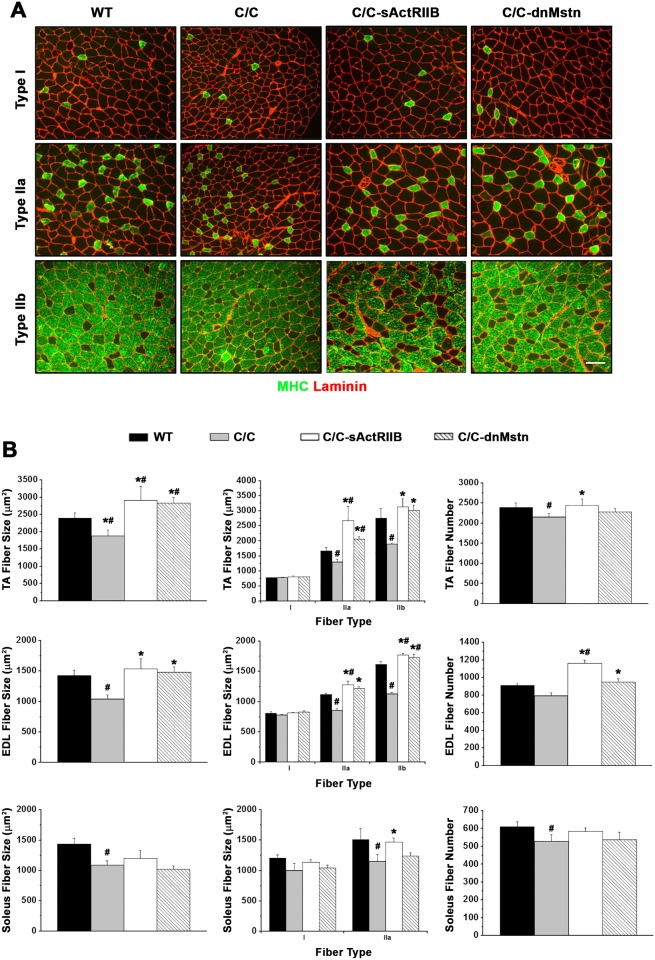
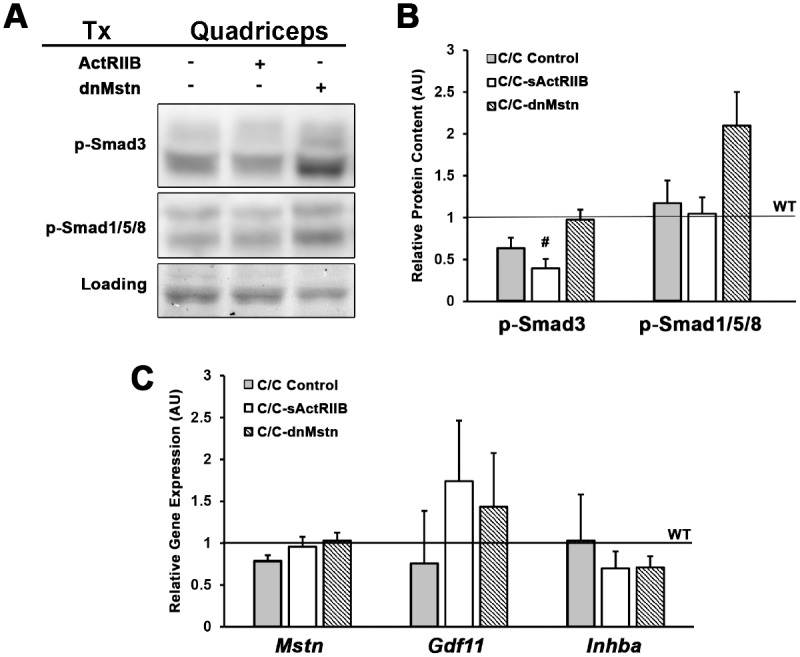
Spinal muscular atrophy (SMA) is a devastating neurodegenerative disorder that causes progressive muscle atrophy and weakness. Using adeno-associated virus-mediated gene transfer, we evaluated the potential to improve skeletal muscle weakness via systemic, postnatal inhibition of either myostatin or all signaling via the activin receptor type IIB (ActRIIB). After demonstrating elevated p-SMAD3 content and differential content of ActRIIB ligands, 4-week-old male C/C SMA model mice were treated intraperitoneally with 1x10¹² genome copies of pseudotype 2/8 virus encoding a soluble form of the ActRIIB extracellular domain (sActRIIB) or protease-resistant myostatin propeptide (dnMstn) driven by a liver specific promoter. At 12 weeks of age, muscle mass and function were improved in treated C/C mice by both treatments, compared to controls. The fast fiber type muscles had a greater response to treatment than did slow muscles, and the greatest therapeutic effects were found with sActRIIB treatment. Myostatin/activin inhibition, however, did not rescue C/C mice from the reduction in motor unit numbers of the tibialis anterior muscle. Collectively, this study indicates that myostatin/activin inhibition represents a potential therapeutic strategy to increase muscle mass and strength, but not neuromuscular junction defects, in less severe forms of SMA.


Conflict of interest statement

The authors have declared that no competing interests exist.

Figures

Fig 1
Fig 1. Hyperactivation of activin signaling pathway in young SMAC/C mouse skeletal muscle.
(A-B) Quadriceps muscles from 4 week-old SMAc/c mice (n = 3) and wild-type (WT) littermates (n = 4) were immunoblotted for phosphorylated and total SMAD3, SMAD1/5/8, and Akt content. (C-D) Protein content of full-length (FL) myostatin (Mstn), FL GDF11, Activin A, and activin IIB receptor (ActRIIB) was measured by immunoblotting IgG-depleted quadriceps lystate samples. Immunoblotting quantifications are normalized to Ponceau Red-visualized loading. Adult muscle and Mstn knockout (KO) samples are included to demonstrate specificity of the antibody used. (E) Relative gene expression of Mstn, Gdf11, Inhba, and Cdkn1a (normalized to Gapdh) of the 4 week-old mouse quadriceps, as measured by real-time PCR. Data were analyzed using Student’s T-tests, and are presented as mean ± SEM with p-values and effect size (d) displayed.
Fig 2
Fig 2. Activin signaling inhibition rescues muscle mass deficits in SMAC/C mice.
(A) Study design of the activin inhibition study, where 4 week-old SMAc/c mice received control (PBS; n = 6), AAV8.LSP.sActRIIB (n = 6), or AAV8.LSP.dnMstn treatments (n = 6), and were evaluated in comparison to wild-type (WT; n = 6) littermates at 12 weeks of age. (B) Detection of systemic soluble ActRIIB (sActRIIB) or dominant-negative myostatin pro-peptide (dnMstn) in the serum of treated SMAc/c using antibodies against ActRIIB and Mstn N-terminus (Mstn PP). Endogenous mouse IgG serves as a loading control. (C) Mouse body weights at 4 weeks and 12 weeks of age, displayed as mean ± SEM and analyzed using one-way ANOVA (Bonferroni-Dunn post-hoc tests; *p < 0.05 vs. WT values; §p < 0.05 vs. control C/C values). (D) Muscle masses of quadriceps, tibialis anterior (TA), extensor digitorum longus (EDL), gastrocnemius, and soleus muscles displayed as both absolute mass (top) and normalized to bodyweight (bottom) of WT and SMAC/C treatments group mice at 12 weeks of age. Data are displayed as mean ± SEM and analyzed using one-way ANOVA (Bonferroni-Dunn post-hoc tests; #p < 0.05 vs. WT values; *p < 0.05 vs. control C/C values).
Fig 3
Fig 3. Activin inhibition improves contractile properties of SMAC/C mice.
(A) Muscle contractile properties of extensor digitorum longus (EDL; in situ) and soleus (ex vivo) muscles from 12 week-old wild-type (WT; n = 6) and SMAC/C mice from control (C/C; n = 6), AAV8.LSP.sActRIIB (C/C-sActRIIB; n = 6), and AAV8.LSP.dnMstn (C/C-dnMstn; n = 6) treatment groups in terms of absolute peak tetanic isometric force production (top) and specific tension (bottom). (B) In situ contractile properties of the tibialis anterior (TA), in terms of absolute peak tetanic isometric force production (left) and mass-normalized force (middle). TA motor unit number was also evaluated (right). Data are displayed as mean ± SEM and analyzed using one-way ANOVA (Bonferroni-Dunn post-hoc tests; #p < 0.05 vs. WT values; *p < 0.05 vs. control C/C values).
Fig 4
Fig 4. Fast twitch muscle fiber size of SMAC/C mice rescued by activin inhibition.
(A) Representative tibialis anterior (TA) muscle cross-sections stained with anti-myosin heavy chain (MHC) isoform and anti-laminin for fiber-typing and area analysis. Scale bar indicates 100μm. (B) Total muscle fiber size (left), muscle fiber size by fiber type (middle) and total muscle fibers (right) from the TA, extensor digitorum longus (EDL), and soleus muscles from 12 week-old wild-type (WT; n = 6) and SMAC/C mice from control (C/C; n = 6), AAV8.LSP.sActRIIB (C/C-sActRIIB; n = 6), and AAV8.LSP.dnMstn (C/C-dnMstn; n = 6) treatment groups. Data are displayed as mean ± SEM and analyzed using one-way ANOVA (Bonferroni-Dunn post-hoc tests; #p < 0.05 vs. WT values; *p < 0.05 vs. control C/C values).
Fig 5
Fig 5. SMAD signaling altered by activin inhibition of SMAC/C mice.
(A-B) Phosphorylated levels of SMAD3 and SMAD1/5/8 in quadriceps lysates of 12 week-old SMAC/C mice from control (C/C; n = 3), AAV8.LSP.sActRIIB (C/C-sActRIIB; n = 4), and AAV8.LSP.dnMstn (C/C-dnMstn; n = 4) treatment groups, normalized to Ponceau Red-visualized loading and relative to wild-type (WT) littermate levels. (C) Relative gene expression of Mstn, Gdf11, and Inhba (normalized to Gapdh) of 12 week-old SMAC/C quadriceps, as measured by real-time PCR and displayed relative to WT levels. Data are displayed as mean ± SEM and analyzed using one-way ANOVA (Bonferroni-Dunn post-hoc tests; #p < 0.05 vs. WT values; *p < 0.05 vs. control C/C values).

References

    1. Sugarman EA, Nagan N, Zhu H, Akmaev VR, Zhou Z, Rohlfs EM, et al. Pan-ethnic carrier screening and prenatal diagnosis for spinal muscular atrophy: clinical laboratory analysis of >72,400 specimens. Eur J Hum Genet. 2011;20(1):27–32. 10.1038/ejhg.2011.134 - DOI - PMC - PubMed
    1. Lefebvre S, Burglen L, Reboullet S, Clermont O, Burlet P, Viollet L, et al. Identification and characterization of a spinal muscular atrophy-determining gene. Cell. 1995;80(1):155–65. . - PubMed
    1. McAndrew PE, Parsons DW, Simard LR, Rochette C, Ray PN, Mendell JR, et al. Identification of proximal spinal muscular atrophy carriers and patients by analysis of SMNT and SMNC gene copy number. Am J Hum Genet. 1997;60(6):1411–22. 10.1086/515465 - DOI - PMC - PubMed
    1. Ogino S, Wilson RB, Gold B. New insights on the evolution of the SMN1 and SMN2 region: simulation and meta-analysis for allele and haplotype frequency calculations. Eur J Hum Genet. 2004;12(12):1015–23. 10.1038/sj.ejhg.5201288 . - DOI - PubMed
    1. Dubowitz V. Ramblings in the history of spinal muscular atrophy. Neuromuscul Disord. 2009;19(1):69–73. 10.1016/j.nmd.2008.10.004 . - DOI - PubMed

MeSH terms