. 2016 Nov 21;11(11):e0167097.
doi: 10.1371/journal.pone.0167097. eCollection 2016.

Cytomegalovirus Reinfections Stimulate CD8 T-Memory Inflation

Affiliations

Cytomegalovirus Reinfections Stimulate CD8 T-Memory Inflation

Joanne Trgovcich et al. PLoS One. .

Abstract

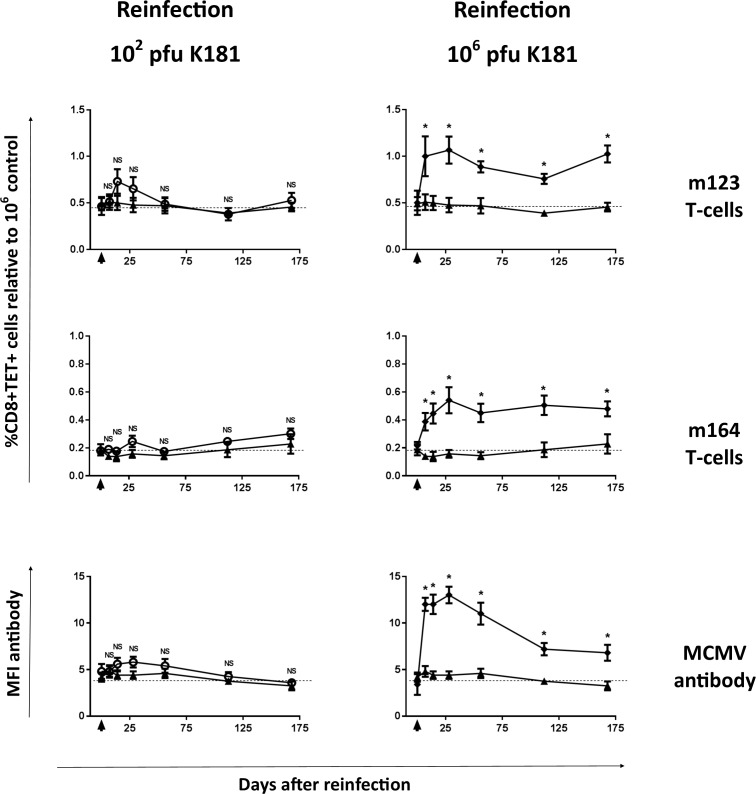
Cytomegalovirus (CMV) has been shown to induce large populations of CD8 T-effector memory cells that unlike central memory persist in large quantities following infection, a phenomenon commonly termed "memory inflation". Although murine models to date have shown very large and persistent CMV-specific T-cell expansions following infection, there is considerable variability in CMV-specific T-memory responses in humans. Historically such memory inflation in humans has been assumed a consequence of reactivation events during the life of the host. Because basic information about CMV infection/re-infection and reactivation in immune competent humans is not available, we used a murine model to test how primary infection, reinfection, and reactivation stimuli influence memory inflation. We show that low titer infections induce "partial" memory inflation of both mCMV specific CD8 T-cells and antibody. We show further that reinfection with different strains can boost partial memory inflation. Finally, we show preliminary results suggesting that a single strong reactivation stimulus does not stimulate memory inflation. Altogether, our results suggest that while high titer primary infections can induce memory inflation, reinfections during the life of a host may be more important than previously appreciated.


Conflict of interest statement

The authors have declared that no competing interests exist.

Figures

Fig 1
Fig 1. Murine Cytomegalovirus (mCMV) specific T-cell inflation depends upon infecting dose.
Mice 8–10 weeks old infected intraperitoneally with 102 (A&E), 103 (B&F), 104 (C&G), or 106 (D&H) plaque forming units (pfu) Smith strain mCMV had peripheral blood mononuclear cells (PBMC) evaluated 16 weeks after infection for inflationary mCMV-specific T-cells. PBMC incubated with tetramers specific for m164 (A-D) or m123 (E-H) epitopes and CD8 were evaluated by flow cytometry and representative scatter plots from individual mice are shown. Mice infected with 106 pfu mCMV show classic inflation of m164 and m123-specific CD8+ cells as previously described by others (D&H). In contrast, mice infected with lower titers show less inflation by 16 weeks (m164 A-C, pp89 E-G). I&J. Summary of m164 and m123-specific T-cell results for each cohort 16 weeks after infection. Results represent a single longitudinal experiment. For I-J each point represents a single mouse, and bars represent mean and standard error for each cohort with corresponding p-values in comparison to naive.
Fig 2
Fig 2. Inflation of murine cytomegalovirus (mCMV) specific T-cells and antibody over time.
Mice 8–10 weeks old infected intraperitoneally with 102, 103, 104, or 106 plaque forming units Smith mCMV had peripheral blood obtained longitudinally 4, 12 and 16 weeks after infection evaluated for mCMV-specific T-cells and antibody. A. m164-specific CD8+ T-cells were enumerated by flow cytometry using tetramers. B. Sera were evaluated for mCMV specific IgG by ELISA with results reported in mean fluorescent intensities;—indicates the limit of sensitivity of the assay. For A&B, * indicates significantly higher than all lower titer cohorts (P<0.05). Results represent a single longitudinal experiment with each point/bar representing the mean and standard error for n = 5 mice.
Fig 3
Fig 3. Verification of productive infection and viral DNA load of mice infected with different doses of mCMV Smith.
Mice infected at 8–10 weeks of age with 102, 103, 104 or 106 plaque forming units (pfu) mCMV Smith strain or mock treated with PBS were evaluated on day 10 post infection. Viral DNA loads were determined individually for A. lungs and B. Salivary glands of 5 mice per group. C. Salivary gland viral titers were quantitated in pfu/ml to confirm productive infection. Results represent a single experiment with mean values and standard errors indicated by horizontal bar and error bars, with individual dots representing each mouse. Mock treated mice had no detectable viral DNA or infectious virus. * indicates that means were significantly higher than mock. ** indicates that means are significantly lower than mice infected with 106 pfu. Comparisons were by Students t-test using p-value <0.05.
Fig 4
Fig 4. Phenotypic analysis of murine cytomegalovirus (mCMV) specific T-cells after low titer infection.
Mice infected intraperitoneally at 8–10 weeks of age with 102 or 106 plaque forming units (pfu) Smith mCMV had peripheral blood evaluated by flow cytometry for m123 and m164-specific CD8 T-cells 16 weeks after infection. mCMV-specific CD8+ T-cells identified with tetramer staining were further evaluated for surface expression of CD44, CD27, CD62L, and KLRG1. Representative superimposed histograms from n = 5 replicates each of low titer (102 pfu, open line) and high titer (106 pfu, gray filled) mice are shown.
Fig 5
Fig 5. Influence of reinfection on T-cell and antibody inflation.
Cohorts of mice infected at 8–10 weeks of age with 102 plaque forming units (pfu) Smith strain murine cytomegalovirus (mCMV) were evaluated over time beginning 154 days (22 weeks) after primary infection. Peripheral blood mononuclear cells (PBMC) were evaluated for m123 and m164-specific T-cells 1 week prior to and then sequentially after reinfection (dark arrowhead) with K181 mCMV or mock treatment with vehicle. CD8 T-cell results following reinfections are expressed relative to age and infection duration matched 106 control mice (not shown). Lower panels show mCMV-specific IgG responses. ▲represents mock reinfection, while ○ and ♦ represent reinfections with K181 at respectively 102 or 106 pfu. Data presented are from single longitudinal experiments with each data point representing means of n = 5 mice, with bars showing standard errors. * indicates significantly different than mock reinfected mice (p<0.05), and NS indicates no significant difference (p>0.05).
Fig 6
Fig 6. Memory inflation after reactivation stimuli.
Mice latently infected with low titer (102 plaque forming units (pfu)) Smith strain cytomegalovirus (mCMV) (infected at 8–10 weeks of age and allowed 16 weeks to develop latency) were treated with a transcriptional reactivation stimulus lipopolysaccharide (LPS) or control (saline) (both administered intraperitoneal (i.p.)). A. Latently infected mice (16 weeks post-infection (pi)) were treated with LPS and 12 weeks later peripheral blood mononuclear cells (PBMC) were evaluated for mCMV m123 and m164 specific T-cells. PBMC results are absolute percentages of CD8+ cells binding tetramers. B. Latently infected mice 22 weeks after low titer infection had PBMC monitored serially for m123 and m164 specific T-cells, and results are expressed as % of CD8+ cells binding tetramer relative to a 106 pfu control cohort for each time. Data presented are from one of three separate experiments with each point/bars representing means and standard errors from n = 5 mice.

References

    1. Swanson PA II, Hofstetter AR, Wilson JJ, Lukacher AE. Cutting Edge: Shift in Antigen Dependence by an Antiviral MHC Class Ib-Restricted CD8 T Cell Response during Persistent Viral Infection. J Immunol. 2009;182(9):5198–202. 10.4049/jimmunol.0900421 - DOI - PMC - PubMed
    1. Simmons R, Sharp C, Sims S, Kloverpris H, Goulder P, Simmonds P, et al. High Frequency, Sustained T Cell Responses to PARV4 Suggest Viral Persistence In Vivo. J Infect Dis. 2011;203(10):1378–87. 10.1093/infdis/jir036 - DOI - PMC - PubMed
    1. Lang A, Brien JD, Nikolich-Zugich J. Inflation and Long-Term Maintenance of CD8 T Cells Responding to a Latent Herpesvirus Depend upon Establishment of Latency and Presence of Viral Antigens. J Immunol. 2009;183(12):8077–87. 10.4049/jimmunol.0801117 - DOI - PMC - PubMed
    1. Norbeck O, Isa A, Pohlmann C, Broliden K, Kasprowicz V, Bowness P, et al. Sustained CD8+ T-cell responses induced after acute parvovirus B19 infection in humans. J Virol. 2005;79(18):12117–21. Epub 2005/09/06. 10.1128/JVI.79.18.12117-12121.2005 - DOI - PMC - PubMed
    1. Reddehase MJ, Keil GM, Koszinowski UH. The cytolytic T lymphocyte response to the murine cytomegalovirus. II. Detection of virus replication stage-specific antigens by separate populations of in vivo active cytolytic T lymphocyte precursors. Eur J Immunol. 1984;14(1):56–61. 10.1002/eji.1830140111 - DOI - PubMed

Substances