. 2016 Dec 1;540(7631):69-73.
doi: 10.1038/nature20151. Epub 2016 Nov 21.

The genomic basis of circadian and circalunar timing adaptations in a midge

Affiliations

The genomic basis of circadian and circalunar timing adaptations in a midge

Tobias S Kaiser et al. Nature. .

Abstract

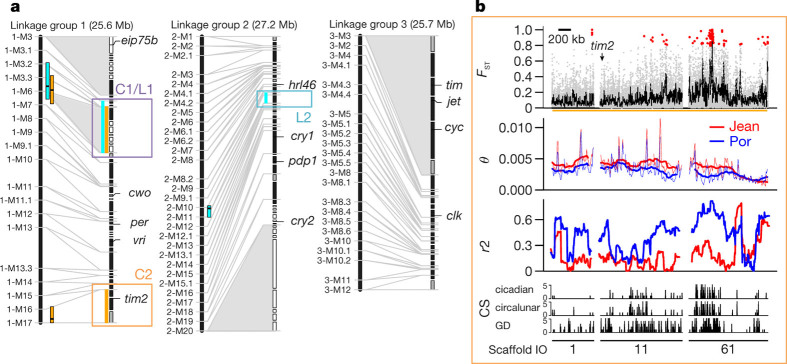
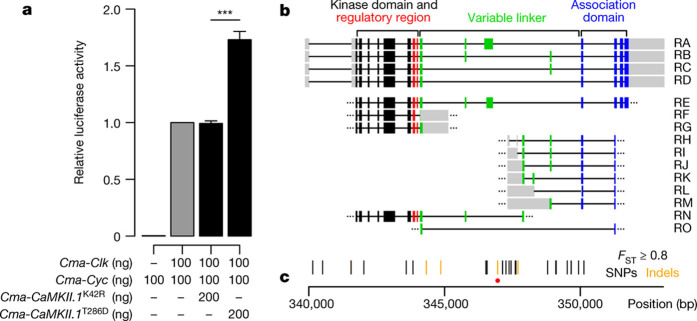
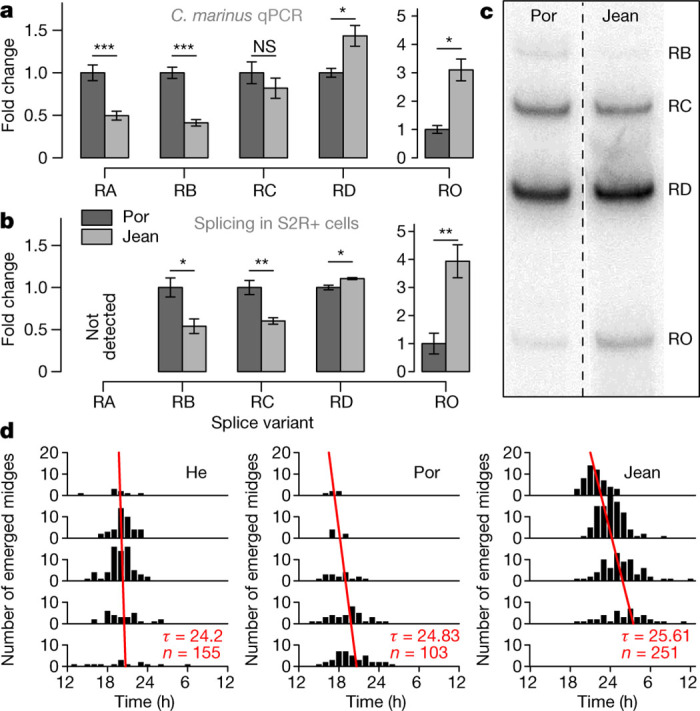
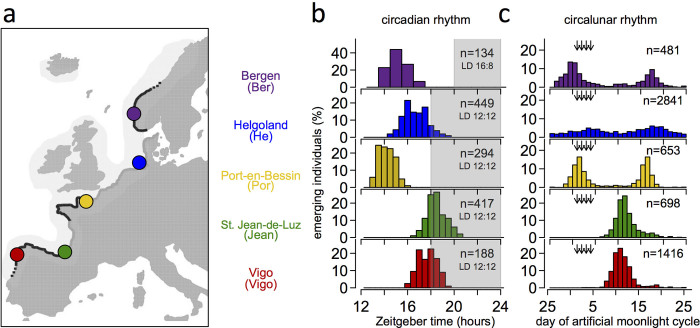
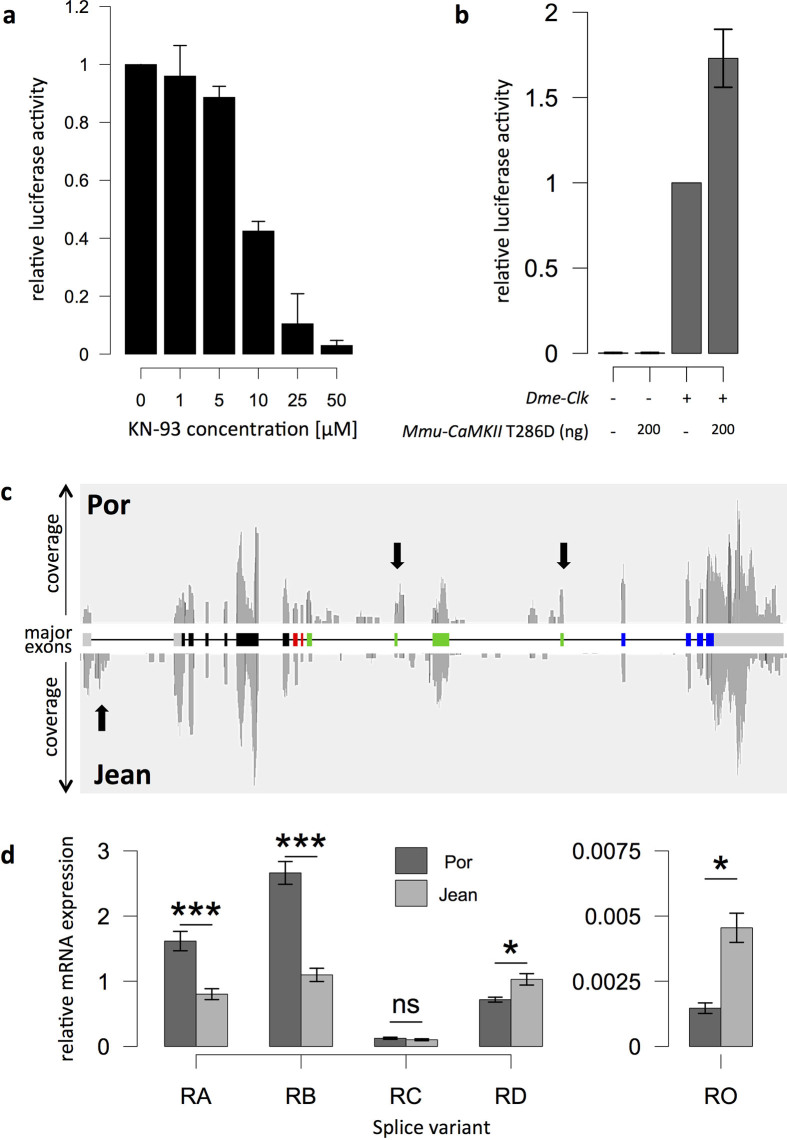
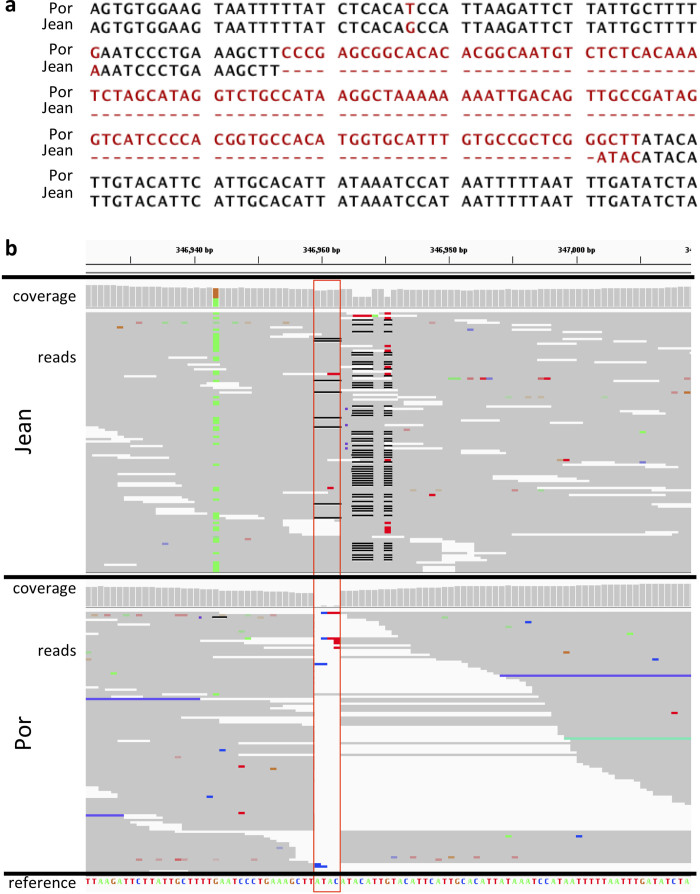
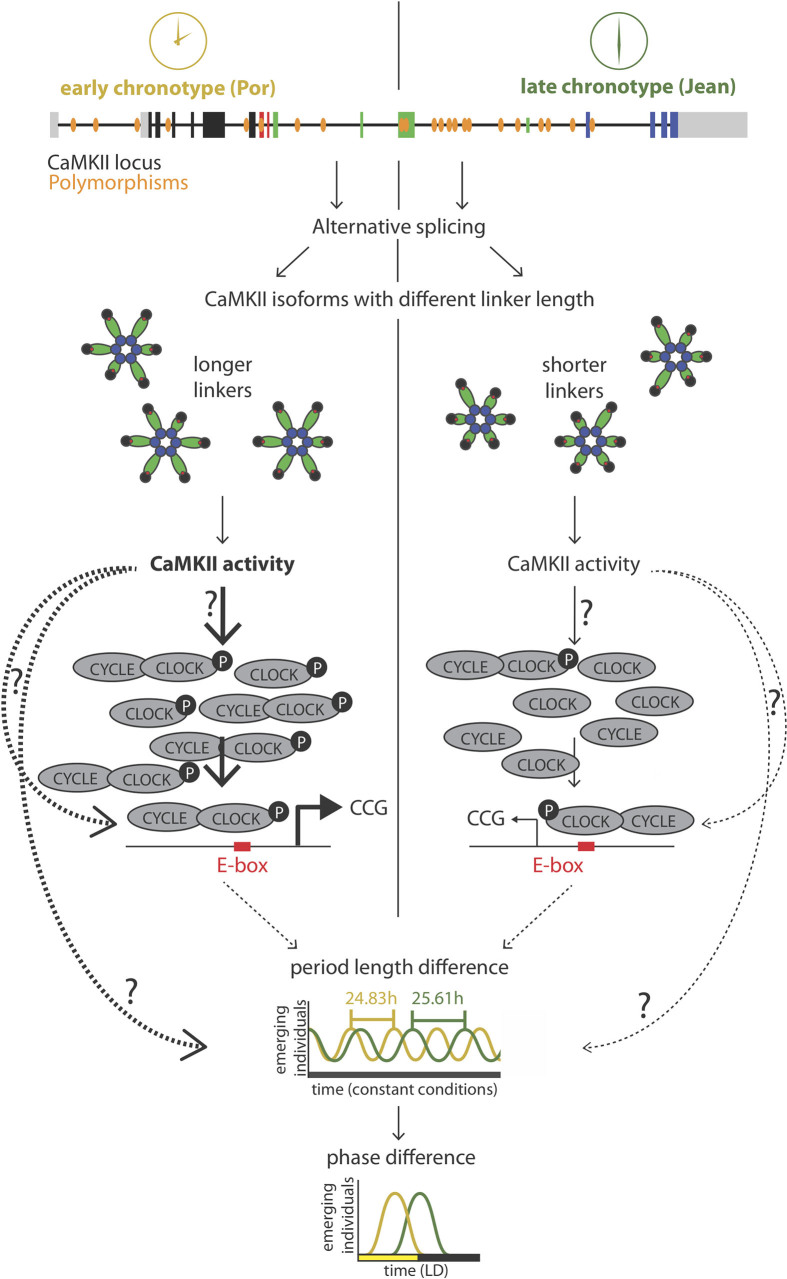
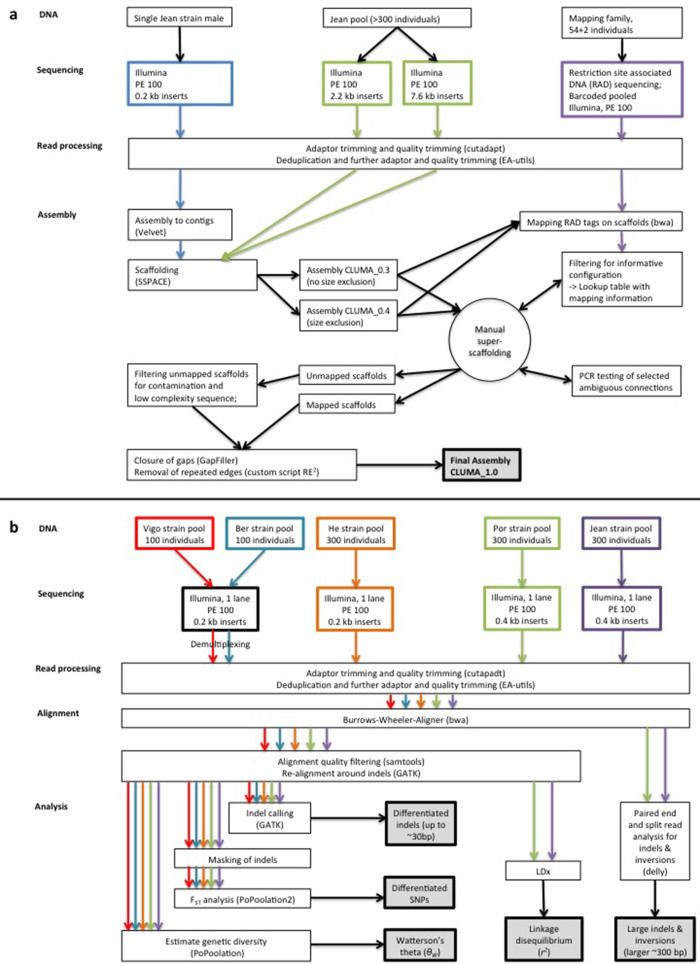
Organisms use endogenous clocks to anticipate regular environmental cycles, such as days and tides. Natural variants resulting in differently timed behaviour or physiology, known as chronotypes in humans, have not been well characterized at the molecular level. We sequenced the genome of Clunio marinus, a marine midge whose reproduction is timed by circadian and circalunar clocks. Midges from different locations show strain-specific genetic timing adaptations. We examined genetic variation in five C. marinus strains from different locations and mapped quantitative trait loci for circalunar and circadian chronotypes. The region most strongly associated with circadian chronotypes generates strain-specific differences in the abundance of calcium/calmodulin-dependent kinase II.1 (CaMKII.1) splice variants. As equivalent variants were shown to alter CaMKII activity in Drosophila melanogaster, and C. marinus (Cma)-CaMKII.1 increases the transcriptional activity of the dimer of the circadian proteins Cma-CLOCK and Cma-CYCLE, we suggest that modulation of alternative splicing is a mechanism for natural adaptation in circadian timing.


Conflict of interest statement

The authors declare no competing financial interests.

Figures

Figure 1
Figure 1. Identification of candidate regions in the timing QTLs by combined genetic and molecular maps.
a, The three linkage groups of C. marinus with reference scaffolds (right) anchored on a genetic linkage map (left). Scaffolds which are ordered and oriented, black bars; not oriented, grey bars; neither ordered nor oriented, white bars. Grey shadings, large non-recombining regions. QTLs, circadian (orange), circalunar (cyan). One circadian and circalunar QTL overlap, resulting in three physical QTL regions (C1/L1, C2 and L2, in purple, orange and cyan, respectively). b, Population genomic analysis of QTL C2. Analysis of Por and Jean strains (in blue and red, respectively, in middle two panels). Top panel, genetic differentiation for single SNPs (red dots) and in 5-kb windows (black line). Second panel, genetic diversity (θ) in 20-kb (thin line) and 200-kb (thick line) windows. Third panel, linkage disequilibrium (r2) in 100-kb windows. Bottom panel, correlation score (CS) for genetic differentiation with values for circadian timing (top), circalunar timing (middle) and geographic distance (bottom) for Vigo, Jean, Por, He and Ber strains. Bottom numbers, scaffold IDs. For further details, including QTLs C1/L1 and L2, see Extended Data Fig. 5a, b. PowerPoint slide
Figure 2
Figure 2. CaMKII.1 regulates Clk and Cyc transcriptional activity and exhibits strain specific splice variants.
a, Additional C. marinus CaMKII.1 increases the transcriptional activity of C. marinus Clk and Cyc in a D. melanogaster S2 cell luciferase assay using the 3X69 E-box containing enhancer (period 3X69–luc (ref. 21)). Data are represented as mean ± s.e.m.; two-sided Welch two-sample t-test; biological replicates, n = 5, except for no clk control, n = 3, each biological replicate represents the average of three preparation replicates. ***P < 0.0005. b, Exons of full (RA–RD) and partial (RE–RO) Cma-CaMKII.1 transcripts. c, Distribution of SNPs (black), indels (orange) and a 125-bp insertion (red dot) along the Cma-CaMKII.1 locus, all with FST ≥ 0.8. PowerPoint slide
Figure 3
Figure 3. Differential CaMKII.1 splicing depends on sequence differences in the CaMKII.1 locus and correlates with endogenous circadian period lengths.
a, qPCR values for CaMKII.1 splice variants from Por and Jean strains, normalized to Por (for non-normalized data, see Extended Data Fig. 6d). Data are represented as mean ± s.e.m.; Por, n = 9 biological replicates; Jean, n = 10; RO, Por, n = 3; Jean n = 8; RO was not detected in six Por biological replicates, suggesting an even larger expression difference; two-sided Wilcoxon rank-sum test; *P < 0.05; **P < 0.005; ***P < 0.0005; NS, not significant; Holm correction for multiple testing. For RNA-seq data quantification see Extended Data Fig. 6c. b, Differential splicing of the CaMKII.1 linker region in D. melanogaster S2R+ cells, normalized to Por, n = 7 biological replicates; two-sided two-sample t-test, otherwise as a. c, Representative phosphorimaging gel sections as quantified for b, two separate lanes from the same gel (for full gel, see Source Data). d, Free-running rhythm of adult emergence under constant dim white light (approximately 100 lx). He and Por share CaMKII.1 alleles, while Jean has the other allele. To calculate the free-running period, time between subsequent emergence peaks was averaged, weighting each peak by the number of individuals. PowerPoint slide
Extended Data Figure 1
Extended Data Figure 1. The biology of Clunio marinus.
a, C. marinus is restricted to rocky shores (black lines), the localities differing in tidal regime (adapted from ref. 67). b, c, Local strains show corresponding genetic adaptations in their circadian (b) and circalunar rhythms (c, He, Jean). Timing was measured in the laboratory under artificial moonlight (arrows in c) in a 30-day cycle and a light–dark cycle of 12:12 (He, Por, Jean, Vigo) or 16:8 (Ber). Seasonal differences in daily illumination duration do not affect circadian emergence peaks,. Historically, for C. marinus ‘zeitgeber time 0’ is defined as the middle of the dark phase.
Extended Data Figure 2
Extended Data Figure 2. The reconstructed chromosomes of C. marinus based on the genetic linkage map.
Left map, male informative markers. Right map, female informative markers. See Fig. 1a legend for further details.
Extended Data Figure 3
Extended Data Figure 3. C. marinus genome characterization.
a, Representative genomic region with densely packed gene models (super-scaffold 1, 535–565 kb). Gene models are shown in blue on a turquoise background. Gene predictions (SNAP) are shown in purple. Transcript evidence is shown in yellow. b, Phylogenetic relationships of C. marinus to other Diptera (according to ref. 77). c, Genetic diversity (θ; red) and linkage disequilibrium (r2; blue) of the Jean strain plotted for the three C. marinus linkage groups, revealing characteristic signatures of telomeres and centromeres. df, Synteny comparisons among the genomes of C. marinus, A. gambiae and D. melanogaster based on 5,388 1:1:1 orthologues.
Extended Data Figure 4
Extended Data Figure 4. Synteny analyses of C. marinus chromosome arms.
a, Gene content of the C. marinus chromosome arms relative to the chromosome arms of D. melanogaster (black bars) and A. gambiae (grey bars). The very small chromosome 4 of D. melanogaster is neglected. Chromosome arms of D. melanogaster and A. gambiae are paired according to their published homology. For four of the chromosome arms of C. marinus the homologous arms in D. melanogaster and A. gambiae are identified (grey shading). For comparison, the conservation of the identified D. melanogaster and A. gambiae homologues to each other is given by plotting the gene content of the homologous D. melanogaster chromosome arm relative to the different chromosome arms of A. gambiae (white bars). The numbers of orthologous genes considered in each comparison are given above the bars. For chromosome arm 2R of C. marinus the homologies are unclear. Possibly, chromosome arm 2R of C. marinus has undergone so many re-arrangements with other chromosome arms that it is no longer recognizable, which is consistent with complex polymorphic re-arrangements in this chromosome arm of C. marinus (see Supplementary Note 3). b, Microsynteny is analysed relative to D. melanogaster and A. gambiae, based on 5,388 1:1:1 orthologues. The fraction of genes in conserved microsynteny blocks is calculated and distributed along the phylogenetic tree. c, d, A simulation was used to estimate how many chromosomal re-arrangements are required to produce the observed degree of microsyntenic conservation (for details see Supplementary Note 3).
Extended Data Figure 5
Extended Data Figure 5. Population genomic analysis of QTLs C1/L1 and C2 and genome-wide analysis of locations and putative effects of SNPs and indels.
a, b, Population genomic analysis of QTLs C1/L1 and C2. Panels 1–3: Por versus Jean strains in blue and red, respectively, in panel 2 and 3. From top to bottom, panel 1, genetic differentiation (red dots, SNPs with FST ≥ 0.8; grey dots, FST < 0.8; black line, average FST in 5-kb sliding windows). Panel 2, genetic diversity (θ) in 20-kb (thin line) and 200-kb (thick line) windows. Panel 3, linkage disequilibrium (r2) for SNP pairs 0–600 bp apart in 100-kb windows (step size: 5 kb). Panel 4, correlation score (CS; 0–5) for genetic differentiation with circadian timing (top), circalunar timing (middle) and geographic distance (bottom) for five European C. marinus strains (Vigo, Jean, Por, He and Ber). Bottom numbers, scaffold IDs. See also Fig. 1. c, d, Locations and putative effects of SNPs (c) and indels (d) with respect to the annotated gene models. The fractions of SNPs or indels in each category are compared for all SNPs and indels (black bars) versus differentiated SNPs and indels (FST ≥ 0.8 between Por and Jean strains; grey bars). Absolute numbers are given above the bars. In gene models with several splice forms, SNPs and indels can have different effects, for example, ‘CDS, non-synonymous’ for one splice form and ‘intronic’ for another splice form. Therefore, the sum across locations is slightly larger than the actual numbers of SNPs and indels. ‘Codon changes’ are all codon insertions or deletions that do not result in frame shifts beyond the actual insertion/deletion site. CDS, coding sequence; syn., synonymous; non-syn., non-synonymous; UTR, untranslated region.
Extended Data Figure 6
Extended Data Figure 6. CaMKII regulates CLK/CYC transcriptional activity and exhibits strain-specific splice variants.
a, Quantification of luciferase activity under the control of an artificial 3X69 E-box containing enhancer in D. melanogaster S2 cells. Increasing amounts of the CaMKII inhibitor KN-93 decrease luciferase activity in a concentration-dependent manner, providing evidence that endogenous CaMKII activity regulates the transcriptional activity of D. melanogaster CLOCK-CYCLE. b, Without co-transfection of D. melanogaster clock, there is no detectable luciferase activity. The constitutively active form of CaMKII (mouse T286D) increases luciferase activity (normalized to CLOCK+; data are shown as mean ± s.e.m.; n = 4 biological replicates). c, RNA sequencing reads mapped to the CaMKII.1 genomic locus. Arrows, major differences between the strains. d, Relative expression levels of the four major CaMKII.1 transcripts (RA–RD) and the minor variant RO in the Por and Jean strains of C. marinus, as measured by qPCR (data are shown as mean ± s.e.m.; two-sided Wilcoxon rank-sum test; ***P < 0.0005; *P < 0.05; NS, not significant; Holm correction for multiple testing; biological replicates, Por n = 9, Jean n = 10; except for RO: Por n = 3, Jean n = 8). RO was not detectable in six additional biological replicates of the Por strain, suggesting that the expression differences are even greater than currently estimated. Figure 3a shows the same data, normalized to the respective Por strain variants.
Extended Data Figure 7
Extended Data Figure 7. A differentiated 125-bp insertion in the CaMKII locus.
a, Alignment of the part of the CaMKII locus of the Por and Jean strains that carries a 125-bp insertion in the Por strain. b, Pool–seq reads (>150× coverage) of this position for Por and Jean, as shown in the integrated genome viewer (IGV). The reference genome does not have the 125-bp insertion. At the position marked by the red box, the Jean strain has a 4-bp polymorphic indel (ATAC, frequently misaligned due to a SNP 8 bp downstream), whereas the Por strain has the 125-bp insertion (but not the 4-bp ATAC insertion). In Jean all reads span the indel, suggesting that if the 125-bp insertion is present in Jean at all, its frequency is very low. In contrast, in Por all reads but one end at this position, suggesting the frequency of the 125-bp insertion in Por is 154 of 155 reads or >0.99.
Extended Data Figure 8
Extended Data Figure 8. Model of circadian timing adaptation via sequence differences in the CaMKII.1 genomic locus.
Exon coloration as in Fig. 2b. The arrows with question marks indicate possible pathways that alone or in combination could mediate the effect of CaMKII.1 on timing. Dotted lines, indirect effects.
Extended Data Figure 9
Extended Data Figure 9. Analyses overview.
a, Overview of the genome assembly process. b, Overview of the population genomic analyses.
Extended Data Figure 10
Extended Data Figure 10. Arrangement of the mitochondrial genome and of the histone gene cluster in C. marinus.
a, b, mitochondrial genome (a) and histone gene cluster (b) arrangements in C. marinus. Protein-coding genes are shown in black, tRNAs and rRNAs in grey.

References

    1. Neumann D. Die lunare und tägliche Schlüpfperiodik der Mücke Clunio. Steuerung und Abstimmung auf die Gezeitenperiodik. Z. Vgl. Physiol. 1966;53:1–61.
    1. Neumann D. Temperature compensation of circasemilunar timing in the intertidal insect Clunio. J. Comp. Physiol. 1988;163:671–676.
    1. ADMIRALTY Tide Tables (UKHO, 2014)
    1. Neumann D. Genetic adaptation in emergence time of Clunio populations to different tidal conditions. Helgoländer Wiss. Meeresunters. 1967;15:163–171.
    1. Kaiser TS, Neumann D, Heckel DG. Timing the tides: genetic control of diurnal and lunar emergence times is correlated in the marine midge Clunio marinus. BMC Genet. 2011;12:49. - PMC - PubMed

Publication types

MeSH terms

Substances