

Functional characterization of thiolase-encoding genes from Xanthophyllomyces dendrorhous and their effects on carotenoid synthesis
- PMID: 27871246
- PMCID: PMC5117609
- DOI: 10.1186/s12866-016-0893-2
Functional characterization of thiolase-encoding genes from Xanthophyllomyces dendrorhous and their effects on carotenoid synthesis
Abstract
Background: The basidiomycetous yeast Xanthophyllomyces dendrorhous has been described as a potential biofactory for terpenoid-derived compounds due to its ability to synthesize astaxanthin. Functional knowledge of the genes involved in terpenoid synthesis would create opportunities to enhance carotenoid production. A thiolase enzyme catalyzes the first step in terpenoid synthesis.
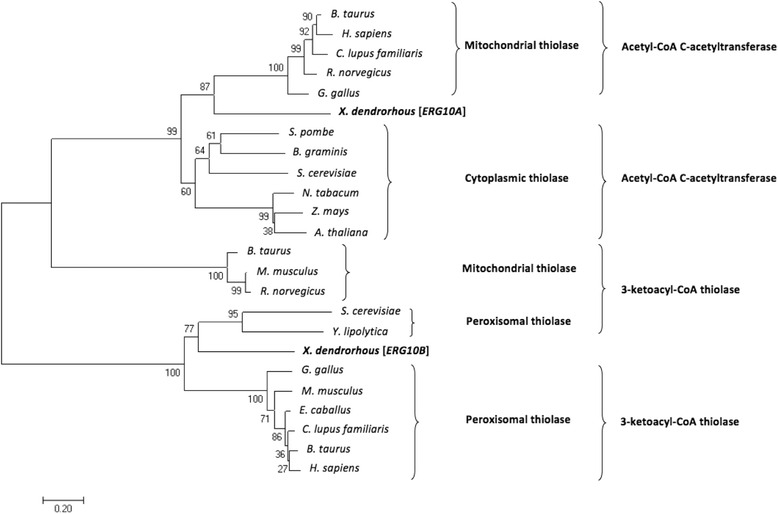
Results: Two potential thiolase-encoding genes were found in the yeast genome; bioinformatically, one was identified as an acetyl-CoA C-acetyltransferase (ERG10), and the other was identified as a 3-ketoacyl Co-A thiolase (POT1). Heterologous complementation assays in Saccharomyces cerevisiae showed that the ERG10 gene from X. dendrorhous could complement the lack of the endogenous ERG10 gene in S. cerevisiae, thereby allowing cellular growth and sterol synthesis. X. dendrorhous heterozygous mutants for each gene were created, and a homozygous POT1 mutant was also obtained. This mutant exhibited changes in pigment composition and higher ERG10 transcript levels than the wild type strain.
Conclusions: The results support the notion that the ERG10 gene in X. dendrorhous is a functional acetyl-CoA C-acetyltransferase essential for the synthesis of mevalonate in yeast. The POT1 gene would encode a functional 3-ketoacyl Co-A thiolase that is non-essential for cell growth, but its mutation indirectly affects pigment production.
Keywords: Astaxanthin; Carotenoids; Functional complementation; Mevalonate; Sterols; Thiolase.
Figures


Similar articles
-
Enhancement of astaxanthin production in Xanthophyllomyces dendrorhous by efficient method for the complete deletion of genes.Microb Cell Fact. 2016 Sep 13;15(1):155. doi: 10.1186/s12934-016-0556-x. Microb Cell Fact. 2016. PMID: 27624332 Free PMC article.
-
The Involvement of Mig1 from Xanthophyllomyces dendrorhous in Catabolic Repression: An Active Mechanism Contributing to the Regulation of Carotenoid Production.PLoS One. 2016 Sep 13;11(9):e0162838. doi: 10.1371/journal.pone.0162838. eCollection 2016. PLoS One. 2016. PMID: 27622474 Free PMC article.
-
Identification and functional characterization of the CYP51 gene from the yeast Xanthophyllomyces dendrorhous that is involved in ergosterol biosynthesis.BMC Microbiol. 2015 Apr 25;15:89. doi: 10.1186/s12866-015-0428-2. BMC Microbiol. 2015. PMID: 25906980 Free PMC article.
-
Metabolic engineering for high yield synthesis of astaxanthin in Xanthophyllomyces dendrorhous.Microb Cell Fact. 2021 Sep 6;20(1):175. doi: 10.1186/s12934-021-01664-6. Microb Cell Fact. 2021. PMID: 34488760 Free PMC article. Review.
-
Metabolic engineering of the astaxanthin-biosynthetic pathway of Xanthophyllomyces dendrorhous.FEMS Yeast Res. 2003 Dec;4(3):221-31. doi: 10.1016/S1567-1356(03)00158-2. FEMS Yeast Res. 2003. PMID: 14654426 Review.
Cited by
-
Sterol Regulatory Element-Binding Protein (Sre1) Promotes the Synthesis of Carotenoids and Sterols in Xanthophyllomyces dendrorhous.Front Microbiol. 2019 Mar 29;10:586. doi: 10.3389/fmicb.2019.00586. eCollection 2019. Front Microbiol. 2019. PMID: 30984134 Free PMC article.
-
Redirecting Metabolic Flux towards the Mevalonate Pathway for Enhanced β-Carotene Production in M. circinelloides CBS 277.49.Biomed Res Int. 2020 Dec 29;2020:8890269. doi: 10.1155/2020/8890269. eCollection 2020. Biomed Res Int. 2020. PMID: 33457420 Free PMC article.
-
Identification of Six Thiolases and Their Effects on Fatty Acid and Ergosterol Biosynthesis in Aspergillus oryzae.Appl Environ Microbiol. 2022 Mar 22;88(6):e0237221. doi: 10.1128/aem.02372-21. Epub 2022 Feb 9. Appl Environ Microbiol. 2022. PMID: 35138925 Free PMC article.
References
MeSH terms
Substances
LinkOut - more resources
Full Text Sources
Other Literature Sources
Molecular Biology Databases
