. 2016 Nov 21;10(1):37.
doi: 10.1186/s40246-016-0095-x.

Transcriptome analysis reveals manifold mechanisms of cyst development in ADPKD

Affiliations

Transcriptome analysis reveals manifold mechanisms of cyst development in ADPKD

Rita M C de Almeida et al. Hum Genomics. .

Abstract

Background: Autosomal dominant polycystic kidney disease (ADPKD) causes progressive loss of renal function in adults as a consequence of the accumulation of cysts. ADPKD is the most common genetic cause of end-stage renal disease. Mutations in polycystin-1 occur in 87% of cases of ADPKD and mutations in polycystin-2 are found in 12% of ADPKD patients. The complexity of ADPKD has hampered efforts to identify the mechanisms underlying its pathogenesis. No current FDA (Federal Drug Administration)-approved therapies ameliorate ADPKD progression.

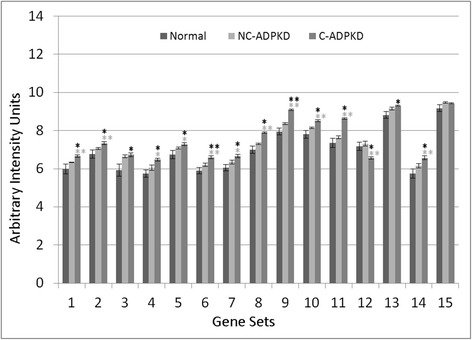
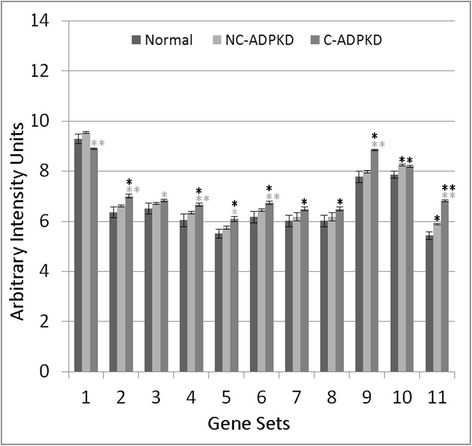
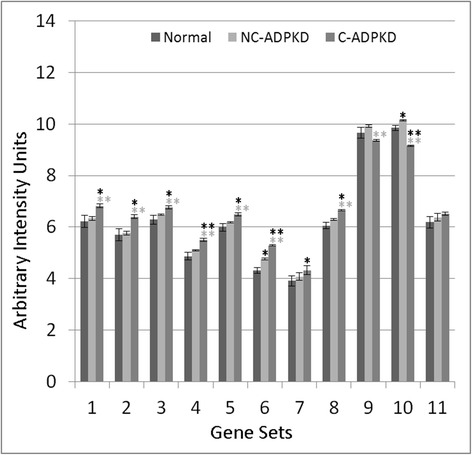
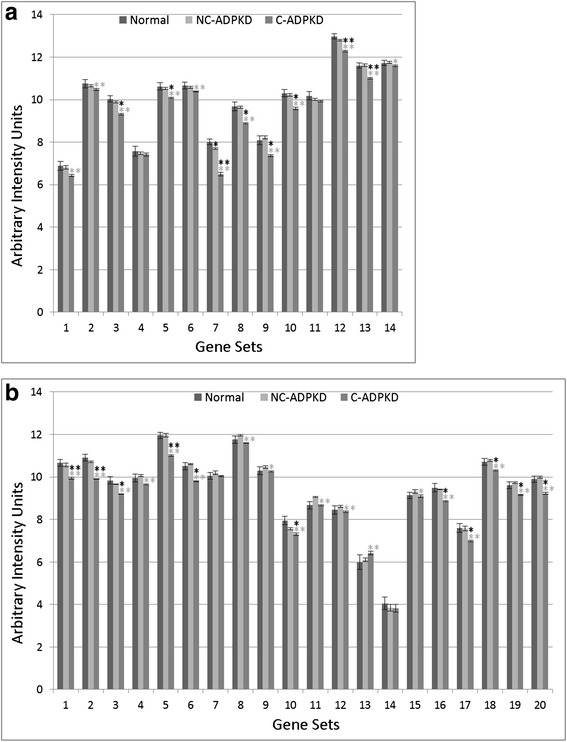
Results: We used the de Almeida laboratory's sensitive new transcriptogram method for whole-genome gene expression data analysis to analyze microarray data from cell lines developed from cell isolates of normal kidney and of both non-cystic nephrons and cysts from the kidney of a patient with ADPKD. We compared results obtained using standard Ingenuity Volcano plot analysis, Gene Set Enrichment Analysis (GSEA) and transcriptogram analysis. Transcriptogram analysis confirmed the findings of Ingenuity, GSEA, and published analysis of ADPKD kidney data and also identified multiple new expression changes in KEGG (Kyoto Encyclopedia of Genes and Genomes) pathways related to cell growth, cell death, genetic information processing, nucleotide metabolism, signal transduction, immune response, response to stimulus, cellular processes, ion homeostasis and transport and cofactors, vitamins, amino acids, energy, carbohydrates, drugs, lipids, and glycans. Transcriptogram analysis also provides significance metrics which allow us to prioritize further study of these pathways.

Conclusions: Transcriptogram analysis identifies novel pathways altered in ADPKD, providing new avenues to identify both ADPKD's mechanisms of pathogenesis and pharmaceutical targets to ameliorate the progression of the disease.

Keywords: Autosomal dominant polycystic kidney disease; Bioinformatics; Cystic kidney disease; Kidney; Pathway identification; Transcriptogram.


Figures

Fig. 1
Fig. 1
PKD1 and PKD2 gene expression in the NK, NC-ADPKD, and C-ADPKD cells. PKD1 expression is not different from normal in the NC-ADPKD and C-ADPKD cells. PKD2 expression is normal in the NC-ADPKD cells but significantly lower than normal in C-ADPKD cells. Bars show mean ± s.e., * * p < 0.01, * p < 0.05 (black asterisk is in comparison to NK, gray asterisk is in comparison to NC-ADPKD)
Fig. 2
Fig. 2
Volcano plot of single gene analysis. Plots of log P value versus log2 fold change for NC-ADPKD/NK, C-ADPKD/NK, and NC-ADPKD/C-ADPKD cells. The two vertical lines in each panel mark twofold change. Labels indicate representative genes with highly significant fold changes. See Additional file 1 for full lists of significantly changed genes
Fig. 3
Fig. 3
Term enrichment map showing the correspondence between the ordered gene list and major biological terms and pathways. The x-axis indicates the relative position in the ordered list of 9684 genes. The colored profiles give the density distributions within the list of specific GO terms or KEGG pathways. A term enrichment value of 1 on the y-axis indicates that all genes in an interval of radius r = 30 participate in a given GO term or KEGG pathway. Peaks mark regions enriched with genes related to the term or pathway indicated in the legend. The legend orders the terms/pathways from left to right
Fig. 4
Fig. 4
Relative transcriptogram for NC-ADPKD/NK. The x-axis indicates the relative positon in the ordered list of 9684 genes. Upper panel the relative transcriptograms are presented as means ± s.e.m. with NC-ADPKD (blue line ± cyan region) and NK (black line ± gray region) given relative to NK. Center panel (shaded gray): P value from a two-tailed Weyl’s t test is plotted for each point of the transcriptograms. Horizontal lines mark P = 0.05 and P = 0.01. Location in the ordered list of Pkd1 and Pkd2, the causative genes for ADPKD, is shown. Lower panel Term enrichment for transcriptogram regions with significantly changed expression. A term enrichment value of 1 on the y-axis indicates that all genes in an interval of radius r = 30 participate in a given GO term or KEGG pathway. As an example of how to read the relative transcriptogram figures, NC-ADPKD cells have higher-than-normal gene expression in the region of the peak labeled ‘cell cycle’ in the upper panel with a significance of P < 0.01 (middle panel). This region is enriched with genes associated with ‘cell cycle’ KEGG terms and GO pathways (marked with a bar and identified by referring to the lower panel, which shows term enrichment)
Fig. 5
Fig. 5
Relative transcriptogram for C-ADPKD/NK. The x-axis indicates the relative position in the ordered list of 9684 genes. Upper panel We present the relative transcriptograms as means ± s.e.m. with C-ADPKD (red line ± pink region) and NK (black line ± gray region) given relative to NK. Center panel (shaded gray): P value from a two-tailed Weyl’s t test for each point of the transcriptogram. Horizontal lines mark P = 0.05 and P = 0.01. We label the location in the ordered list of Pkd1 and Pkd2, the causative genes for ADPKD. Lower panel Term enrichment for transcriptogram regions with gene expression significantly different from normal. A term enrichment value of 1 on the y-axis indicates that all genes in an interval of radius r = 30 participate in a given GO term or KEGG pathway
Fig. 6
Fig. 6
Relative transcriptogram for C-ADPKD/NC-ADPKD. The x-axis indicates the relative positon in the ordered list of 9684 genes. Upper panel The relative transcriptograms are presented as means ± s.e.m. with C-ADPKD (red line ± pink region) and NC-ADPKD (blue line ± cyan region) relative to NC-ADPKD. Center panel (shaded gray): P value from a two tailed Weyl’s t test for each point of the transcriptogram. Horizontal lines mark P = 0.05 and P = 0.01. We label the location in the ordered list of Pkd1 and Pkd2, the causative genes for ADPKD. Lower panel: Term enrichment for transcriptogram regions with gene expression significantly different from normal. A term enrichment value of 1 on the y-axis indicates that all genes in an interval of radius r = 30 participate in a given GO term or KEGG pathway. P values between C-ADPKD and NC-ADPKD cells are smaller than between either C-ADPKD or NC-ADPKD and NK cells (see Figs. 4 and 5) because C-ADPKD and NC-ADPKD cells were derived from the same individual, allowing us to discriminate additional differentially expressed regions
Fig. 7
Fig. 7
Both cell growth and cell death are altered in ADPKD. NC-ADPKD cells have higher-than-normal expression and C-ADPKD cells have lower-than-normal expression of genes from ‘cell growth’ gene sets. Both NC-ADPKD and C-ADPKD cells have higher-than-normal expression of genes from ‘cell death’ gene sets. We present data as mean ± s.e.m., **P < 0.01, *P < 0.05 (black asterisk is in comparison to NK, gray asterisk is in comparison to NC-ADPKD). Cell Growth Gene Sets: (1) KEGG_CELL_CYCLE, (2) CELL_CYCLE, (3) CELL_CYCLE_CHECKPOINT, (4) CELL_CYCLE_PROCESS, (5) CELL_CYCLE_PHASE, (6) MITOTIC_M_PHASE, (7) MITOTIC_CELL_CYCLE, (8) M_PHASE, (9) MITOSIS. Cell Death Gene Sets: (10) KEGG_APOPTOSIS, (11) APOPTOTIC_PROCESS, (12) PROGRAMMED_CELL_DEATH
Fig. 8
Fig. 8
Genetic information processing is altered in ADPKD. NC-ADPKD cells have higher-than-normal expression and C-ADPKD cells have lower-than-normal expression of genes from all ‘Genetic information processing’ gene sets except the KEGG ribosome gene set. We present data as mean ± s.e.m., **P < 0.01, *P < 0.05 (black asterisk is in comparison to NK, gray asterisk is in comparison to NC-ADPKD). Genetic Information Processing Gene Sets: (1) KEGG_DNA_REPLICATION, (2) KEGG_BASE_EXCISION_REPAIR, (3) KEGG_NUCLEOTIDE_EXCISION_REPAIR, (4) KEGG_MISMATCH_REPAIR, (5) KEGG_HOMOLOGOUS_RECOMBINATION, (6) DNA_REPLICATION, (7) DNA_REPAIR, (8) KEGG_RNA_POLYMERASE, (9) KEGG_BASAL_TRANSCRIPTION_FACTORS, (10) KEGG_SPLICEOSOME, (11) TRANSCRIPTION, (12) REGULATION_OF_TRANSCRIPTION, (13) TRANSCRIPTION_DNA_DEPENDENT, (14) REGULATION_OF_TRANSCRIPTION_DNA_DEPENDENT, (15) TRANSCRIPTION_FROM_RNA_POLYMERASE_II_PROMOTER, (16) KEGG_RIBOSOME, (17) RIBONUCLEOPROTEIN_COMPLEX_BIOGENESIS_AND_ASSEMBLY, (18) PROTEIN_RNA_COMPLEX_ASSEMBLY, (19) MRNA_PROCESSING_GO_0006397, (20) RNA_SPLICING_VIA_TRANSESTERIFICATION_REACTIONS
Fig. 9
Fig. 9
Nucleotide metabolism is abnormal in ADPKD. NC-ADPKD cells have higher-than-normal expression and C-ADPKD cells have lower-than-normal expression of genes from all ‘Nucleotide Metabolism’ gene sets. We present data as mean ± s.e.m., **P < 0.01, *P < 0.05 (black asterisk is in comparison to NK, gray asterisk is in comparison to NC-ADPKD). Nucleotide Metabolism Gene Sets: (1) KEGG_PURINE_METABOLISM, (2) KEGG_PYRIMIDINE_METABOLISM, (3) RNA_SPLICING, (4) MRNA_METABOLIC_PROCESS, (5) NEGATIVE_REGULATION_OF_TRANSCRIPTION, (6) REGULATION OF NUCLEOBASE_NUCLEOSIDE_NUCLEOTIDE_AND_NUCLEIC_ACID_METABOLIC_PROCESS, (7) RNA_BIOSYNTHETIC_PROCESS, (8) NEGATIVE_REGULATION_OF NUCLEOBASE_NUCLEOSIDE_NUCLEOTIDE_AND_NUCLEIC_ACID_METABOLIC_PROCESS, (9) CHROMOSOME_ORGANIZATION_AND_BIOGENESIS, (10) DNA_METABOLIC_PROCESS
Fig. 10
Fig. 10
ADPKD upregulates signal transduction. NC-ADPKD and C-ADPKD cells have higher-than-normal expression of genes from all signal transduction gene sets. Expression levels in NC-ADPKD cells are intermediate between those of NK and C-ADPKD cells, exception that expression levels of Wnt and Notch signaling pathways are higher in NC-ADPKD cells. These pathways are normally active primarily during embryonic development. We present data as mean ± s.e.m., **P < 0.01, *P < 0.05 (black asterisk is in comparison to NK, gray asterisk is in comparison to NC-ADPKD). Signal Transduction Gene Sets: (1) G_PROT._COUPLED_RECEPTOR_PROTEIN_SIGNALING, (2) G_PROT._SIGNALING_COUPLED_TO_CYCLIC_NUCLEOTIDE_2ND_MESS, (3) G_PROT._SIGNALING_COUPLED_TO_CAMP_NUCLEOTIDE_2ND_MESS, (4) G_PROT._SIGNALING_ADENYLATE_CYCLASE_ACTIVATING, (5) CAMP_MEDIATED_SIGNALING, (6) CELL_CELL_SIGNALING, (7) SYNAPTIC_TRANSMISSION, (8) CYCLIC_NUCLEOTIDE_MEDIATED_SIGNALING, (9) KEGG_CYTOKINE_CYTOKINE_RECEPTOR_INTERACTION, (10) KEGG_NEUROACTIVE_LIGAND_RECEPTOR_INTERACTION, (11) KEGG_ERBB_SIGNALING_PATHWAY, (12) KEGG_WNT_SIGNALING_PATHWAY, (13) KEGG_NOTCH_SIGNALING_PATHWAY, (14) KEGG_CALCIUM_SIGNALING_PATHWAY, (15) KEGG_JAK_STAT_SIGNALING_PATHWAY, (16) KEGG_ABC_TRANSPORTERS
Fig. 11
Fig. 11
Immune response is abnormal in ADPKD. NC-ADPKD and C-ADPKD cells both express higher-than-normal levels of genes from ‘immune response’ gene sets, exception that C-ADPKD cells have lower-than-normal expression of the KEGG ‘Complement and Coagulation cascade’ gene set (12). We present data as mean ± s.e.m., **P < 0.01, *P < 0.05 (black asterisk is in comparison to NK, gray asterisk is in comparison to NC-ADPKD). Immune Response Gene Sets: (1) INFLAMMATORY_RESPONSE, (2) IMMUNE_RESPONSE, (3) HUMORAL_IMMUNE_RESPONSE, (4) CELL_ACTIVATION, (5) IMMUNE_SYSTEM_PROCESS, (6) LEUKOCYTE_ACTIVATION, (7) LYMPHOCYTE_ACTIVATION, (8) KEGG_CHEMOKINE_SIGNALING_PATHWAY, (9) KEGG_NOD_LIKE_RECEPTOR_SIGNALING_PATHWAY, (10) KEGG_T_CELL_RECEPTOR_SIGNALING_PATHWAY, (11) KEGG_LEUKOCYTE_TRANSENDOTHELIAL_MIGRATION, (12) KEGG_COMPLEMENT_AND_COAGULATION_CASCADES, (13) KEGG_CYTOSOLIC_DNA_SENSING_PATHWAY, (14) KEGG_HEMATOPOIETIC_CELL_LINEAGE, (15) KEGG_FC_GAMMA_R_MEDIATED_PHAGOCYTOSIS
Fig. 12
Fig. 12
Response to stimulus and cellular processes are abnormal in ADPKD. Both NC-ADPKD and C-ADPKD cells have higher-than-normal expression of genes in the ‘response to stimulus’ gene sets (1–8), except that C-ADPKD cells have lower-than-normal expression of genes in the ‘response to endogenous stimulus’ gene set. C-ADPKD cells have higher-than-normal expression of genes in the ‘cellular processes’ gene sets (9–11). Data are represented as mean ± s.e.m., **P < 0.01, *P < 0.05 (black asterisk is in comparison to NK, gray asterisk is in comparison to NC-ADPKD). Response to Stimulus Gene Sets: (1) RESPONSE_TO_ENDOGENOUS_STIMULUS, (2) RESPONSE_TO_EXTERNAL_STIMULUS, (3) REGULATION_OF_RESPONSE_TO_STIMULUS, (4) DEFENSE_RESPONSE, (5) CELLULAR_DEFENSE_RESPONSE, (6) RESPONSE_TO_WOUNDING, (7) COAGULATION, (8) BLOOD_COAGULATION. Cellular Processes Gene Sets: (9) KEGG_TIGHT_JUNCTION, (10) KEGG_GAP_JUNCTION, (11) LOCOMOTORY_BEHAVIOR
Fig. 13
Fig. 13
Ion homeostasis and transport are abnormal in ADPKD. NC-ADPKD cells have higher-than-normal and C-ADPKD cells have much higher-than-normal expression of genes in ‘ion homeostasis’ gene sets (1–8). NC-ADPKD cells have higher-than-normal expression of genes in ‘transport’ gene sets (9–11). We represent data as mean ± s.e.m, **P < 0.01, *P < 0.05 (black asterisk is in comparison to NK, gray asterisk is in comparison to NC-ADPKD). Ion Homeostasis Gene Sets: (1) ION_HOMEOSTASIS, (2) CELLULAR_CATION_HOMEOSTASIS, (3) ION_TRANSPORT, (4) METAL_ION_TRANSPORT, (5) CATION_TRANSPORT, (6) POTASSIUM_ION_TRANSPORT, (7) CALCIUM_ION_TRANSPORT, (8) MONOVALENT_INORGANIC_CATION_TRANSPORT. Transport Gene Sets: (9) KEGG_VASOPRESSIN_REGULATED_WATER_REABSORPTION, (10) KEGG_PROXIMAL_TUBULE_BICARBONATE_RECLAMATION, (11) REGULATION_OF_BODY_FLUID_LEVELS
Fig. 14
Fig. 14
ADPKD broadly perturbs metabolism. a Cofactor and vitamin, amino acid, and energy metabolism and b carbohydrate, drug, lipid, and glycan metabolism. C-ADPKD cells have lower-than-normal expression of genes in ‘cofactor and vitamin’ gene sets (A1-2) compared to both NK and NC-ADPKD cells. Both NC-ADPKD and C-ADPKD cells have lower-than-normal expression of genes in ‘amino acid’ gene sets (A3-11). C-ADPKD cells have lower-than-normal expression of genes in ‘energy metabolism’ gene sets (A12-14). C-ADPKD cells have lower-than-normal expression of genes in all ‘carbohydrate metabolism’ gene sets (B1-9) except for the KEGG ‘histidine metabolism’ gene set. C-ADPKD cells have lower-than-normal expression of genes in the ‘drug metabolism’ gene set (B10). C-ADPKD cells have lower-than-normal expression of genes in all ‘lipid metabolism’ (B11-18) gene sets except for the KEGG ‘arachidonic acid metabolism’ gene set (B13). C-ADPKD cells have lower-than-normal expression of genes in ‘glycan metabolism’ gene sets (B19-20). We present data as mean ± s.e.m., **P < 0.01, *P < 0.05 (black asterisk is in comparison to NK, gray asterisk is in comparison to NC-ADPKD). a Cofactor and vitamin, amino acid, and energy metabolism gene sets. Cofactor and Vitamin Gene Sets: (1) KEGG_RETINOL_METABOLISM, (2) KEGG_PORPHYRIN_AND_CHLOROPHYLL_METABOLISM. Amino Acid Metabolism Gene Sets: (3) KEGG_ALANINE_ASPARTATE_AND_GLUTAMATE_METABOLISM, (4) KEGG_GLYCINE_SERINE_AND_THREONINE_METABOLISM, (5) KEGG_VALINE_LEUCINE_AND_ISOLEUCINE_DEGRADATION, (6) KEGG_ARGININE_AND_PROLINE_METABOLISM, (7) KEGG_HISTIDINE_METABOLISM, (8) KEGG_TRYPTOPHAN_METABOLISM, (9) KEGG_BETA_ALANINE_METABOLISM, (10) KEGG_SELENOAMINO_ACID_METABOLISM, (11) KEGG_GLUTATHIONE_METABOLISM. Energy Metabolism Gene Sets: (12) KEGG_OXIDATIVE_PHOSPHORYLATION, (13) MITOCHONDRIAL_TRANSPORT, (14) MITOCHONDRION_ORGANIZATION_AND_BIOGENESIS. b Carbohydrate, drug, lipid and glycan metabolism gene sets. Carbohydrate Metabolism Gene Sets: (1) KEGG_GLYOXYLATE_AND_DICARBOXYLATE_METABOLISM, (2) KEGG_PROPANOATE_METABOLISM, (3) KEGG_BUTANOATE_METABOLISM (4) KEGG_GLYCOLYSIS_GLUCONEOGENESIS, (5) KEGG_CITRATE_CYCLE_TCA_CYCLE, (6) KEGG_PYRUVATE_METABOLISM, (7) KEGG_FRUCTOSE_AND_MANNOSE_METABOLISM, (8) KEGG_GALACTOSE_METABOLISM, (9) KEGG_AMINO_SUGAR_AND_NUCLEOTIDE_SUGAR_METABOLISM. Drug Metabolism Gene Sets; (10) KEGG_DRUG_METABOLISM_CYTOCHROME_P450. Lipid Metabolism Gene Sets: (11) KEGG_GLYCEROLIPID_METABOLISM, (12) KEGG_GLYCEROPHOSPHOLIPID_METABOLISM, (13) KEGG_ARACHIDONIC_ACID_METABOLISM, (14) KEGG_LINOLEIC_ACID_METABOLISM, (15) KEGG_SPHINGOLIPID_METABOLISM, (16) KEGG_FATTY_ACID_METABOLISM, (17) KEGG_STEROID_HORMONE_BIOSYNTHESIS, (18) PHOSPHOLIPID_BIOSYNTHETIC_PROCESS. Glycan Metabolism Gene Sets: (19) KEGG_N_GLYCAN_BIOSYNTHESIS, (20) KEGG_GLYCOSYLPHOSPHATIDYLINOSITOL_GPI_ANCHOR_BIOSYNTHESIS
Fig. 15
Fig. 15
Comparisons of individual gene expression levels for genes selected from differentially expressed gene sets. a NOD-like receptor signaling, b potassium ion transport, and c oxidative phosphorylation. To simplify presentation of these gene sets, where we used two or more probes in the microarray for a single gene, we give mean values and mark the gene names with an “asterisk”. Within gene sets, we can discern changes in individual genes responsible for differential expression of the pathways. We present data as mean ± s.e.m., **P < 0.01, *P < 0.05 (black asterisk is in comparison to NK, gray asterisk is in comparison to NC-ADPKD). Additional file 4 provides additional information on each gene

Similar articles

Cited by

References

    1. Torres VE, Harris PC, Pirson Y. Autosomal dominant polycystic kidney disease. Lancet. 2007;369(9569):1287–301. doi: 10.1016/S0140-6736(07)60601-1. - DOI - PubMed
    1. Santoro D, Pellicanò V, Visconti L, Trifirò G, Buemi M, Cernaro V. An overview of experimental and early investigational therapies for the treatment of polycystic kidney disease. Expert Opin Investig Drugs. 2015;24(9):1199–218. doi: 10.1517/13543784.2015.1059421. - DOI - PubMed
    1. Qian F, Germino FJ, Cai Y, Zhang X, Somlo S, Germino GG. PKD1 interacts with PKD2 through a probable coiled-coil domain. Nat Genetics. 1997;16(2):179–83. doi: 10.1038/ng0697-179. - DOI - PubMed
    1. Yoder BK, Hou X, Guay-Woodford LM. The polycystic kidney disease proteins, polycystin-1, polycystin-2, polaris, and cystin, are co-localized in renal cilia.[see comment] J Am Soc Nephrol. 2002;13(10):2508–16. doi: 10.1097/01.ASN.0000029587.47950.25. - DOI - PubMed
    1. Gainullin VG, Hopp K, Ward CJ, Hommerding CJ, Harris PC. Polycystin-1 maturation requires polycystin-2 in a dose-dependent manner. J Clin Invest. 2015;125(2):607–20. doi: 10.1172/JCI76972. - DOI - PMC - PubMed

Publication types

Substances