. 2017 Feb 1:146:355-366.
doi: 10.1016/j.neuroimage.2016.11.041. Epub 2016 Nov 19.

Linking canonical microcircuits and neuronal activity: Dynamic causal modelling of laminar recordings

Affiliations

Linking canonical microcircuits and neuronal activity: Dynamic causal modelling of laminar recordings

D A Pinotsis et al. Neuroimage. .

Abstract

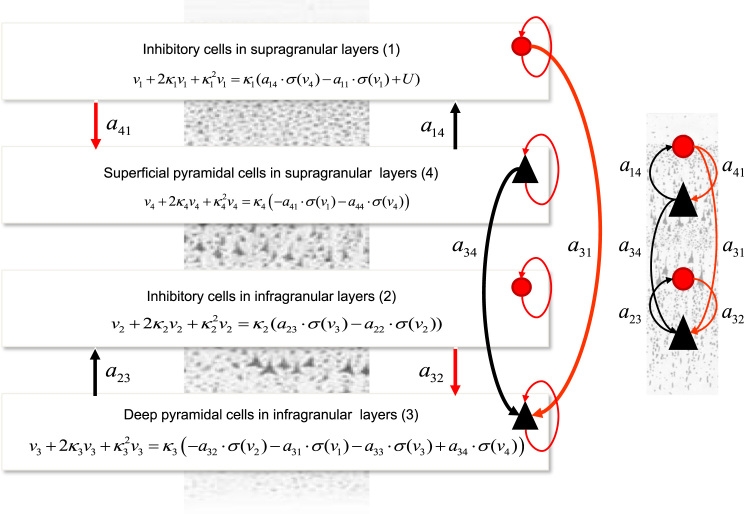
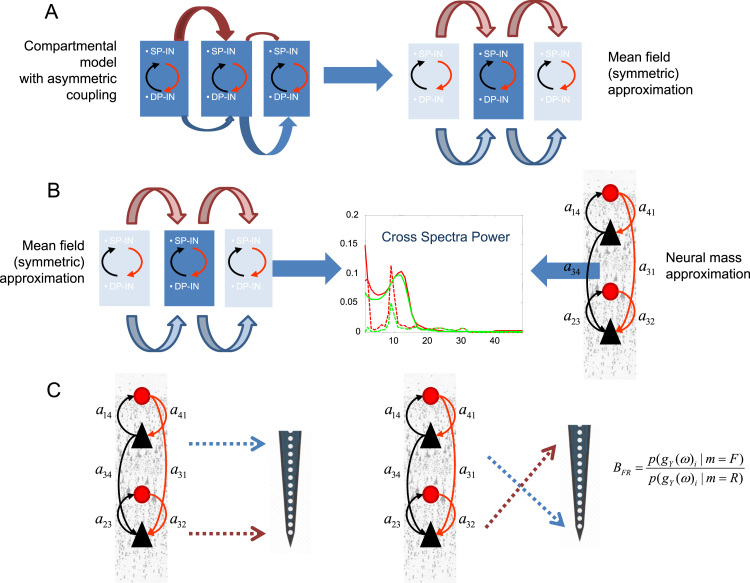
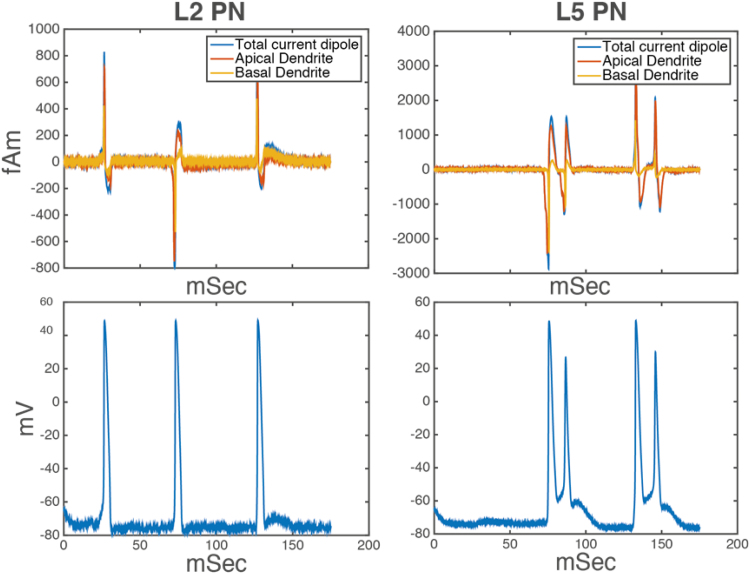
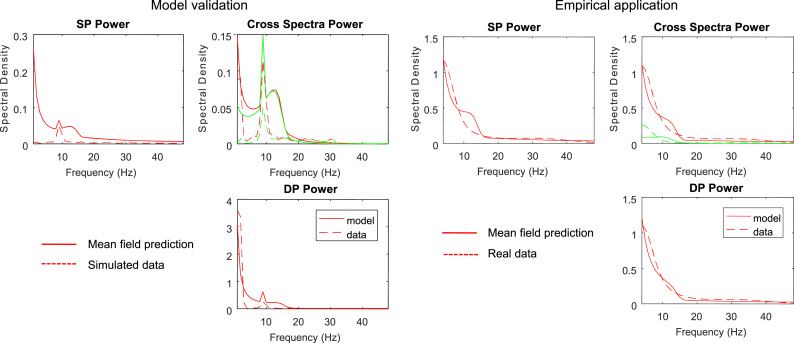
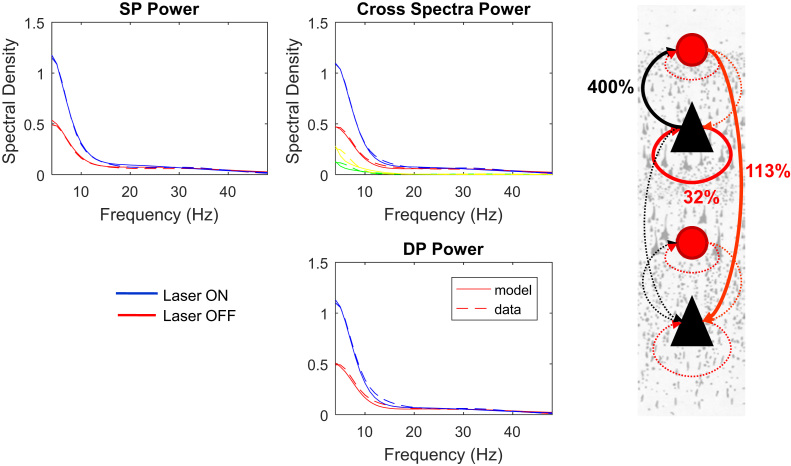
Neural models describe brain activity at different scales, ranging from single cells to whole brain networks. Here, we attempt to reconcile models operating at the microscopic (compartmental) and mesoscopic (neural mass) scales to analyse data from microelectrode recordings of intralaminar neural activity. Although these two classes of models operate at different scales, it is relatively straightforward to create neural mass models of ensemble activity that are equipped with priors obtained after fitting data generated by detailed microscopic models. This provides generative (forward) models of measured neuronal responses that retain construct validity in relation to compartmental models. We illustrate our approach using cross spectral responses obtained from V1 during a visual perception paradigm that involved optogenetic manipulation of the basal forebrain. We find that the resulting neural mass model can distinguish between activity in distinct cortical layers - both with and without optogenetic activation - and that cholinergic input appears to enhance (disinhibit) superficial layer activity relative to deep layers. This is particularly interesting from the perspective of predictive coding, where neuromodulators are thought to boost prediction errors that ascend the cortical hierarchy.


Figures

Fig. 1
Fig. 1
The Bush and Sejnowski (neural mass or mean field) model. This figure shows the evolution equations that specify a neural mass model of a single cortical microcircuit source. This model contains four populations occupying different cortical layers: the pyramidal cell population of the Jansen and Rit model is here split into two subpopulations allowing a separation of the sources of forward and backward connections in cortical hierarchies. Firing rates within each sub-population provide inputs to other populations and convolution of presynaptic activity produces postsynaptic depolarization. We consider separate time series of activity from superficial and deep populations as opposed to usual treatments that use weighted sums of activity from all subpopulations. Here red denotes inhibitory populations and connections, while black denotes excitatory cells and connections. Note that all recurrent or self connections are inhibitory.
Fig. 2
Fig. 2
Schematic of the validation steps. A. We first establish the functional equivalence between the model of Jones et al. (2007) and its symmetric variant. Here horizontal arrows of different widths in the left panel denote asymmetric connectivities and delays between mini-columns depicted as rectangles containing Superficial and Deep Pyramidal cells (SP and DP) and Inhibitory Interneurons (II). In the right panel a symmetrisation of the model reveals a setup similar to one considered in mean field (neural mass) models B. We then demonstrate the construct validity of the corresponding mass model in relation to mean field model above. This is achieved by fitting the model to synthetic data obtained from its compartmental homologue. C. Finally, we show how this model can distinguish between superficial and deep responses obtained with laminar probes and consider the concomitant changes in model parameters with and without optogenetic manipulation. We exploit Bayesian model selection and compute the relative log-evidence for plausible (left) and implausible (right) experimental setups, where the probes of laminar sensors are considered in right and reversed locations, see the Results section.
Fig. 3
Fig. 3
(Top) Simulated evoked responses of (left) the model used in Jones et al. (2007); (right) its symmetric variant. (Bottom) Contributions to the net dipole per layer for the same models; see Jones et al. (2007) for the corresponding results for the original model.
Fig. 4
Fig. 4
Activity of both PNs in the symmetric model. The top row shows the current dipoles of L2 and L5 neurons. The bottom row shows voltage responses; see Jones et al. (2007) for the corresponding results under the original (compartmental) model.
Fig. 5
Fig. 5
Left panel: Cross spectral density data from superficial and deep populations of the compartmental (Jones et al., 2007) model and model fits using its neural mass homologue. Model predictions are shown with solid lines and simulated data with dashed lines. Note the peaked responses at 10 Hz that are reminiscent of spiking burst input that are also captured by the mean field model responses. Right panel: Exemplar spectral responses and model fits obtained during the visual perception paradigm of (Pinto et al. 2013) from pairs of superficial and deep contacts across the thin laminar probe. These used bipolar data from V1 during optogenetic stimulation of the basal forebrain. Solid and dashed lines represent model fits and data. Red and green curves correspond to the real and imaginary parts of the cross spectral density respectively.
Fig. 6
Fig. 6
Left panel: Cross spectral density data responses and model fits obtained during the visual perception paradigm of (Pinto et al. 2013) from pairs of superficial and deep contacts across the thin laminar probe for Laser ON and Laser OFF conditions. This figure follows the format of the Right Panel of Fig. 5. Green and yellow curves correspond to imaginary parts of the cross spectral density for Laser OFF and Laser ON conditions respectively Right panel: Conditional parameter estimates and their trial specific changes: maximum a posteriori estimates of changes in coupling obtained after inverting data acquired with and without cholinergic stimulation are shown by the connections in question (using the same format as the insert in Fig. 1). Note the disinhibition of the superficial pyramidal cell population due to a decrease of inhibitory connectivity and the increase of the corresponding inhibitory influence on deep pyramidal cell populations. Of the ten intrinsic connections (see Fig. 1) we model condition specific changes in three (solid lines). The remaining connections were assumed to have the same values under both conditions, with prior expectations based upon the analysis of the compartmental model (dotted lines).

References

    1. Afraimovich V., Chazottes J.R., Cordonet A. Synchronization in directionally coupled systems: some rigorous results. Discrete Contin. Dyn. Syst. Ser. B. 2001;1:421–442.
    1. Alitto H.J., Dan Y. Cell-type-specific modulation of neocortical activity by basal forebrain input. Front. Syst. Neurosci. 2012:6. - PMC - PubMed
    1. Andersen P., Andersson S.A. Plenum Publishing Corporation; 1968. Physiological Basis of the Alpha Rhythm.
    1. Auksztulewicz R., Friston K. Attentional enhancement of auditory mismatch responses: a DCM/MEG study. Cereb. Cortex. 2015;bhu3:23. - PMC - PubMed
    1. Balaram P., Kaas J.H. Towards a unified scheme of cortical lamination for primary visual cortex across primates: insights from NeuN and VGLUT2 immunoreactivity. Front. Neuroanat. 2014:8. - PMC - PubMed

LinkOut - more resources