. 2017 Jan;58(1):60-71.
doi: 10.1194/jlr.M072421. Epub 2016 Nov 21.

Cytotoxic 1-deoxysphingolipids are metabolized by a cytochrome P450-dependent pathway

Affiliations

Cytotoxic 1-deoxysphingolipids are metabolized by a cytochrome P450-dependent pathway

Irina Alecu et al. J Lipid Res. 2017 Jan.

Abstract

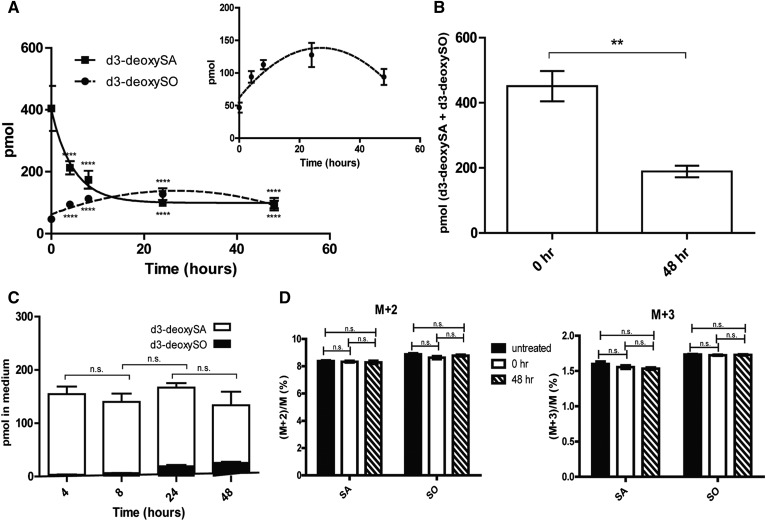
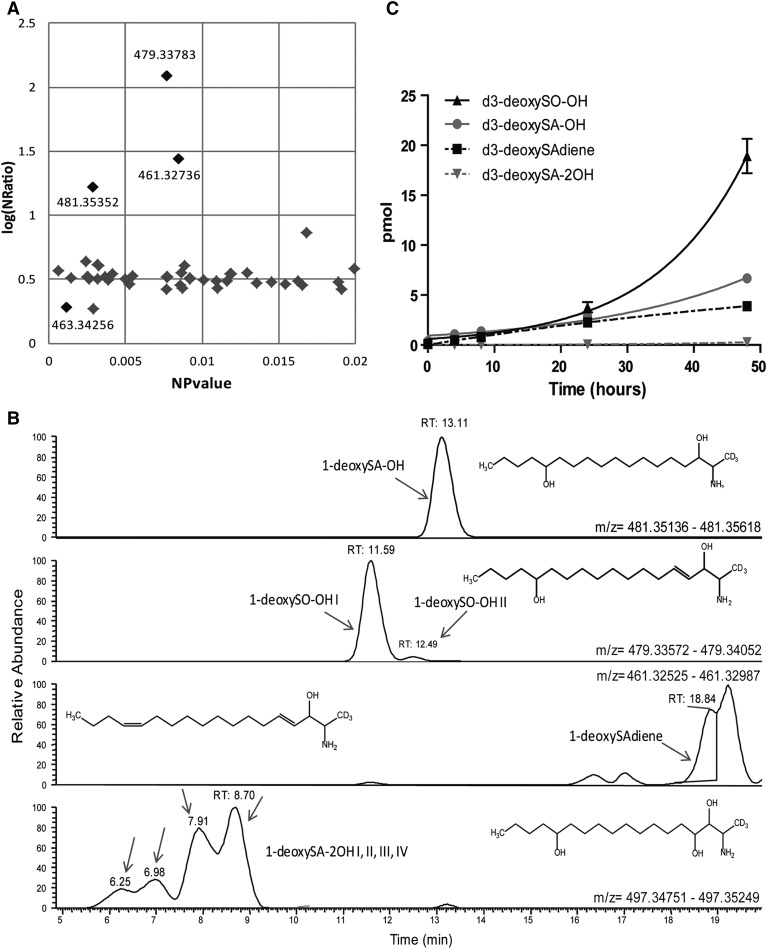
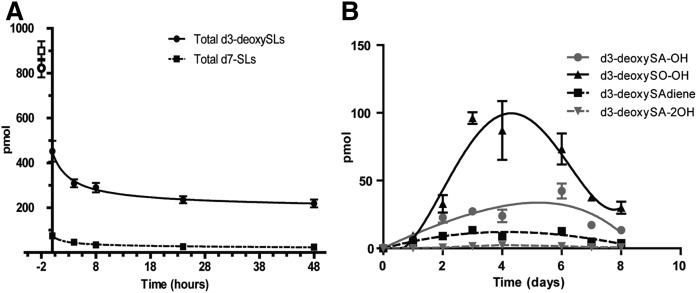
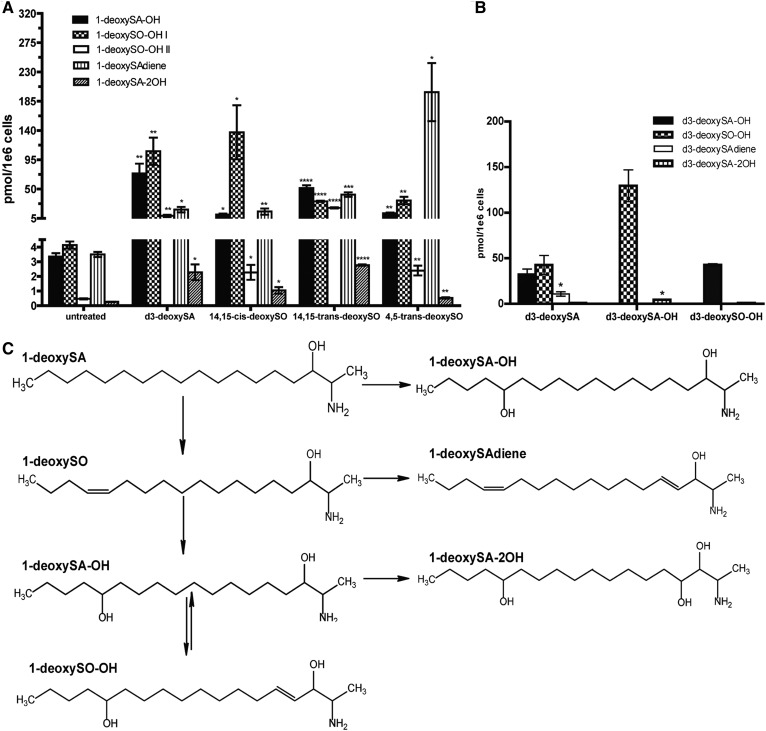
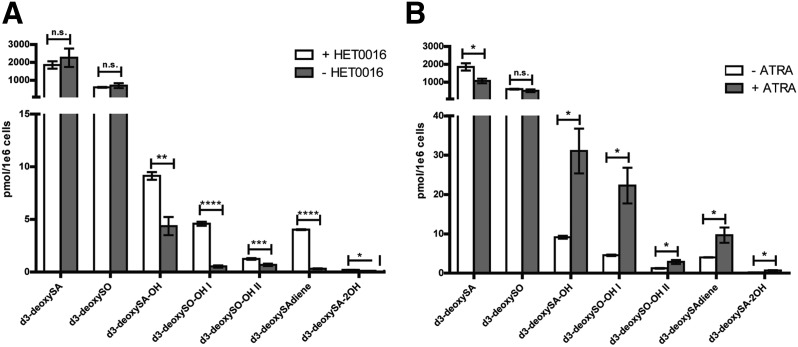
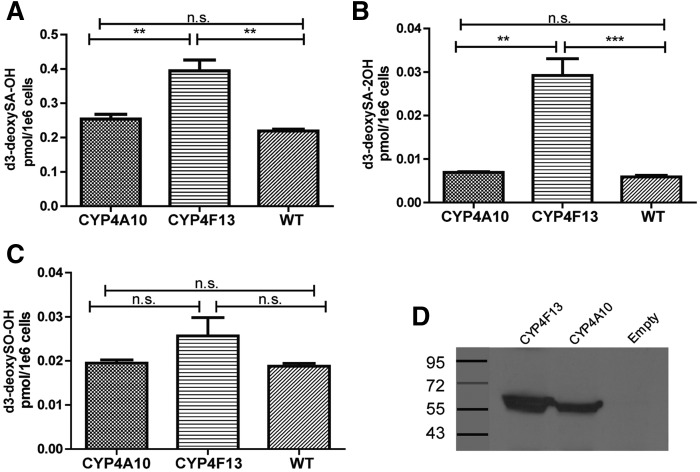
The 1-deoxysphingolipids (1-deoxySLs) are atypical sphingolipids (SLs) that are formed when serine palmitoyltransferase condenses palmitoyl-CoA with alanine instead of serine during SL synthesis. The 1-deoxySLs are toxic to neurons and pancreatic β-cells. Pathologically elevated 1-deoxySLs cause the inherited neuropathy, hereditary sensory autonomic neuropathy type 1 (HSAN1), and are also found in T2D. Diabetic sensory polyneuropathy (DSN) and HSAN1 are clinically very similar, suggesting that 1-deoxySLs may be implicated in both pathologies. The 1-deoxySLs are considered to be dead-end metabolites, as they lack the C1-hydroxyl group, which is essential for the canonical degradation of SLs. Here, we report a previously unknown metabolic pathway, which is capable of degrading 1-deoxySLs. Using a variety of metabolic labeling approaches and high-resolution high-accuracy MS, we identified eight 1-deoxySL downstream metabolites, which appear to be formed by cytochrome P450 (CYP)4F enzymes. Comprehensive inhibition and induction of CYP4F enzymes blocked and stimulated, respectively, the formation of the downstream metabolites. Consequently, CYP4F enzymes might be novel therapeutic targets for the treatment of HSAN1 and DSN, as well as for the prevention of T2D.

Keywords: diabetes; lipids/chemistry; mass spectrometry; metabolic pathway; neurotoxicity; obesity; sphingolipids.


Figures

Fig. 1.
Fig. 1.
Total levels of d3-labeled 1-deoxySLs decrease over a 48 h chase period. A: MEFs were treated with a 2 h pulse of d3-deoxySA followed by a chase with unsupplemented growth medium; time point 0 represents the start of the chase period. The levels of d3-deoxySA decreased over the duration of the chase, while d3-deoxySO increased up to 24 h and then also decreased (after acid/base hydrolysis). Inlay is a magnified version of the d3-deoxySO levels over time. Statistical significance for the difference in the levels of d3-deoxySA and d3-deoxySO at each time point when compared with time point 0 was calculated using a one-way ANOVA with a Bonferroni correction for comparing selected pairs. B: Total d3-deoxySA + d3-deoxySO levels decreased by a factor of 2 between the 0 and 48 h time points of the chase. C: The growth medium was collected at all time points of the chase and the lipids were extracted. The total levels of d3-labeled deoxysphingoid bases (d3-deoxySA + d3-deoxySO) in the medium did not change over time. D: The ratio of (M+2)/M and (M+3)/M SA and SO, where M is the mass of the canonical unlabeled sphingoid bases, were unchanged between the 0 and 48 h time points of the chase, as well as when compared with untreated control cells. Points and bars represent averages ± SEM. Statistical significance was calculated using a one-way ANOVA followed by Bonferroni correction. **P < 0.01, ****P < 0.0001; n.s., not significant.
Fig. 2.
Fig. 2.
Identification of eight novel 1-deoxySL metabolites that increase over time. A: Differential analysis using Sieve was performed for all metabolites between the 0 and 48 h time points of the chase in unsupplemented growth medium, after a 2 h pulse with d3-deoxySA. The volcano plot indicates all components identified with an m/z between 400 and 510, ratio >1, and P value <0.02. The P value and ratio shown are after normalization to the spiked internal standard d7-SA. The three black dots in the upper left indicate the metabolites with the greatest change in levels (these also had odd masses that could have a d3 label). B: Extracted ion chromatograms from the 48 h time point of the masses that passed the applied filtering criteria, as well as an additional mass (497.34838) identified by visual scanning of the total ion chromatogram. The structures were deduced after generating the chemical formula from the accurate mass (the conjugated OPA group is not shown for clarity). Note that the exact positions of the OH groups (except at C3) and the DBs along the carbon chain are unknown. The retention time of each metabolite on a C18 reverse phase column is indicated. The labeling of the individual 1-deoxySO-OH (I and II) and 1-deoxySA-2OH (I, II, III, and IV) peaks refers to the different retention times. C: Levels of all of the newly identified d3-labeled metabolites increased over the 48 h chase period. Data are represented as mean ± SEM.
Fig. 3.
Fig. 3.
The metabolic conversion of 1-deoxySLs is slower than for canonical SLs. A: MEFs were treated with either 1 μM d7-SA or d3-deoxySA for a 2 h pulse, followed by a chase period in unsupplemented growth medium up to 48 h. The pulse medium was also collected and the d7-SA and d3-deoxySA content was measured. The total d3-labeled 1-deoxySLs (including the new metabolites) decreased over the chase period, although less than the d7-labeled canonical SLs did. While the total d7-labeled SLs were already much lower at time point 0, this was not a function of availability of the labeled lipids, as can be seen by the points at −2 h, which represent the total amount of d3-deoxySA and d7-SA in the pulse medium. B: MEFs were treated with a 2 h pulse of d3-deoxySA, followed by a chase period up to 8 days in unsupplemented growth medium. All of the d3-deoxySL metabolites increased until 4–6 days, and then drastically decreased by the final time point at 8 days. Data are represented as mean ± SEM.
Fig. 4.
Fig. 4.
All identified 1-deoxySL metabolites are produced downstream of 1-deoxySO and form a branched pathway. A: MEF cells were treated with d3-deoxySA, 14,15-cis-1-deoxySO, 14,15-trans-1-deoxySO, and 4,5-trans-1-deoxySO for 48 h (indicated along the x axis) and the resulting 1-deoxySL downstream metabolites were measured by LC/MS (d3-labeled for the d3-deoxySA treated condition and unlabeled for the other conditions; indicated by the different patterns). All metabolites were significantly increased compared with untreated controls upon treatment with any of the 1-deoxySO isomers. Statistical significance was calculated for individual metabolites arising from each treatment versus untreated controls using the Student’s t-test. B: MEF cells were treated with isolated d3-deoxySA, d3-deoxySA-OH, and d3-deoxySO-OH (a mix of both I and II; indicated along the x axis) for 48 h, and the resulting downstream d3-labeled 1-deoxySL metabolites were measured by LC/MS (indicated by the different patterns). The amounts of each downstream metabolite produced from the different treatments were compared in pairs and significance was calculated using the Student’s t-test. C: Proposed metabolic pathway order. All bars represent averages ± SEM. *P < 0.05, **P < 0.01, ***P < 0.001, ****P < 0.0001.
Fig. 5.
Fig. 5.
Inhibition of CYP4F enzymes decreases the formation of the downstream d3-deoxySL metabolites, while induction of these enzymes increases their levels. Cells were treated with d3-deoxySA (1 μM) and either the inhibitor HET0016 (5 μM) or ATRA (20 μM) for 24 h, after which the d3-deoxySLs were extracted and quantified by LC/MS. A: While the differences in d3-deoxySA and d3-deoxySO were not significant between controls and HET0016 treatment, the downstream d3-deoxySL metabolites were significantly decreased in the presence of the inhibitor. B: The d3-deoxySA was significantly lower in the ATRA-treated cells, while the downstream metabolites were all significantly and drastically increased. Statistical significance of the differences between untreated and treated cells was calculated using the Student’s t-test. Bars represent averages ± SEM. *P < 0.05, **P < 0.01; n.s., not significant. See also supplemental Figs. S3, S4.
Fig. 6.
Fig. 6.
Levels of d3-deoxySA-OH and d3-deoxySA-2OH significantly increase upon overexpression of Cyp4f13. HEK WT cells or HEK cells overexpressing either mouse Cyp4a10 or Cyp4f`13 were treated with d3-deoxySA for 48 h, and the d3-labeled 1-deoxySL downstream metabolites were measured by LC/MS. Levels of d3-deoxySA-OH (A) and d3-deoxySA-2OH (B) were significantly higher in Cyp4f13-overexpressing cells. Levels of d3-deoxySO-OH (C) did not differ between the three cell lines. The sum of all four d3-deoxySA-2OH peaks and both d3-deoxySO-OH peaks is shown. D: Western blot of CYP4F13 and CYP4A10 expression. Bars represent averages ± SEM. Statistical significance was calculated using one-way ANOVA followed by Bonferroni correction. **P < 0.01, ***P < 0.001; n.s., not significant.

References

    1. Weiss B., and Stoffel W.. 1997. Human and murine serine-palmitoyl-CoA transferase–cloning, expression and characterization of the key enzyme in sphingolipid synthesis. Eur. J. Biochem. 249: 239–247. - PubMed
    1. Hanada K., Hara T., Nishijima M., Kuge O., Dickson R. C., and Nagiec M. M.. 1997. A mammalian homolog of the yeast LCB1 encodes a component of serine palmitoyltransferase, the enzyme catalyzing the first step in sphingolipid synthesis. J. Biol. Chem. 272: 32108–32114. - PubMed
    1. Buede R., Rinkerschaffer C., Pinto W. J., Lester R. L., and Dickson R. C.. 1991. Cloning and characterization of Lcb1, a Saccharomyces gene required for biosynthesis of the long-chain base component of sphingolipids. J. Bacteriol. 173: 4325–4332. - PMC - PubMed
    1. Penno A., Reilly M. M., Houlden H., Laura M., Rentsch K., Niederkofler V., Stoeckli E. T., Nicholson G., Eichler F., Brown R. H. Jr., et al. . 2010. Hereditary sensory neuropathy type 1 is caused by the accumulation of two neurotoxic sphingolipids. J. Biol. Chem. 285: 11178–11187. - PMC - PubMed
    1. Zitomer N. C., Mitchell T., Voss K. A., Bondy G. S., Pruett S. T., Garnier-Amblard E. C., Liebeskind L. S., Park H., Wang E., Sullards M. C., et al. . 2009. Ceramide synthase inhibition by fumonisin B1 causes accumulation of 1-deoxysphinganine: a novel category of bioactive 1-deoxysphingoid bases and 1-deoxydihydroceramides biosynthesized by mammalian cell lines and animals. J. Biol. Chem. 284: 4786–4795. - PMC - PubMed

Publication types

MeSH terms

LinkOut - more resources