. 2017 Jan 13;292(2):597-610.
doi: 10.1074/jbc.M116.747485. Epub 2016 Nov 21.

Biophysical Evidence for Intrinsic Disorder in the C-terminal Tails of the Epidermal Growth Factor Receptor (EGFR) and HER3 Receptor Tyrosine Kinases

Affiliations

Biophysical Evidence for Intrinsic Disorder in the C-terminal Tails of the Epidermal Growth Factor Receptor (EGFR) and HER3 Receptor Tyrosine Kinases

Theodore R Keppel et al. J Biol Chem. .

Abstract

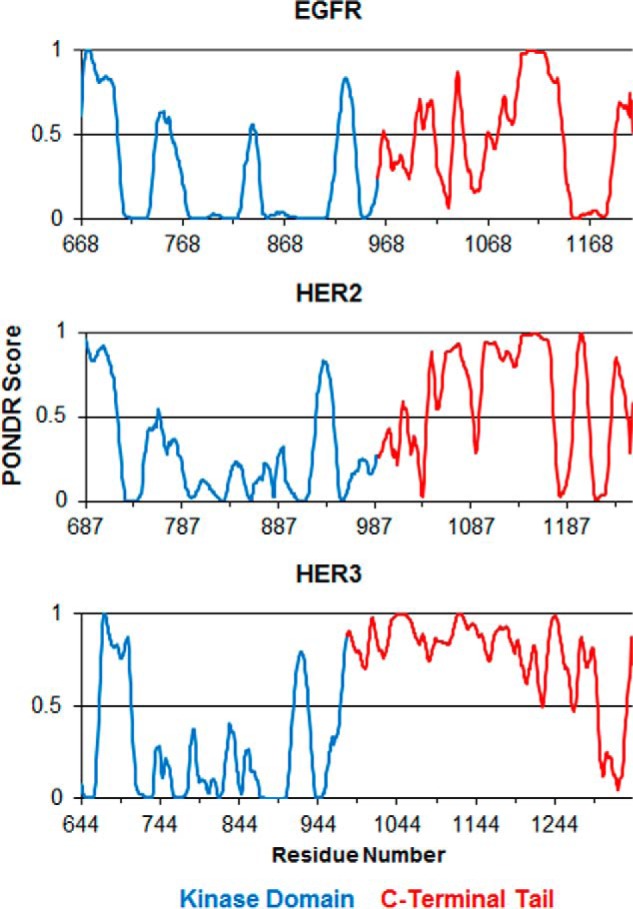
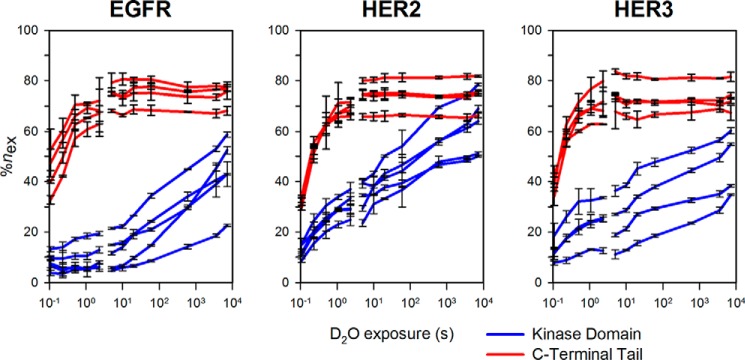
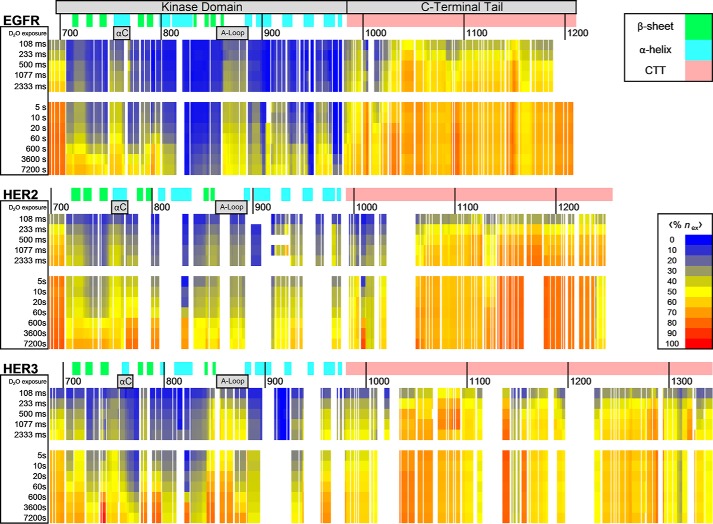
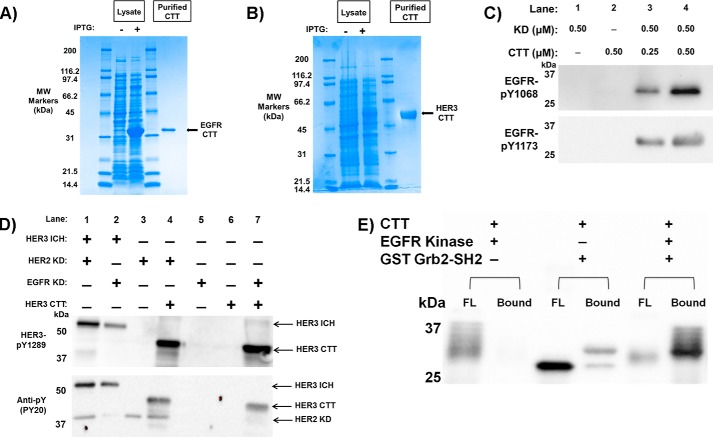
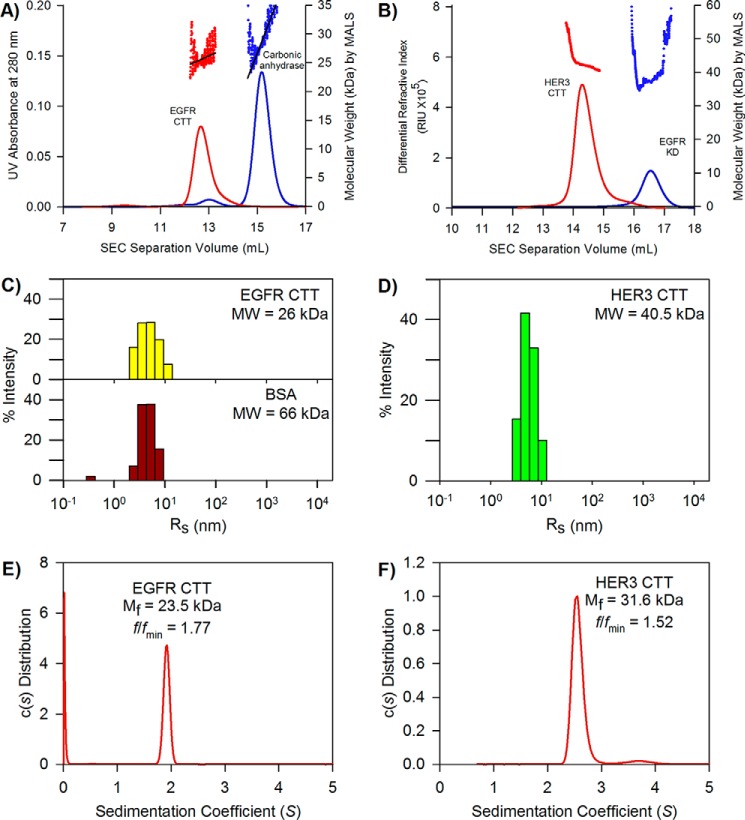
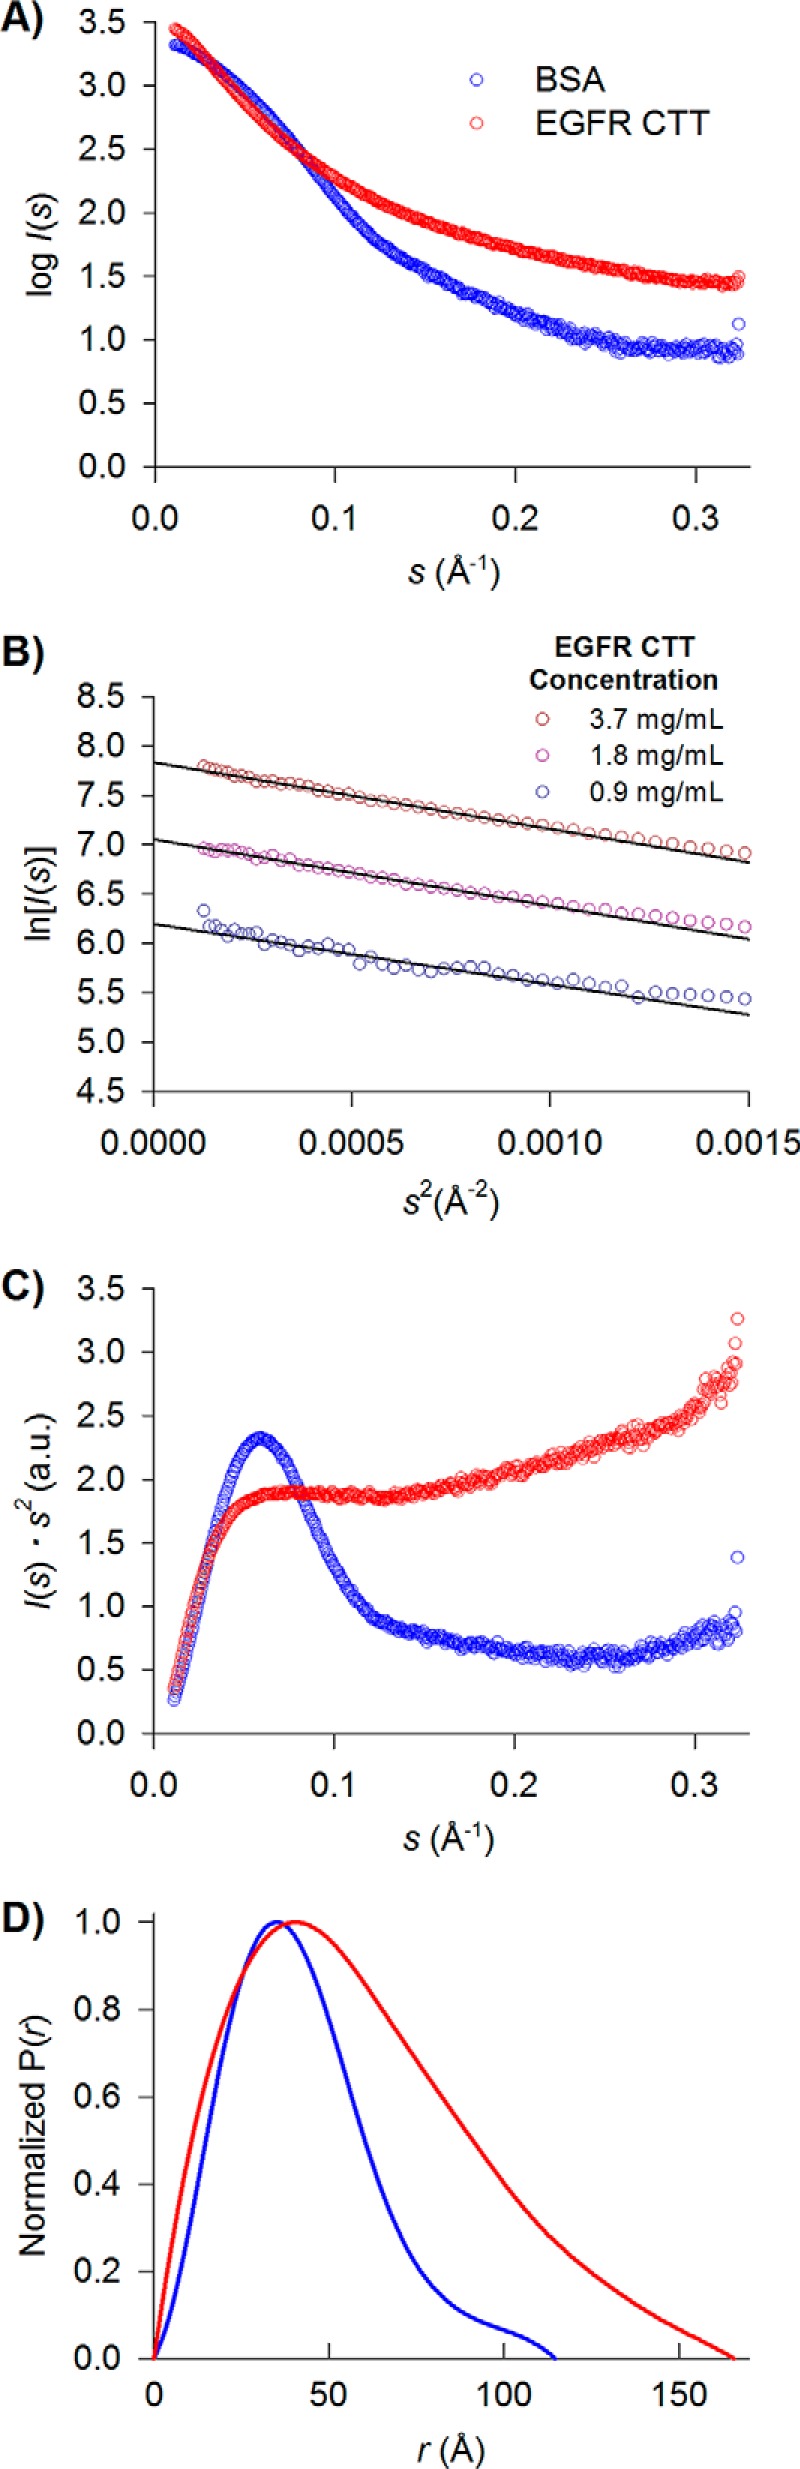
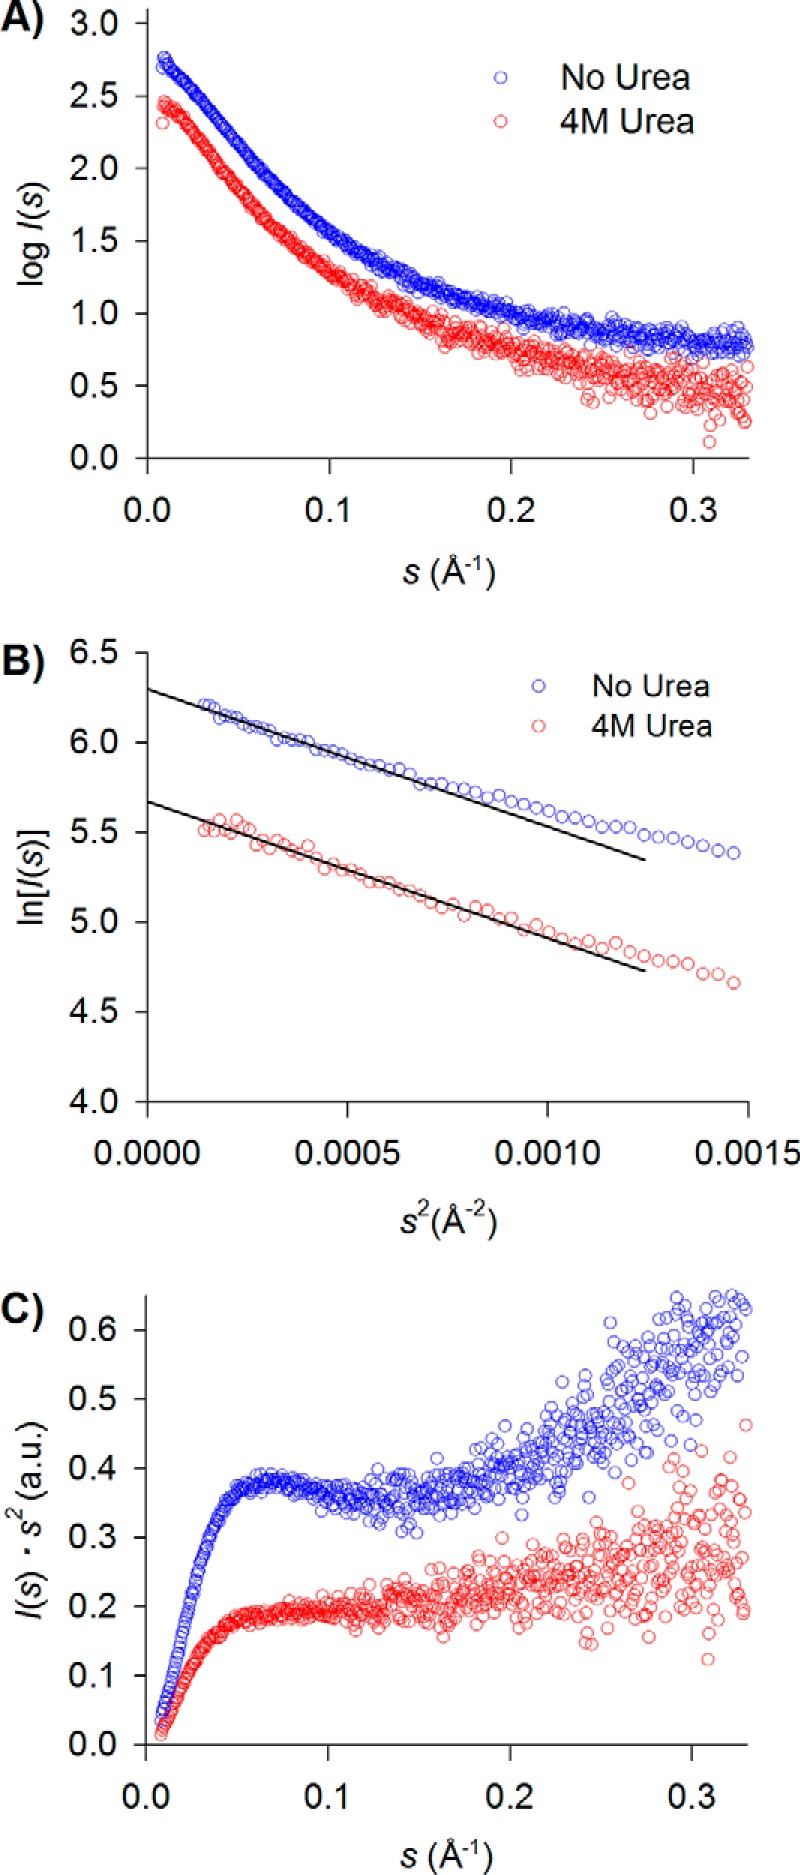
The epidermal growth factor receptor (EGFR)/ErbB family of receptor tyrosine kinases includes oncogenes important in the progression of breast and other cancers, and they are targets for many drug development strategies. Each member of the ErbB family possesses a unique, structurally uncharacterized C-terminal tail that plays an important role in autophosphorylation and signal propagation. To determine whether these C-terminal tails are intrinsically disordered regions, we conducted a battery of biophysical experiments on the EGFR and HER3 tails. Using hydrogen/deuterium exchange mass spectrometry, we measured the conformational dynamics of intracellular half constructs and compared the tails with the ordered kinase domains. The C-terminal tails demonstrate more rapid deuterium exchange behavior when compared with the kinase domains. Next, we expressed and purified EGFR and HER3 tail-only constructs. Results from circular dichroism spectroscopy, size exclusion chromatography with multiangle light scattering, dynamic light scattering, analytical ultracentrifugation, and small angle X-ray scattering each provide evidence that the EGFR and HER3 C-terminal tails are intrinsically disordered with extended, non-globular structure in solution. The intrinsic disorder and extended conformation of these tails may be important for their function by increasing the capture radius and reducing the thermodynamic barriers for binding of downstream signaling proteins.

Keywords: C-terminal domain (carboxyl tail domain, CTD); analytical ultracentrifugation; circular dichroism (CD); dynamic light scattering (DLS); epidermal growth factor receptor (EGFR); hydrogen exchange mass spectrometry; intrinsically disordered protein; phosphotyrosine signaling; size exclusion chromatography; small angle X-ray scattering (SAXS).


Figures

FIGURE 1.
FIGURE 1.
Disorder prediction by PONDR VL-XT algorithm. Shown are the disorder predictions for EGFR, HER2, and HER3 ICD construct sequences. In all three graphs, results for the kinase domain residues are colored blue, and the tail domain residues are colored in red. A score above 0.5 indicates predicted disorder, whereas a score below 0.5 indicates predicted order.
FIGURE 2.
FIGURE 2.
Example HDX-MS uptake curves for EGFR, HER2, and HER3. Selected peptides from the kinase domains or C-terminal tail of each protein are shown in blue and red, respectively. Deuterium uptake reaches a plateau more quickly for the C-terminal tail as compared with the kinase domain. %nex is calculated as the percentage of exchange relative to the maximum number of exchangeable amide hydrogens in each peptide normalized by the H2O:D2O labeling ratio used in both labeling time course sets of experiments. Each data point represents the mean %nex value determined from triplicate measurements with error bars representing the S.D. at each point.
FIGURE 3.
FIGURE 3.
HDX-MS heat maps for EGFR, HER2, and HER3 ICH constructs. Residue-specific average deuterium uptake data, 〈%nex〉, is mapped against respective EGFR, HER2, and HER3 sequences. Deuterium uptake reaches a plateau much sooner in C-terminal tail regions when compared with the more structured kinase domain. The EGFR sequence includes the 24-residue signal peptide in the numbering scheme. Similarly, the HER3 sequence numbering includes the 19-residue signal peptide. The secondary structure of the kinase domain as determined by X-ray crystallography is shown plotted against the sequence (Protein Data Bank codes 3PP0 for HER2, 3KEX for HER3, and 2GS2 for EGFR) (63–65). The location of αC-helices and activation loops are also identified.
FIGURE 4.
FIGURE 4.
Purification and phosphorylation of CTT constructs. A, Coomassie-stained SDS-polyacrylamide gel of EGFR CTT purification. Lanes 1 and 4 are molecular weight markers labeled respectively. Lane 2 is transformed cell lysate preinduction with IPTG. Lane 3 is lysate postinduction. Lane 5 is purified EGFR CTT following Ni2+-chelating chromatography and gel filtration. EGFR CTT purity was determined to be >95%. B, Coomassie-stained SDS-polyacrylamide gel of HER3 CTT purification. This gel uses similar lane arrangement as in A for HER3 CTT expression. C, EGFR CTT is recognized and phosphorylated by the EGFR kinase domain. Phosphospecific antibodies to EGFR Tyr(P)-1068 and EGFR Tyr(P)-1173 were used to detect CTT phosphorylation. D, Western blotting analysis of HER3 CTT phosphorylation. The HER3 ICH serves as a positive control showing C-terminal tail phosphorylation via interaction with EGFR KD or HER2 KD. HER3 CTT is recognized and phosphorylated by the EGFR and HER2 kinase domains just as it would be as if it was part of its ICH construct. Phosphospecific antibodies to HER3 Tyr(P)-1289 and general anti-phosphotyrosine PY20 were used to detect HER3 CTT phosphorylation. E, phosphorylated EGFR CTT binds to the Grb2 SH2 domain. GSH-agarose beads were preloaded with GST-tagged Grb2 SH2 domain protein. Phosphorylated or unphosphorylated EGFR CTT was then incubated with the beads for 2 h at 4 °C, flow-through (FL) was collected and washed, and then the beads were boiled in sample buffer (Bound). Fractions were separated by SDS-PAGE and then transferred to nitrocellulose. Anti-His6-HRP antibody was used to detect EGFR CTT in the FL and bound fractions.
FIGURE 5.
FIGURE 5.
Circular dichroism spectroscopy. A, the CD spectrum for the EGFR CTT construct does not show prominent spectral features of α-helices and β-sheets. B, similarly, the HER3 CTT CD spectrum shows high unordered content with slightly higher calculated β-sheet content than in the EGFR CTT spectrum. C, secondary structure assignment was assigned the following symbols: regular α-helix (αR), distorted α-helix (αD), regular β-strand (βR), distorted β-strand (βD), turns (T), and unordered (U). deg, degrees.
FIGURE 6.
FIGURE 6.
Hydrodynamic properties of EGFR and HER3 CTT. A, elution chromatograms and molecule weight determination of EGFR CTT by SEC-MALS. EGFR CTT data are shown in red, and carbonic anhydrase data are shown in blue. Despite similar molecular weights, EGFR CTT elutes sooner, indicating a larger hydrodynamic size. B, SEC-MALS analysis of HER3 CTT. HER3 CTT data are shown in red, and EGFR kinase domain data are shown in blue. Again, the two molecules share similar molecular weights, but HER3 CTT elutes sooner than the EGFR KD. C, hydrodynamic radius determination of the EGFR CTT and BSA by dynamic light scattering. The measured DLS hydrodynamic radius distribution for EGFR CTT is shown as yellow bars. The measured hydrodynamic radius of EGFR CTT is 5.3 nm. The histogram for BSA (monomeric fraction obtained by gel filtration) is shown as red bars. The Rh of monomeric BSA is 4.8 nm. D, hydrodynamic radius determination of the HER3 CTT. The measured DLS hydrodynamic radius for HER3 CTT is 6.4 nm. E, frictional coefficient, frictional ratio, and molecular weight determined by analytical ultracentrifugation. The sedimentation coefficient was used to measure an apparent molecular mass, Mf, of 23.5 kDa. The frictional ratio for the EGFR CTT is 1.77, indicating a large Stokes radius relative to globular proteins. F, frictional coefficient, frictional ratio, and molecular weight determined by analytical ultracentrifugation. The measured apparent molecular mass of HER3CTT is 31.6 kDa. The frictional ratio is 1.52.
FIGURE 7.
FIGURE 7.
Small angle X-ray scattering analysis of EGFR CTT. A, scattering profiles of EGFR CTT (red) and BSA (blue). B, Guinier plots of EGFR CTT in different concentrations (0.9, 1.8, and 3.7 mg ml−1). C, the data are represented in a Kratky plot with arbitrary units. In folded proteins like BSA (blue), the Kratky plot shows parabolic features, whereas in the EGFR CTT Kratky plot (red), a hyperbolic shape indicates intrinsically disordered protein character. D, pair distribution functions for the EGFR CTT (red) and BSA (blue) scattering profiles generated using Datgnom (52).
FIGURE 8.
FIGURE 8.
Small angle X-ray scattering analysis of HER3 CTT in solution ± urea. A, scattering profiles of HER3 CTT in solution without urea (blue) and with 4 m urea (red). B, Guinier plots of HER3 CTT with or without the presence of 4 m urea. C, the data are represented in a Kratky plot with arbitrary units. The Kratky plot for HER3 CTT with 4 m urea added shows a more hyperbolic profile, indicating greater disorder with the addition of chemical denaturant.

References

    1. Lemmon M. A., Schlessinger J., and Ferguson K. M. (2014) The EGFR family: not so prototypical receptor tyrosine kinases. Cold Spring Harb. Perspect. Biol. 6, a020768. - PMC - PubMed
    1. Lemmon M. A., and Schlessinger J. (2010) Cell signaling by receptor tyrosine kinases. Cell 141, 1117–1134 - PMC - PubMed
    1. Franklin M. C., Carey K. D., Vajdos F. F., Leahy D. J., de Vos A. M., and Sliwkowski M. X. (2004) Insights into ErbB signaling from the structure of the ErbB2-pertuzumab complex. Cancer Cell 5, 317–328 - PubMed
    1. Wood E. R., Truesdale A. T., McDonald O. B., Yuan D., Hassell A., Dickerson S. H., Ellis B., Pennisi C., Horne E., Lackey K., Alligood K. J., Rusnak D. W., Gilmer T. M., and Shewchuk L. (2004) A unique structure for epidermal growth factor receptor bound to GW572016 (lapatinib): relationships among protein conformation, inhibitor off-rate, and receptor activity in tumor cells. Cancer Res. 64, 6652–6659 - PubMed
    1. Dankort D. L., Wang Z., Blackmore V., Moran M. F., and Muller W. J. (1997) Distinct tyrosine autophosphorylation sites negatively and positively modulate neu-mediated transformation. Mol. Cell. Biol. 17, 5410–5425 - PMC - PubMed

LinkOut - more resources