. 2017 Jan;173(1):872-886.
doi: 10.1104/pp.16.01287. Epub 2016 Nov 21.

Network-Guided GWAS Improves Identification of Genes Affecting Free Amino Acids

Affiliations

Network-Guided GWAS Improves Identification of Genes Affecting Free Amino Acids

Ruthie Angelovici et al. Plant Physiol. 2017 Jan.

Abstract

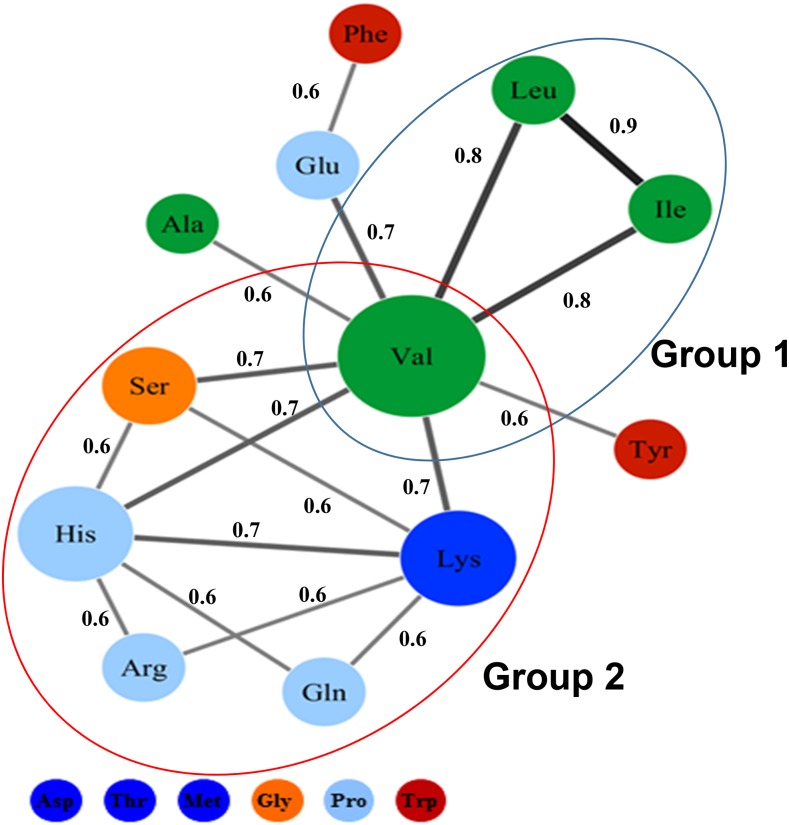
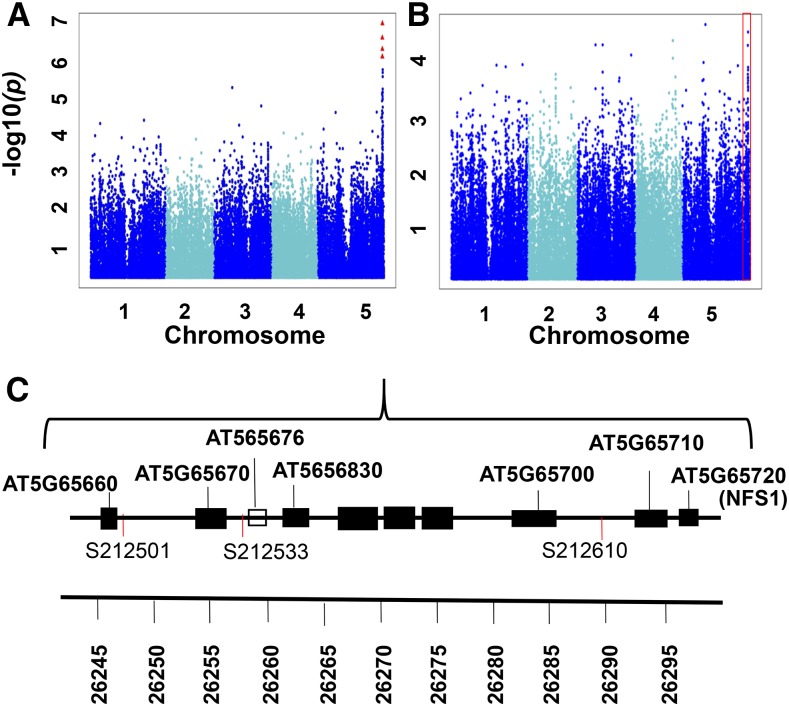
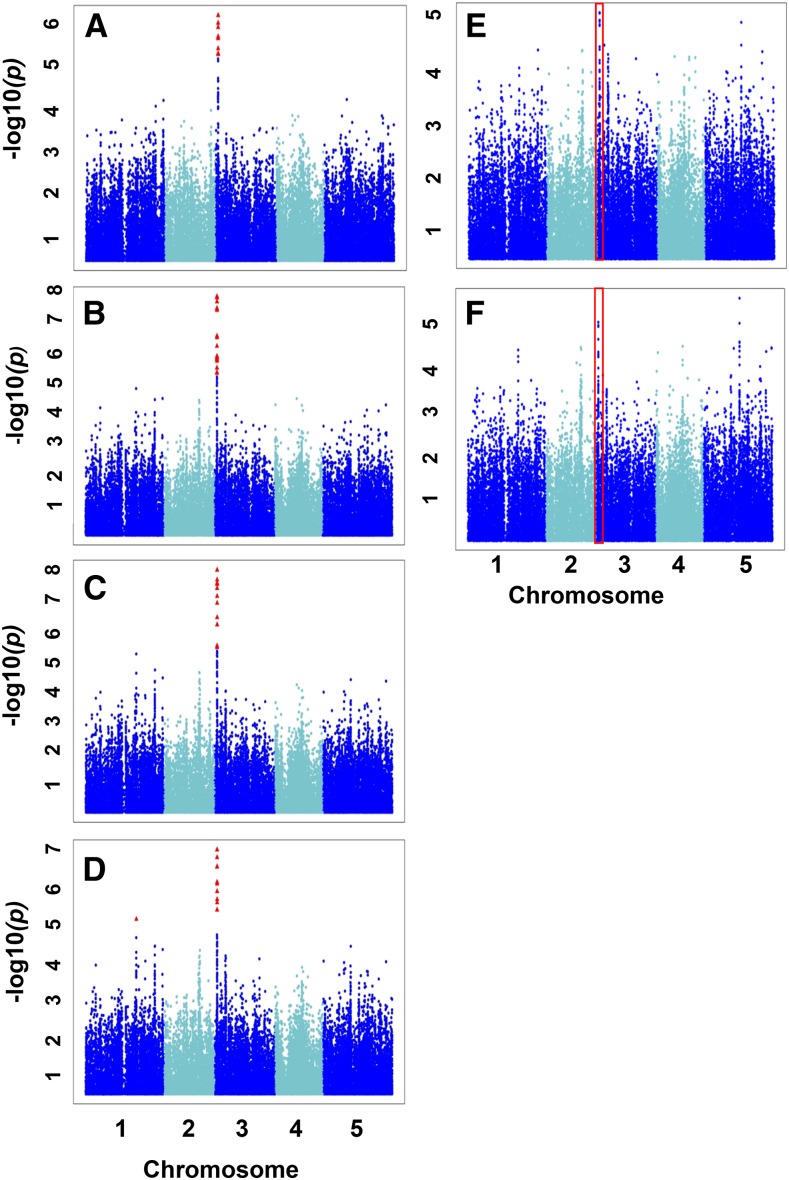
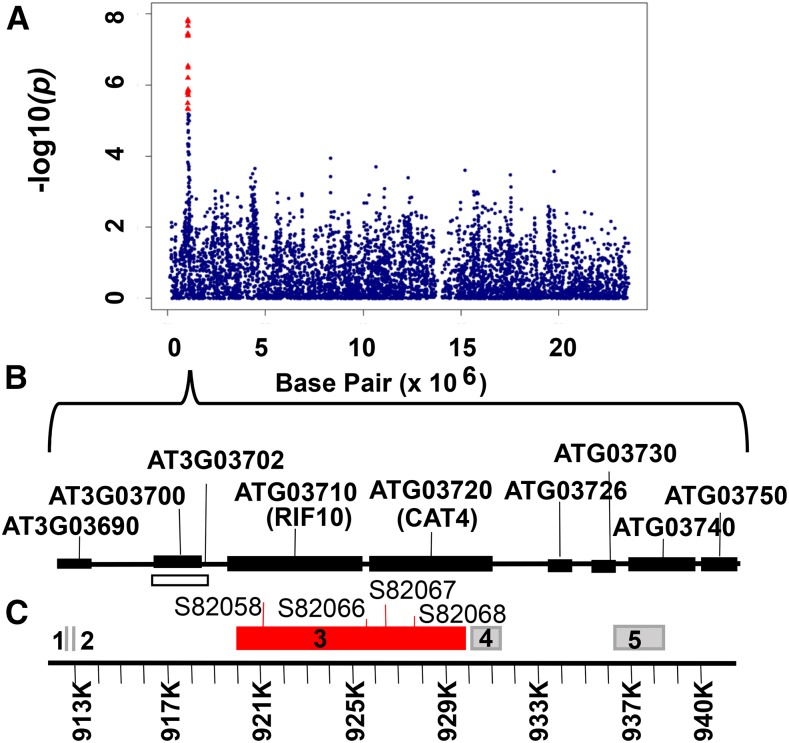
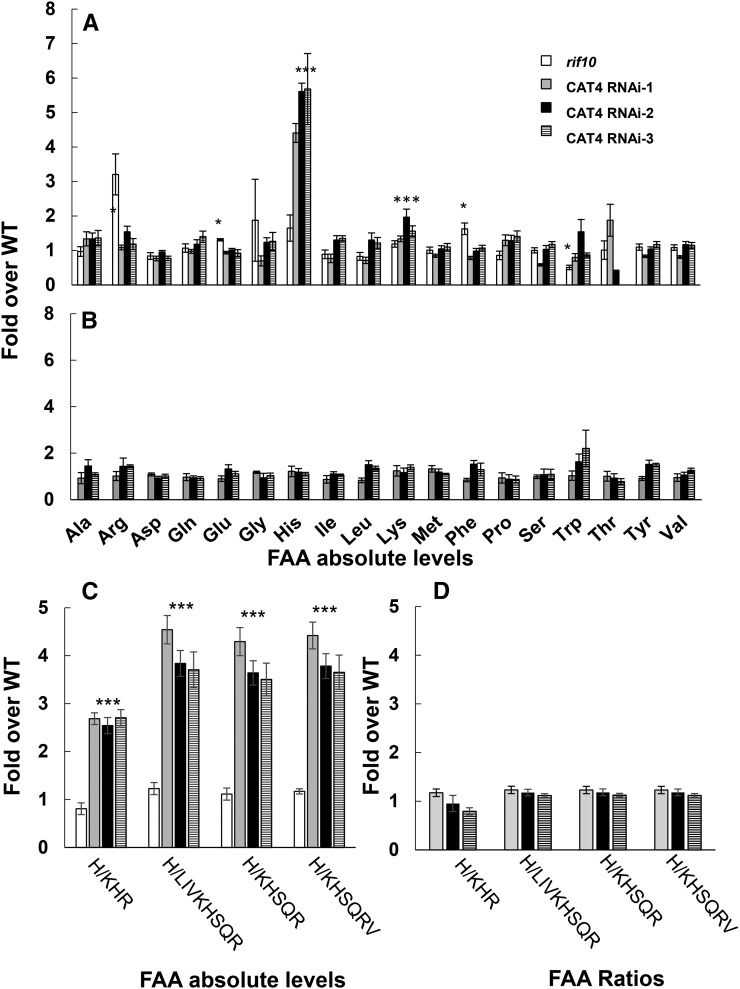
Amino acids are essential for proper growth and development in plants. Amino acids serve as building blocks for proteins but also are important for responses to stress and the biosynthesis of numerous essential compounds. In seed, the pool of free amino acids (FAAs) also contributes to alternative energy, desiccation, and seed vigor; thus, manipulating FAA levels can significantly impact a seed's nutritional qualities. While genome-wide association studies (GWAS) on branched-chain amino acids have identified some regulatory genes controlling seed FAAs, the genetic regulation of FAA levels, composition, and homeostasis in seeds remains mostly unresolved. Hence, we performed GWAS on 18 FAAs from a 313-ecotype Arabidopsis (Arabidopsis thaliana) association panel. Specifically, GWAS was performed on 98 traits derived from known amino acid metabolic pathways (approach 1) and then on 92 traits generated from an unbiased correlation-based metabolic network analysis (approach 2), and the results were compared. The latter approach facilitated the discovery of additional novel metabolic interactions and single-nucleotide polymorphism-trait associations not identified by the former approach. The most prominent network-guided GWAS signal was for a histidine (His)-related trait in a region containing two genes: a cationic amino acid transporter (CAT4) and a polynucleotide phosphorylase resistant to inhibition with fosmidomycin. A reverse genetics approach confirmed CAT4 to be responsible for the natural variation of His-related traits across the association panel. Given that His is a semiessential amino acid and a potent metal chelator, CAT4 orthologs could be considered as candidate genes for seed quality biofortification in crop plants.


Figures

Figure 1.
Figure 1.
Correlation-based network of seed FAA relationships across the Arabidopsis diversity panel. The Spearman’s rank correlation matrix was calculated from the back-transformed BLUPs of the absolute levels. The nodes represent FAA levels, and the edges represent correlations between the different FAA levels. Network edge parameters are rsp ≥ 0.6 and P ≤ 0.001. The node color denotes the amino acid family (red, shikimic acid; orange, Ser; green, pyruvate and BCAA; blue, Glu; dark blue, Asp); node size reflects nodal degree; and edge width reflects the strength of the correlation. The Spearman’s rank correlation coefficient is represented near each edge. The two highly connected groups are circled in blue and red. Free His is included within the red-circled group together with Ser, Gln, Lys, Arg, and Val.
Figure 2.
Figure 2.
GWAS summary of S/LIVKHSQR. A and B, Scatterplots of the association results from a unified mixed model analysis of S/LIVKHSQR (A) and S/total (B) traits across the five Arabidopsis chromosomes. The negative log10-transformed P values from the GWAS analysis are plotted against the genomic physical positions. P values for SNPs that are statistically significant for a trait at 5% FDR are in red. The red box represents the corresponding chromosomal region of this significant signal in the S/total Manhattan plot. C, Graphical representation of the genes within the vicinity of SNP212501, SNP212533, and SNP212610. Genes are represented by black boxes, and a pseudogene is represented by the white box. At5G65720 encodes a Cys desulfurase (NFS1) that is the leading candidate gene for S/LIVKHSQR.
Figure 3.
Figure 3.
GWAS for the His-related traits from the two approaches. Scatterplots show the association results from a unified mixed model analysis for H/KHR (A), H/KHSQR (B), H/KHSQRV (C), H/LIVKHQSR (D), H/EHPRG (Glu family; E), and H/total (F) traits across the five Arabidopsis chromosomes. The negative log10-transformed P values from the GWAS analysis are plotted against the genomic physical position. P values for SNPs that are statistically significant for a trait at 5% FDR are in red. Traits A through D share a similar significant GWAS signal on chromosome 3. Red boxes represent the corresponding chromosomal region of this signal for traits E and F.
Figure 4.
Figure 4.
GWAS of H/KHSQR. A, Scatterplot of the association results from a unified mixed model analysis of H/KHSQR on chromosome 3 only. The negative log10-transformed P values from the GWAS analysis are plotted against the genomic physical position. P values for SNPs that are statistically significant for a trait at 5% FDR are in red. B, Graphical representation of genes and haploblocks within the genomic region spanning SNPs that have significant associations for H/KHSQR. Genes are represented by black boxes, and a pseudogene is represented by the white box. C, Haploblocks are represented by gray boxes. Haploblock 3 (shown in red) contains the four most significant SNPs for the GWAS-assisted His-related traits.
Figure 5.
Figure 5.
Seed and leaf FAA-related traits measured from three cat4 RNAi lines and rif10. Absolute FAA levels were measured from dry seeds (A) and leaves (B) harvested from 2-week-old plants. Significant ratios were calculated from both dry seeds (C) and leaves (D). Values represent fold changes in FAA for the three CAT4 RNAi lines (gray, black, and striped bars) and rif10 (white bars; seeds only) relative to their respective controls (wild type [WT] with an empty vector). Averages and se values were calculated from four measurements. *, FAA traits that have a significant difference (P < 0.05, Student’s t test) between the wild type and rif10; ***, FAA traits that have a significant difference (P < 0.05, Student’s t test) between the wild type and all three CAT4 RNAi lines. For the FAA content, see Supplemental Data Set S4.

References

    1. Alonso-Blanco C, El-Assal SE, Coupland G, Koornneef M (1998) Analysis of natural allelic variation at flowering time loci in the Landsberg erecta and Cape Verde Islands ecotypes of Arabidopsis thaliana. Genetics 149: 749–764 - PMC - PubMed
    1. Angelovici R, Fait A, Fernie AR, Galili G (2011) A seed high-lysine trait is negatively associated with the TCA cycle and slows down Arabidopsis seed germination. New Phytol 189: 148–159 - PubMed
    1. Angelovici R, Fait A, Zhu X, Szymanski J, Feldmesser E, Fernie AR, Galili G (2009) Deciphering transcriptional and metabolic networks associated with lysine metabolism during Arabidopsis seed development. Plant Physiol 151: 2058–2072 - PMC - PubMed
    1. Angelovici R, Galili G, Fernie AR, Fait A (2010) Seed desiccation: a bridge between maturation and germination. Trends Plant Sci 15: 211–218 - PubMed
    1. Angelovici R, Lipka AE, Deason N, Gonzalez-Jorge S, Lin H, Cepela J, Buell R, Gore MA, Dellapenna D (2013) Genome-wide analysis of branched-chain amino acid levels in Arabidopsis seeds. Plant Cell 25: 4827–4843 - PMC - PubMed

Publication types

MeSH terms

LinkOut - more resources