. 2017 Jan;173(1):907-917.
doi: 10.1104/pp.16.01099. Epub 2016 Nov 21.

The Transcription Factor ATHB5 Affects GA-Mediated Plasticity in Hypocotyl Cell Growth during Seed Germination

Affiliations

The Transcription Factor ATHB5 Affects GA-Mediated Plasticity in Hypocotyl Cell Growth during Seed Germination

Petra Stamm et al. Plant Physiol. 2017 Jan.

Abstract

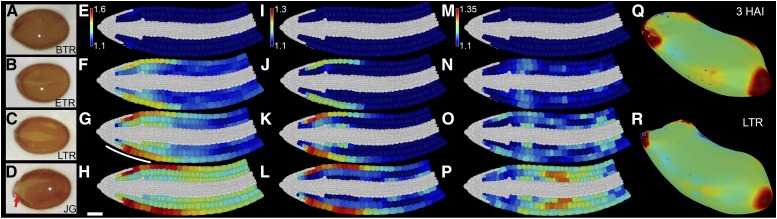
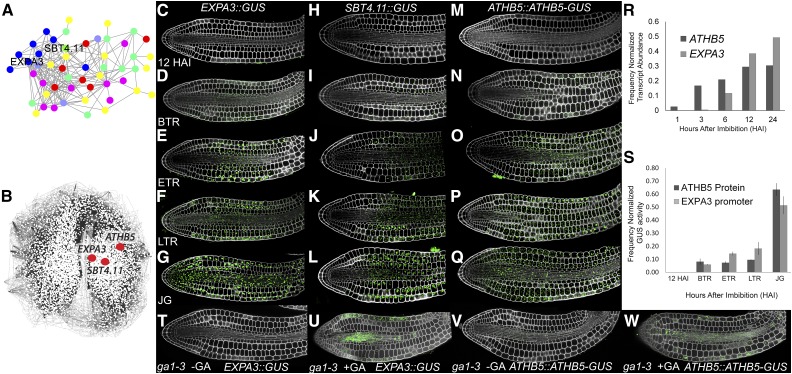
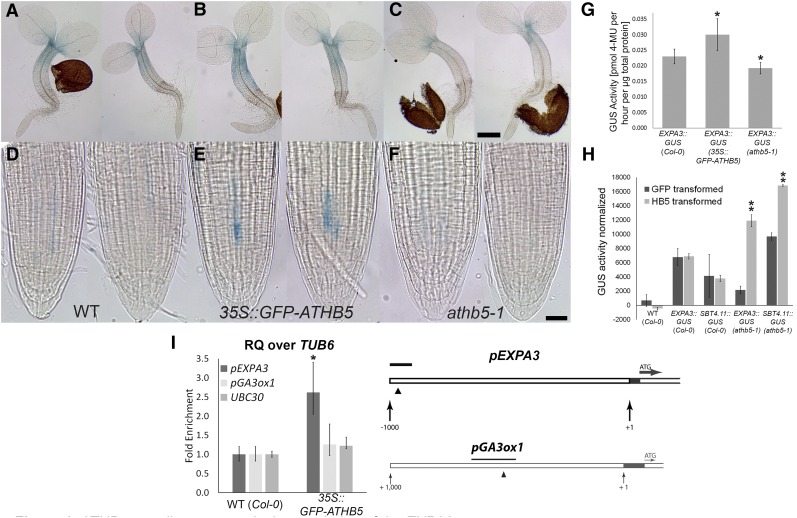
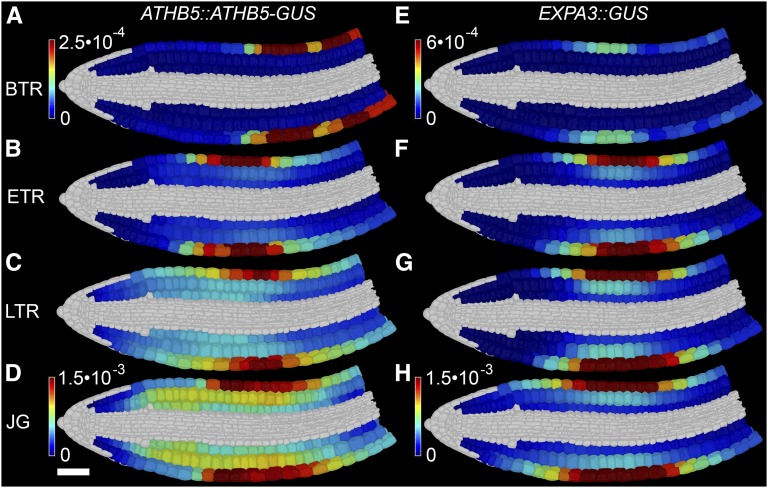
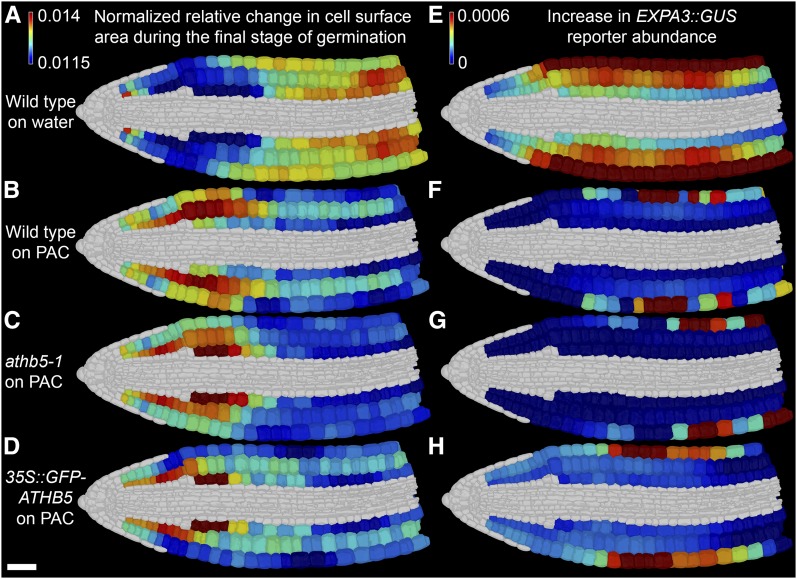
Gibberellic acid (GA)-mediated cell expansion initiates the seed-to-seedling transition in plants and is repressed by DELLA proteins. Using digital single-cell analysis, we identified a cellular subdomain within the midhypocotyl, whose expansion drives the final step of this developmental transition under optimal conditions. Using network inference, the transcription factor ATHB5 was identified as a genetic factor whose localized expression promotes GA-mediated expansion specifically within these cells. Both this protein and its putative growth-promoting target EXPANSIN3 are repressed by DELLA, and coregulated at single-cell resolution during seed germination. The cellular domains of hormone sensitivity were explored within the Arabidopsis (Arabidopsis thaliana) embryo by putting seeds under GA-limiting conditions and quantifying cellular growth responses. The middle and upper hypocotyl have a greater requirement for GA to promote cell expansion than the lower embryo axis. Under these conditions, germination was still completed following enhanced growth within the radicle and lower axis. Under GA-limiting conditions, the athb5 mutant did not show a phenotype at the level of seed germination, but it did at a cellular level with reduced cell expansion in the hypocotyl relative to the wild type. These data reveal that the spatiotemporal cell expansion events driving this transition are not determinate, and the conditional use of GA-ATHB5-mediated hypocotyl growth under optimal conditions may be used to optionally support rapid seedling growth. This study demonstrates that multiple genetic and spatiotemporal cell expansion mechanisms underlie the seed to seedling transition in Arabidopsis.


Figures

Figure 1.
Figure 1.
Distinct steps of seed germination occur in discrete cellular locations. Quantification of 3D growth across embryo germination at single-cell resolution. Shown are Arabidopsis seeds at the sampled stages of germination (A–D), BTR (A, E, I, and M), during ETR (B, F, J, and N), during LTR (C, G, K, O, and R), and having JG (D, H, L, and P). E to H, Mean relative increase in cell surface area. I to L, Mean relative increase in radial cell length. M to P, Mean relative increase in longitudinal cell length. Data were derived from four embryos at each time point and calculated relative to unexpanded embryos at 3 HAI. Q and R, Mesh showing the surface curvature of the Arabidopsis embryo axis at 3 HAI (Q) and LTR false-colored for Gaussian curvature (R). Scale bar for all in H is 50 µm. The line in G indicates the position of visible testa rupture. See also Supplemental File S1, Supplemental Figures S1 and S2, and Supplemental Movie S1.
Figure 2.
Figure 2.
Identification of late-induced midhypocotyl gene expression and protein accumulation patterns in germinating Arabidopsis embryos. A, Coexpressed genes whose protein products are cell wall targeted. Different classes of wall-modifying activity are indicated by different colors with expansin in blue and the subtilisin in green. B, Positions of EXPA3, SBT4.11, and ATHB5 within the gene coexpression network SeedNet. C to Q, EXPA3::GUS promoter activity (C–G), SBT4.11::GUS promoter activity (H–L), and ATHB5::ATHB5-GUS protein localization (M–Q) at 12 HAI (C, H, and M), BTR (D, I, and N), ETR (E, J, and O), LTR (F, K, and P), and JG (G, L, and Q). R, Transcript levels of EXPA3 and ATHB5 during imbibition based on previously published microarray data (Nakabayashi et al., 2005). S, Quantification of GUS activity reflecting EXPA3::GUS promoter activity, and ATHB5::ATHB5-GUS protein abundance within germinating embryos. Absolute activities for each reporter were normalized to the total activity of each detected throughout the time course for comparison. T to W, EXPA3::GUS and ATHB5::ATHB5-GUS reporters in the ga1-3 mutant background at 24 HAI in the presence or absence of GA.
Figure 3.
Figure 3.
ATHB5 contributes toward the regulation of the EXPA3 promoter. A to F, Light microscopic images of GUS-stained 2-d-old EXPA3::GUS seedlings in wild type (Col; A and D), 35S::GFP-ATHB5 (B and E), and athb5-1 (C and F) background. Whole seedlings (A–C) and their root tips (D–F) are shown. Scale bars are 100 μm (C) and 20 μm (F). G, GUS activity in protein extracts from EXPA3::GUS seedlings in wild type (Col-0), 35S::GFP-ATHB5, and athb5-1 background at 48 HAI determined by fluorometric assay. Data are mean ± sd of biological quadruplicates. Asterisks indicate significant difference, according to a two-tailed Student’s t test (*P < 0.05). H, GUS activity in mesophyll protoplasts from EXPA3::GUS and SBT4.11::GUS reporter lines transfected with a 35S::ATHB5 construct. Asterisks indicate significant difference, according to a two-tailed Student’s t test (**P < 0.001). I, ChIP-qRT-PCR analysis of the ATHB5 bindings. The triangle shows the position of an ATHB5 binding site in the EXPA3 promoter (Johannesson et al., 2001), and the black bar indicates the position of fragment amplified by qRT-PCR. Graphs indicate relative enrichment of amplified fragments over TUBULIN6 (TUB6) in chromatin isolated from germinating 35S::GFP-ATHB5 seedlings, normalized to chromatin from wild-type (WT) embryos. Amplification of UBIQUITIN CONJUGATING ENZYME E230 (UBC30; Gibbs et al., 2014) and GA3-OXIDASE1 (GA3ox1) promoter sequences were included as controls. The GA3ox1 promoter contains an ATHB5 consensus binding site as indicated by the black arrowhead. RQ, Relative quantity. Data are mean ± sd of biological triplicates. Asterisks indicate significant difference, according to a two-tailed Student’s t test (P < 0.05).
Figure 4.
Figure 4.
ATHB5 protein abundance and EXPA3 promoter activity are spatiotemporally coregulated during Arabidopsis seed germination. Shown is digital single-cell quantification of ATHB5 protein abundance (A–D) and EXPA3 promoter activity (E–H), at BTR (A and E), ETR (B and F), LTR (C and G), and JG (D and H). Reporter quantification data were derived from four embryos each. The mean GUS quantity in each cell was calculated and normalized to GUS activity as determined by quantitative fluorometric assays for each sample. White scale bar for all in D is 50 µm. See also Supplemental Figure S4, Supplemental File S2, and Supplemental Movie S2.
Figure 5.
Figure 5.
ATHB5 correlates with EXPA3 promoter activity and GA-mediated growth specifically in the embryonic hypocotyl. Shown is relative increase in cell surface area (A to D) and increase in EXPA3 promoter activity (E–H) in wild-type, athb5-1 knockout, and 35S::GFP-ATHB5 embryos between the final germination stages (LTR to JG) on water (A and E) and on 5 µm PAC (B–D and F–H). A to D, Changes in cell surface area were determined as the ratio between LTR and JG and frequency normalized to enable comparisons across genotypes. E to H, Change in EXPA3 promoter activity between LTR and JG. The mean GUS quantity in each cell was calculated, and the difference between these means at JG and LTR was determined. All growth and reporter quantification data were derived from four embryos at each stage. White scale bar in D is 50 µm.

References

    1. Achard P, Cheng H, De Grauwe L, Decat J, Schoutteten H, Moritz T, Van Der Straeten D, Peng J, Harberd NP (2006) Integration of plant responses to environmentally activated phytohormonal signals. Science 311: 91–94 - PubMed
    1. Barbier de Reuille P, Routier-Kierzkowska AL, Kierzkowski D, Bassel GW, Schüpbach T, Tauriello G, Bajpai N, Strauss S, Weber A, Kiss A, et al. (2015) MorphoGraphX: a platform for quantifying morphogenesis in 4D. eLife 4: 05864. - PMC - PubMed
    1. Bassel GW, Gaudinier A, Brady SM, Hennig L, Rhee SY, De Smet I (2012) Systems analysis of plant functional, transcriptional, physical interaction, and metabolic networks. Plant Cell 24: 3859–3875 - PMC - PubMed
    1. Bassel GW, Lan H, Glaab E, Gibbs DJ, Gerjets T, Krasnogor N, Bonner AJ, Holdsworth MJ, Provart NJ (2011) Genome-wide network model capturing seed germination reveals coordinated regulation of plant cellular phase transitions. Proc Natl Acad Sci USA 108: 9709–9714 - PMC - PubMed
    1. Bassel GW, Stamm P, Mosca G, Barbier de Reuille P, Gibbs DJ, Winter R, Janka A, Holdsworth MJ, Smith RS (2014) Mechanical constraints imposed by 3D cellular geometry and arrangement modulate growth patterns in the Arabidopsis embryo. Proc Natl Acad Sci USA 111: 8685–8690 - PMC - PubMed

Publication types

MeSH terms

LinkOut - more resources