

Disparities in influenza mortality and transmission related to sociodemographic factors within Chicago in the pandemic of 1918
- PMID: 27872284
- PMCID: PMC5137773
- DOI: 10.1073/pnas.1612838113
Disparities in influenza mortality and transmission related to sociodemographic factors within Chicago in the pandemic of 1918
Abstract
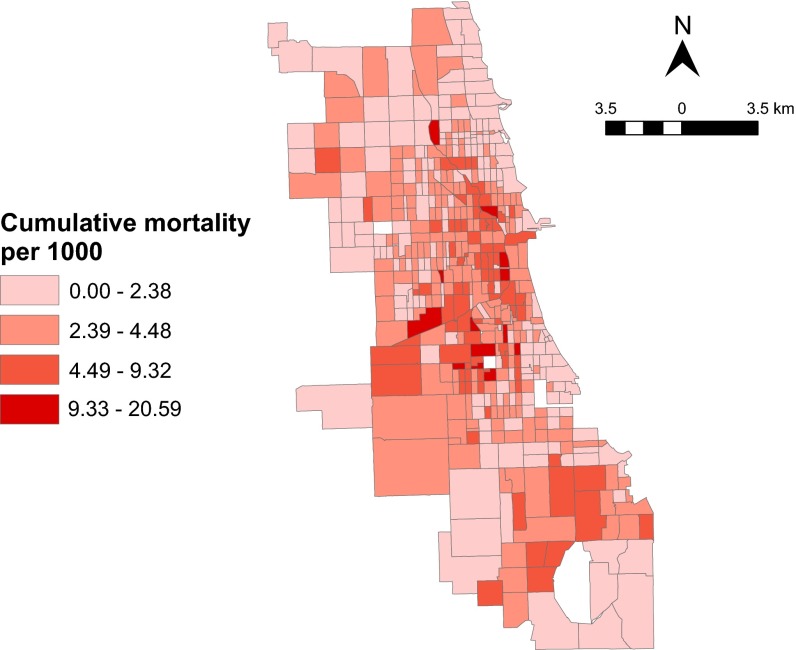
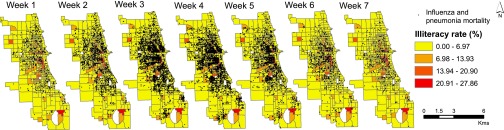
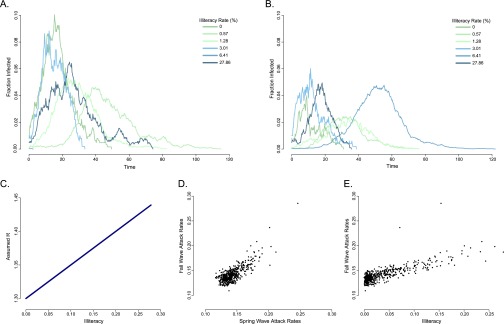
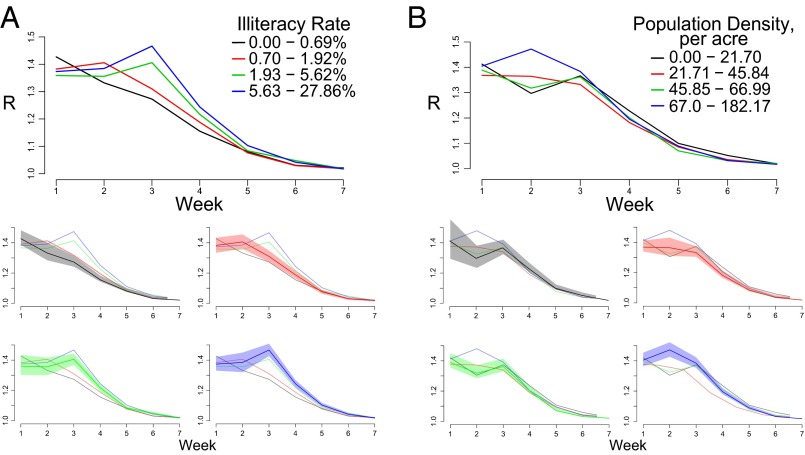
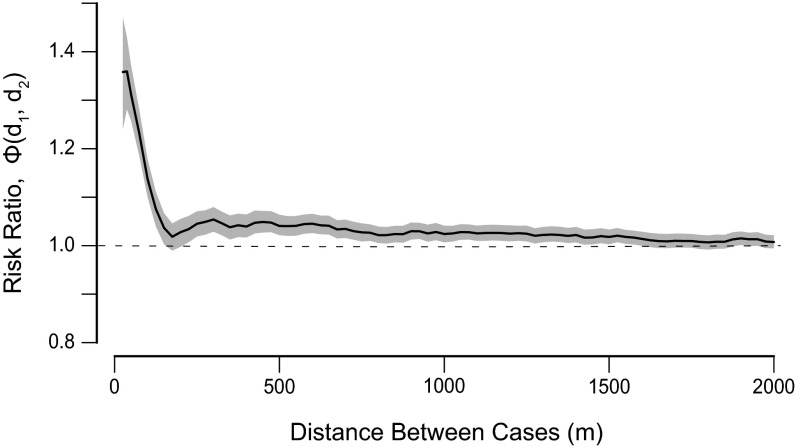
Social factors have been shown to create differential burden of influenza across different geographic areas. We explored the relationship between potential aggregate-level social determinants and mortality during the 1918 influenza pandemic in Chicago using a historical dataset of 7,971 influenza and pneumonia deaths. Census tract-level social factors, including rates of illiteracy, homeownership, population, and unemployment, were assessed as predictors of pandemic mortality in Chicago. Poisson models fit with generalized estimating equations (GEEs) were used to estimate the association between social factors and the risk of influenza and pneumonia mortality. The Poisson model showed that influenza and pneumonia mortality increased, on average, by 32.2% for every 10% increase in illiteracy rate adjusted for population density, homeownership, unemployment, and age. We also found a significant association between transmissibility and population density, illiteracy, and unemployment but not homeownership. Lastly, analysis of the point locations of reported influenza and pneumonia deaths revealed fine-scale spatiotemporal clustering. This study shows that living in census tracts with higher illiteracy rates increased the risk of influenza and pneumonia mortality during the 1918 influenza pandemic in Chicago. Our observation that disparities in structural determinants of neighborhood-level health lead to disparities in influenza incidence in this pandemic suggests that disparities and their determinants should remain targets of research and control in future pandemics.
Keywords: 1918; influenza; mortality; sociodemographic; transmission.
Conflict of interest statement
The authors declare no conflict of interest.
Figures
Comment in
-
Pandemic influenza and socioeconomic disparities: Lessons from 1918 Chicago.Proc Natl Acad Sci U S A. 2016 Nov 29;113(48):13557-13559. doi: 10.1073/pnas.1616537113. Epub 2016 Nov 22. Proc Natl Acad Sci U S A. 2016. PMID: 27911763 Free PMC article. No abstract available.
-
Reply to Shanks and Brundage: Many plausible mechanisms of pandemic mortality disparities.Proc Natl Acad Sci U S A. 2017 May 2;114(18):E3588-E3589. doi: 10.1073/pnas.1703851114. Epub 2017 Apr 6. Proc Natl Acad Sci U S A. 2017. PMID: 28386047 Free PMC article. No abstract available.
-
Variable mortality during the 1918 influenza pandemic in Chicago.Proc Natl Acad Sci U S A. 2017 May 2;114(18):E3586-E3587. doi: 10.1073/pnas.1701344114. Epub 2017 Apr 6. Proc Natl Acad Sci U S A. 2017. PMID: 28386048 Free PMC article. No abstract available.
References
-
- Murray CJL, Lopez AD, Chin B, Feehan D, Hill KH. Estimation of potential global pandemic influenza mortality on the basis of vital registry data from the 1918-20 pandemic: A quantitative analysis. Lancet. 2006;368(9554):2211–2218. - PubMed
-
- Mamelund S-E. A socially neutral disease? Individual social class, household wealth and mortality from Spanish influenza in two socially contrasting parishes in Kristiania 1918-19. Soc Sci Med. 2006;62(4):923–940. - PubMed
Publication types
MeSH terms
Associated data
Grants and funding
LinkOut - more resources
Full Text Sources
Other Literature Sources
Medical
