. 2016 Dec 6;113(49):E7966-E7975.
doi: 10.1073/pnas.1618196113. Epub 2016 Nov 21.

Emergence of an abstract categorical code enabling the discrimination of temporally structured tactile stimuli

Affiliations

Emergence of an abstract categorical code enabling the discrimination of temporally structured tactile stimuli

Román Rossi-Pool et al. Proc Natl Acad Sci U S A. .

Abstract

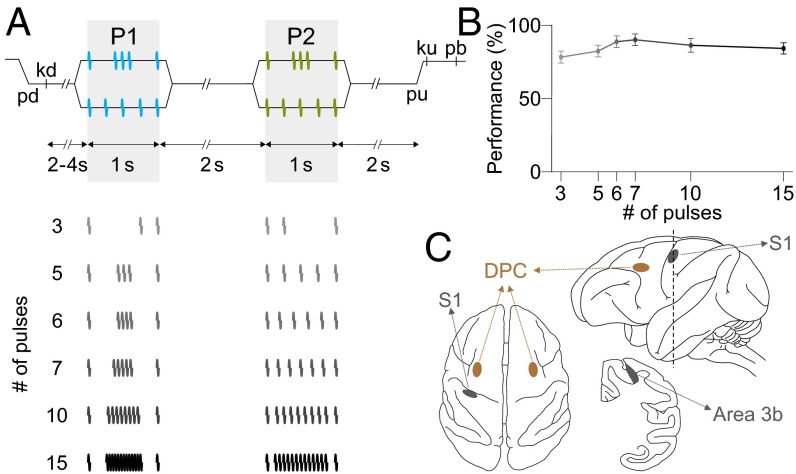
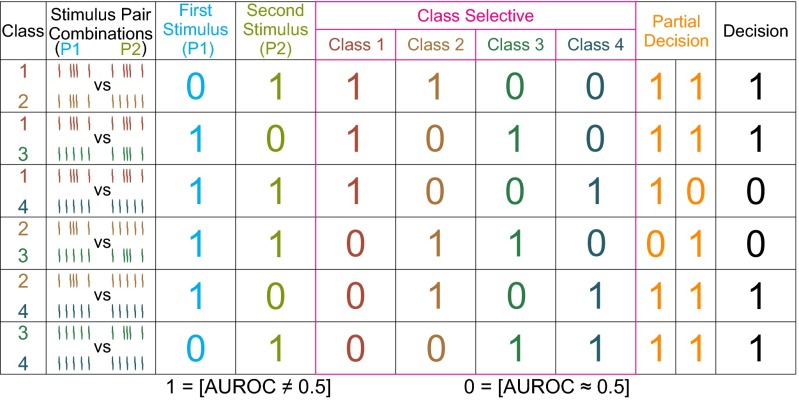
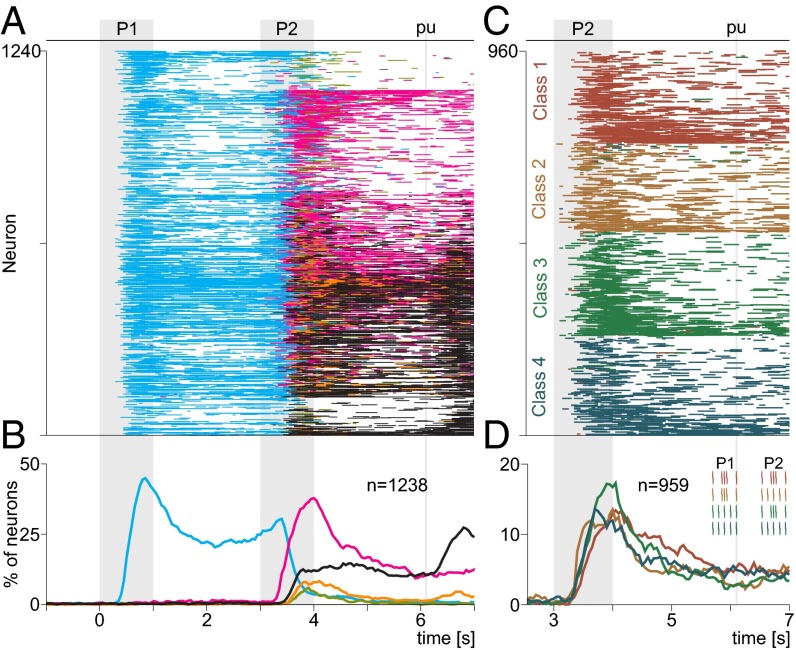
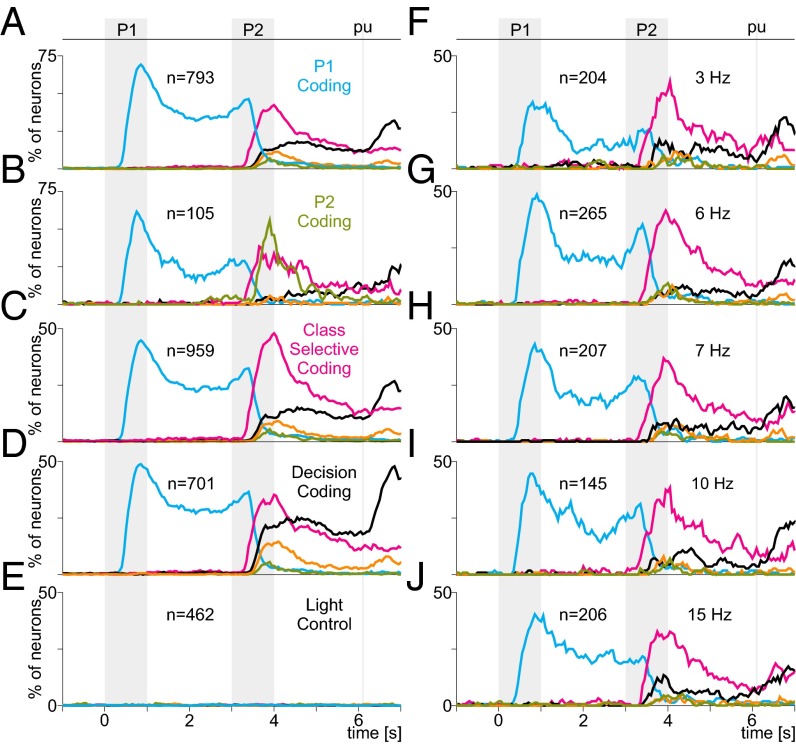
The problem of neural coding in perceptual decision making revolves around two fundamental questions: (i) How are the neural representations of sensory stimuli related to perception, and (ii) what attributes of these neural responses are relevant for downstream networks, and how do they influence decision making? We studied these two questions by recording neurons in primary somatosensory (S1) and dorsal premotor (DPC) cortex while trained monkeys reported whether the temporal pattern structure of two sequential vibrotactile stimuli (of equal mean frequency) was the same or different. We found that S1 neurons coded the temporal patterns in a literal way and only during the stimulation periods and did not reflect the monkeys' decisions. In contrast, DPC neurons coded the stimulus patterns as broader categories and signaled them during the working memory, comparison, and decision periods. These results show that the initial sensory representation is transformed into an intermediate, more abstract categorical code that combines past and present information to ultimately generate a perceptually informed choice.

Keywords: behaving monkeys; categorical code; dorsal premotor cortex; pattern discrimination; somatosensory cortex.


Conflict of interest statement

The authors declare no conflict of interest.

Figures

Fig. 1.
Fig. 1.
TPDT and recording sites. (A) Sequence of events in each trial. The mechanical probe is lowered (pd), indenting (500 μm) the glabrous skin of one fingertip of the right, restrained hand; the monkey places its free hand on an immovable key (kd). After a variable delay (2–4 s), the probe oscillates vertically, generating one of two possible stimulus patterns [P1, either grouped pulses (G) or extended pulses (E); individual mechanical pulses lasted 20 ms; 1 s of stimulus duration]. After a fixed delay (memory delay, 2 s), a second stimulus is delivered, again at two possible pattern configurations (P2, either G or E; 1 s of stimulus duration); after a second fixed delay (decision delay, 2 s) between the end of P2 and the probe up (pu), the monkey releases the key (ku) and presses with its free hand either the lateral or medial push button (pb) to indicate whether the P1 and P2 were the same or different. P1 and P2 always had equal mean frequency. (B) Discrimination performance for each block of trials of equal mean frequency. Each block consisted of four possible combinations of patterns, as illustrated in A. (C) Top (Left), lateral (Top Right), and coronal (Bottom Right) views of the brain locations where single neurons were recorded. Recordings were made in area 3b of S1 (contralateral to stimulated finger, gray spots) and in dorsal premotor cortex (DPC, both hemispheres, contralateral and ipsilateral to the stimulated finger, orange spots).
Fig. 2.
Fig. 2.
S1 responses during the pattern discrimination task. (A) Raster plots of one representative neuron during TPDT consisting of five pulses delivered in 1 s. Each row of ticks is one trial, and each tick is an action potential. Trials were randomly delivered but have been sorted into four pattern combinations of 20 trials each. Stimulus patterns are shown at the top of each row with the following color code: class 1 (red, G-G), class 2 (orange, G-E), class 3 (green, E-G) and class 4 (blue, E-E). Traces below the raster plots are peristimulus time histograms (constructed with time window of 50 ms displaced every 10 ms). (B) Normalized population activity from n = 161 neurons.
Fig. S1.
Fig. S1.
Related to Fig. 2. S1 responses for different stimulation frequencies. Normalized population activity for three different mean frequencies (3, 7, and 15 Hz). Hit trials (AC) were analyzed separately from error trials (DF). For each trial class, the difference between hits vs. errors was measured using the integral square error, which was quite small (from 0.5 to 2.0%).
Fig. 3.
Fig. 3.
Comparison of S1 responses across temporal patterns. (A) Firing rate elicited by pattern G (x axis) is compared against firing rate evoked by pattern E (y axis). Each dot corresponds to one neuron tested (n = 161). Diagonal line (45°) indicates equality between x and y axes. Inset histograms show angular distributions for stimulus P1 (Left) and P2 (Right). (B) Mean pattern information carried by S1 neurons, measured in bits (SI Materials and Methods), as a function of window size (50–1,000 ms in steps of 50 ms) during P1 (Left, cyan) and P2 (Right, light green). (C) Mean pattern information as a function of time (window size was 200 ms). Optimal integration time was 340 ms from stimuli onset. (D) Percentage of S1 neurons with significant pattern information during P1 (cyan) and P2 (light green) as a function of window size. Optimal integration window was 200 ms for both stimuli.
Fig. 4.
Fig. 4.
Classification of coding responses. Coding responses were defined according to specific profiles of significant differences (1) and statistical equalities (0) between classes (ROC analysis, P < 0.05). Trial classes were labeled from 1 to 4 depending on the pattern combinations: c1 in red, G-G; c2 in orange, G-E; c3 in green, E-G; and c4 in blue, E-E, where G denotes grouped stimulus pulses and E denotes extended stimulus pulses. Each row corresponds to the comparison of two classes, or stimulus pair combinations (first and second columns). Each binary entry indicates the result of the corresponding comparison for that row, and the binary words composed of the six digits of each column represent the possible coding profiles of the cells, based on all six possible class comparisons. The coding profiles refer to coding of the first (P1) and second (P2) stimulus patterns (third and fourth columns, respectively), coding of one specific class (fifth to eighth columns), coding the decision partially (same or different but distinguishing between E-G and G-E combinations, or between E-E and G-G combinations; ninth and 10th columns), and coding the complete decision [same (P1 = P2) or different (P1 ≠ P2); 10th column].
Fig. 5.
Fig. 5.
S1 population activity in relation to behavior. (A) Times at which individual neurons significantly discriminated G vs. E patterns. Each row corresponds to one cell. Colored lines indicate times with significant level for comparisons based on P1 (cyan) and P2 (light green). Responses were calculated in consecutive bins of 200 ms displaced every 50 ms (n = 161). (B) Percentage of neurons with significant pattern coding as a function of time. Note increase confined to the stimulation periods, and absence of signal during the working memory and decision periods. (C) Percentage of neurons with significant pattern coding as a function of time during a control task in which the correct response was visually cued (n = 92). (D) Mean choice probability for the same population of S1 neurons (n = 161).
Fig. S2.
Fig. S2.
Related to Fig. 5. Comparison of S1 responses during hits, errors, and control trials. (A) Normalized population activity for hits, (B) errors, and (C) light control trials. For each trial class, differences between conditions were calculated using the integral square error and were quite small (from 0.5 to 1.5%).
Fig. 6.
Fig. 6.
Single neuron activity in DPC during the pattern discrimination task. (AD) Raster plots of four example neurons sorted according to the four possible combinations of G and E stimulus patterns delivered during P1 and P2. The resulting four classes are c1 (G-G, red), c2 (G-E, orange), c3 (E-G, green), and c4 (E-E, blue). Each row of ticks is one trial, and each tick is an action potential. Trials were randomly delivered and were sorted by class afterward (only 10 out of 20 trials per class are shown). Correct and incorrect trials are indicated by black and purple ticks, respectively. Horizontal colored bars below rasters indicate times at which the neurons carried a significant signal (Fig. 4) encoding the pattern presented during P1 (cyan), the pattern presented during P2 coding (light green; not shown here), the class (pink), the decision partially (light orange), or the complete decision (black).
Fig. S3.
Fig. S3.
Related to Figs. 6 and 7. (AD) Additional single-unit DPC responses during the pattern discrimination task. Plots show activity of four single neurons in DPC in the same format as in Fig. 6.
Fig. S4.
Fig. S4.
Related to Figs. 6–8. Single-neuron responses in DPC for different stimulus frequencies. (AC) Raster plots of three example neurons in the same format as in Fig. 6. In each panel, the three columns correspond to the activity of the same cell evoked by similar trial classes (E, G combinations) with different mean frequencies (5, 10, and 15 Hz). Note the consistency of each cell’s coding properties across frequencies.
Fig. 7.
Fig. 7.
Population coding dynamics in DPC during pattern discrimination. (A) Times at which individual DPC neurons carried a significant signal. Horizontal colored lines indicate time bins encoding (Fig. 4) the first pattern (P1 cyan), the second pattern (P2 light green), the trial class (pink), the decision partially (light orange), or the complete decision (black). Each row corresponds to a single neuron. (B) Percentage of neurons with significant encoding as a function of time. (C) Results for class-selective neurons sorted according to specific classes: class 1 (red, n = 241), class 2 (orange, n = 219), class 3 (green, n = 263), and class 4 (blue, n = 236). (D) Percentage of neurons with significant class-selective coding as a function of time.
Fig. 8.
Fig. 8.
Selectivity of DPC coding profiles. (AD) Percentage of neurons with a significant signal as a function of time (mean frequency of 5 Hz). Different panels include different subsets of neurons selected according to their selectivity. (A) Neurons significantly encoding the first pattern (cyan; n = 793). A large percentage of these neurons were also selective for class (pink), but very few encoded the second pattern (light green). Orange and black traces indicate partial and complete coding of the decision, respectively. (B) Neurons significantly encoding the second pattern (light green; n = 105). A large percentage of these neurons were also selective for the first pattern (cyan) and for class (pink), but few encoded the decision (orange, black). (C) Neurons significantly encoding trial class (pink; n = 959). Many of these neurons also encoded the first pattern (cyan), almost none encoded the second (light green), and only a few encoded the decision (orange, black). (D) Neurons carrying a complete, significant decision signal (black; n = 701). Many of these neurons also encoded the first pattern (cyan) and the trial class (pink), and virtually none encoded the second pattern (light green). (E) Selectivity during the light control task. None of the neurons tested in this task (n = 462) showed significant selectivity to any of the components of the TPDT. (FJ) Percentages of neurons with significant encoding during blocks of trials with different mean frequencies. Numbers of cells and mean frequencies are indicated. Note similar selectivity profiles across frequencies.
Fig. S5.
Fig. S5.
Related to Figs. 6 and 8. DPC activity in the control condition. (AD) Raster plots of the same four example neurons shown in Fig. 6 but recorded during the light control task, in which identical tactile stimuli were delivered but the correct choice was visually cued. There were no incorrect trials. No significant coding (Fig. 4) was found in any of the four neurons in this condition.
Fig. 9.
Fig. 9.
DPC coding in hit vs. error trials. Z-score distributions [P(z|class)] for hit (Left) and error trials (Right) for different subsets of neurons. Z-scores indicate normalized differences between responses to different classes, accumulated across cells and time bins. (A) Z-scores based on the responses of P1 coding neurons. Trace colors correspond to the classes illustrated at the top. The strong selectivity observed during hit trials (Left, P < 0.01, ROC test) disappeared in error trials (Right, P > 0.1). (BE) Z-scores based on the responses of class-selective. In hit trials (Left), all z-score distributions from the preferred class were statistically different from the rest (P < 0.01), and no statistical differences were found between the distributions of nonpreferred classes (P > 0.1). In error trials (Right), the distributions were statistically different (P < 0.05) for classes with different decision outcome as the preferred class (P2 ≠ P1 in c1 and c4 coding neurons; P2 = P1 in c2 and c3 coding neurons) but were the same for classes with the same decision outcome as the preferred class (P > 0.1). (F) Z-scores based on the responses of decision-selective neurons. Z-score distributions are significantly different (P < 0.01) between P2 = P1 vs. P2 ≠ P1 classes during both hit (Left) and error trials (Right). The response distributions show a switch in the sign of the z-score as a result of a switch (correct–incorrect) in the decision outcome.
Fig. S6.
Fig. S6.
Related to Fig. 9. Population encoding during hits vs. errors as a function of time. (A) Mean z-scored activity from neurons and time bins with significant P1 coding. Trials were sorted according to the type of temporal pattern delivered during the first stimulus (P1): grouped (G, red) or extended (E, blue), in correct (dark colors) or incorrect (light colors) trials. Resulting P(z|P1) distributions were statistically different between hit trials (P < 0.01, AUROC = 0.79) but not between error trials (P > 0.1, AUROC = 0.52). (B) Mean z-scored activity from neurons and time bins with P2 coding. Same color code as in A. Z-score distributions were significantly different between hit trials (P < 0.01, AUROC = 0.78) but not between error trials (P > 0.1, AUROC = 0.53). (C) Mean z-scored activity from neurons and time bins with significant class-selective coding. In this case, activity was sorted into two groups of trials: those of the preferred class (red) and those of the three remaining nonpreferred classes (green). During hit trials (dark traces), the z-score distributions were statistically different for the preferred vs. nonpreferred groups (P < 0.01, AUROC = 0.76). During error trials (light traces) a small statistical difference was found (P < 0.05, AUROC = 0.57). (D and E) Z-scores for complete (D) and patial (E) decision-coding responses. In this case, trials were sorted according to decision outcome: P2 = P1 (green traces) or P2 ≠ P1 (orange traces). Both trial types, hits (dark traces) and errors (light traces), showed significant differences between z-score distributions (hits: P < 0.01, AUROC = 0.78; errors: P < 0.01, AUROC = 0.76). Consistent with encoding of the motor choice, however, in this case there was a switch in the sign of the z-score, whereby P2 = P1 correct trials exhibited similar activity as P2 ≠ P1 incorrect responses, and vice versa.
Fig. S7.
Fig. S7.
Related to Results. Time course of DPC decision coding. (A) Mean z-scored activity as a function of time for neurons (n = 314) with at least 20 time bins (1 s) with significant decision coding. Responses were divided according to P2 = P1 (green traces) and P2 ≠ P1 (orange traces) preferences, and further split into hit (dark traces) and error trials (light traces). (B) Mean choice probability for the same population of DPC neurons (n = 314). (CE) Z-score distributions during three different time periods. Before the second stimulus appeared (P2), it was impossible to determine the choice, or whether it was correct or not (C). From t = 3.42 s (dashed line in A and B) until the end of the second stimulus, the distributions showed a significant difference between choices in both hit and error trials (D; P < 0.05, AUROC = 0.65). Those differences increased thereafter (E; P < 0.01, ROC = 0.81).

References

    1. Romo R, Salinas E. Touch and go: Decision-making mechanisms in somatosensation. Annu Rev Neurosci. 2001;24:107–137. - PubMed
    1. Romo R, Salinas E. Flutter discrimination: Neural codes, perception, memory and decision making. Nat Rev Neurosci. 2003;4(3):203–218. - PubMed
    1. Romo R, de Lafuente V. Conversion of sensory signals into perceptual decisions. Prog Neurobiol. 2013;103:41–75. - PubMed
    1. Mountcastle VB, Talbot WH, Sakata H, Hyvärinen J. Cortical neuronal mechanisms in flutter-vibration studied in unanesthetized monkeys. Neuronal periodicity and frequency discrimination. J Neurophysiol. 1969;32(3):452–484. - PubMed
    1. Mountcastle VB, Steinmetz MA, Romo R. Frequency discrimination in the sense of flutter: Psychophysical measurements correlated with postcentral events in behaving monkeys. J Neurosci. 1990;10(9):3032–3044. - PMC - PubMed

Publication types

LinkOut - more resources