. 2016 Dec 6;113(49):13977-13982.
doi: 10.1073/pnas.1606117113. Epub 2016 Nov 21.

US daily temperature records past, present, and future

Affiliations

US daily temperature records past, present, and future

Gerald A Meehl et al. Proc Natl Acad Sci U S A. .

Abstract

Observed temperature extremes over the continental United States can be represented by the ratio of daily record high temperatures to daily record low minimum temperatures, and this ratio has increased to a value of about 2 to 1, averaged over the first decade of the 21st century, albeit with large interannual variability. Two different versions of a global coupled climate model (CCSM4), as well as 23 other coupled model intercomparison project phase 5 (CMIP5) models, show larger values of this ratio than observations, mainly as a result of greater numbers of record highs since the 1980s compared with observations. This is partly because of the "warm 1930s" in the observations, which made it more difficult to set record highs later in the century, and partly because of a trend toward less rainfall and reduced evapotranspiration in the model versions compared with observations. We compute future projections of this ratio on the basis of its estimated dependence on mean temperature increase, which we find robustly at play in both observations and simulations. The use of this relation also has the advantage of removing dependence of a projection on a specific scenario. An empirical projection of the ratio of record highs to record lows is obtained from the nonlinear relationship in observations from 1930 to 2015, thus correcting downward the likely biased future projections of the model. For example, for a 3 °C warming in US temperatures, the ratio of record highs to lows is projected to be ∼15 ± 8 compared to the present average ratio of just over 2.

Keywords: global warming; large ensemble; temperature extremes; temperature records.


Conflict of interest statement

The authors declare no conflict of interest.

Figures

Fig. 1.
Fig. 1.
(A) Time series for the 20th century and early 21st century of the ratio of daily record highs to record lows for the large ensemble (LE) simulations. Gray dots are values from individual ensemble members, red dots are median values for each year, and black dots are observations (OBS). (B) Same as A, except for half-degree (HDEG) model. (C) Extended time series of A for large ensemble to 2100 following RCP8.5. (D) Same as C, except for half-degree model.
Fig. 2.
Fig. 2.
(A) Time series of record highs starting in 1930 for large ensemble. Gray dots are values from individual ensemble members, red dots are median values for each year, and black dots are observations; blue line is theoretical expected values from 1/n relationship noted in text. (B) Same as A, except for half-degree model. (C) Same as A, except for record lows. (D) Same as B, except for record lows.
Fig. 3.
Fig. 3.
(A) Same as Fig. 2 except for observations only with 1930 start date to compile record highs (Upper) and lows (Lower) and a best-fit line (green line). (B) Same as A, except for 1950 start date. (C) Same as A, except for 1970 start date. (D) Histogram of JJA precipitation trends for observations, 1930–2015 (Upper), for large ensemble (Middle), and for half degree (Lower).
Fig. 4.
Fig. 4.
(A) Time series from 1930 to 2015 of observed annual mean (solid line) and smoothed (green line) surface air temperatures over the continental United States, and the annual ratio of record highs to record lows (dots). (B) Same as A, except for daily maximum temperatures. (C) Same as A, except for daily minimum temperatures.
Fig. S1.
Fig. S1.
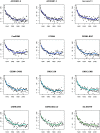
Time series of record highs starting in 1930 for 12 models from the CMIP5 archive (model names are panel labels). Black dots are annual values from an individual ensemble members for each model, the blue line is theoretical expected values from 1/n relationship noted in main text, and the colored line is an 11-y running average.
Fig. S2.
Fig. S2.
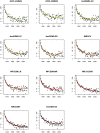
Same as Fig. S1 for an additional 11 CMIP5 models denoted by panel labels.
Fig. S3.
Fig. S3.
Same as Fig. 3A, except for record highs and record lows for December–January–February (DJF) (Left) and record highs and record lows for JJA (Right) from observations.
Fig. S4.
Fig. S4.
(A) Trends in Tmax from observations for JJA, 1930–2015. Green and blue dots indicate negative trends, orange and red dots indicate positive values (ranges for color scale at top of panel. (B) Histogram of observed Tmax trends: blue denotes negative trends, brown positive. (C) Trends in precipitation (Prec) from observations for JJA, green and blue dots indicate positive trends, orange and red dots indicate negative values (ranges for color scale at top of panel); note different color scale from Tmax trends in A. (D) Histogram of observed precipitation trends. Blue denotes positive trends, brown negative. Note different color scale from Tmax trends in B.
Fig. S5.
Fig. S5.
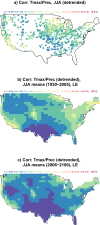
(A) Correlation of detrended observed Tmax and precipitation time series, 1930–2015. Blue and green dots denote negative correlation values; orange and red positive values (ranges for color scale at top of panel). (B) Same as A, except for large ensemble model simulations, 1930–2005. (C) Same as B, except for future projections from large ensemble simulations, 2006–2100. Correlation values from the large ensemble are computed by concatenating the individual grid-point values of the 30 ensemble members and then computing a single correlation between the corresponding two long vectors of trend values.
Fig. S6.
Fig. S6.
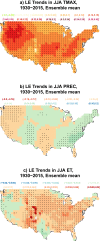
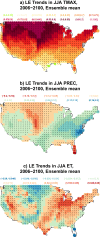
(A) Trends for JJA for Tmax from the large ensemble climate model simulations, 1930–2015, °C/decade. Dark red dots indicate largest amplitude positive trends (value ranges for color scale at top of panel). (B) Same as A, except for precipitation, mm⋅day−1/decade. Dark green dots indicate largest amplitude positive trends (note different color scale than in A. (C) Same as A, except for evapotranspiration, mm⋅day−1/decade. Dark red dots indicate largest amplitude positive trends (note different color scale than in B).
Fig. S7.
Fig. S7.
(AC) Same as Fig. S6, except for future climate, 2006–2100.
Fig. 5.
Fig. 5.
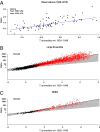
Nonlinear fits as log plots of the ratio of daily record highs to record lows as a function of US mean temperature increase for (A) observations 1930–2015. (B) Large ensemble 1930–2100 with extensions of empirical fit from observations in A to 2100. (C) Same as B, except for half-degree 1930–2100. Gray-shaded ranges delimit the fits, using the smallest and largest values of the coefficient from the 1930/1950/1970 fits, plus or minus two times the (common) SD. The R2 values are given in figure panels. Black dots are individual annual values from 1930–2015, red dots for 2016–2100.
Fig. S8.
Fig. S8.
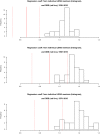
Histograms of the values of the regression coefficient of the log-linear relationship between record-ratio and average temperature, when fitted to the 30 LE ensemble members (denoted “LENS” for “large ensemble” in panel titles) separately, compared with the value for the observed (OBS) relationship (solid red line) and its 95% confidence interval (dashed red lines). (Upper) Using 1930–2015 period from model and observations. (Middle) Using 1950–2015. (Lower) Using 1970–2015.

References

    1. Meehl GA, Tebaldi C, Walton G, Easterling D, McDaniel L. The relative increase of record high maximum temperatures compared to record low minimum temperatures in the U.S. Geophys Res Lett. 2009;36:L23701.
    1. Rahmstorf S, Coumou D. Increase of extreme events in a warming world. Proc Natl Acad Sci USA. 2012;109:17905–17909. - PMC - PubMed
    1. Rowe CM, Derry LE. Trends in record-breaking temperatures for the conterminous United States. Geophys Res Lett. 2012;39:L16703.
    1. Beniston M. Ratios of record high to record low temperatures in Europe exhibit sharp increases since 2000 despite a slowdown in the rise of mean temperatures. Clim Change. 2015;129:225–237.
    1. Trewin BC, Vermont H. Changes in the frequency of record temperatures in Australia, 1957-2009. Aust Meteorol Oceanogr J. 2010;60:113–119.

Publication types

LinkOut - more resources