. 2016 Dec 6;113(49):E7908-E7916.
doi: 10.1073/pnas.1617789113. Epub 2016 Nov 21.

Paired quantitative and qualitative assessment of the replication-competent HIV-1 reservoir and comparison with integrated proviral DNA

Affiliations

Paired quantitative and qualitative assessment of the replication-competent HIV-1 reservoir and comparison with integrated proviral DNA

Julio C C Lorenzi et al. Proc Natl Acad Sci U S A. .

Erratum in

Abstract

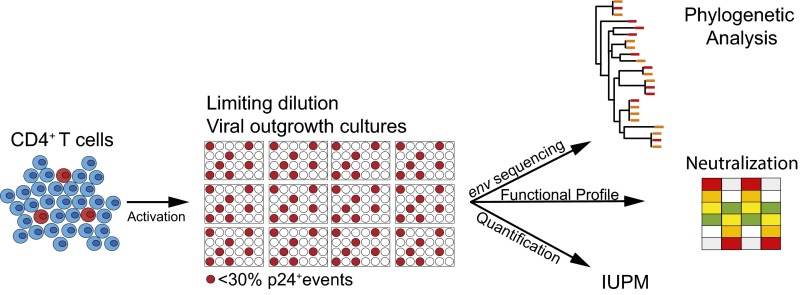
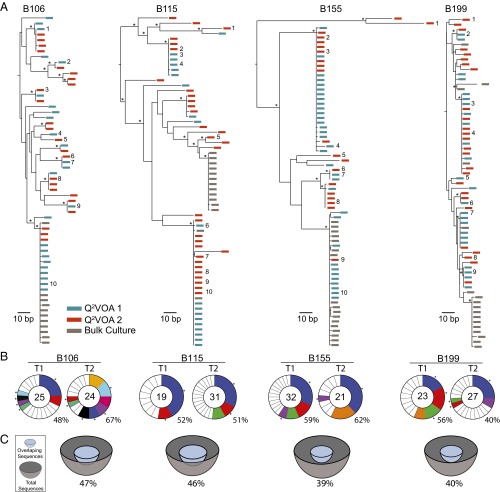
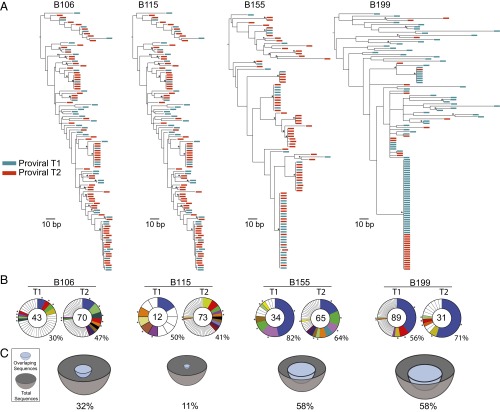
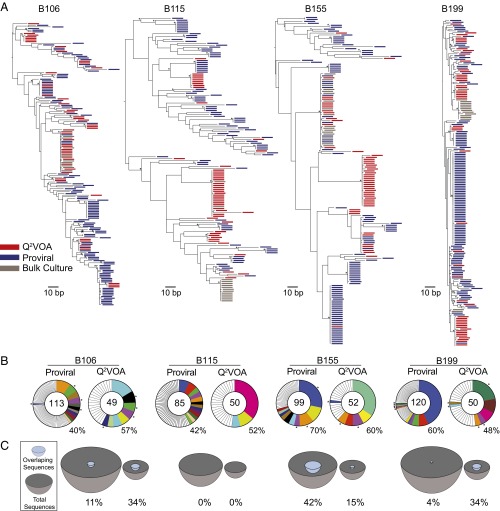
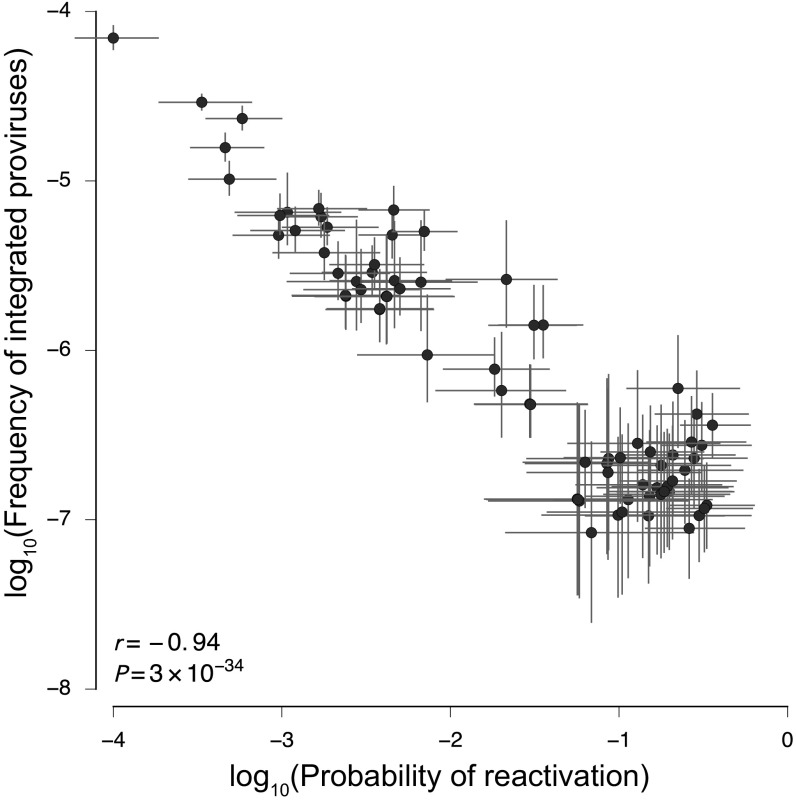
HIV-1-infected individuals harbor a latent reservoir of infected CD4+ T cells that is not eradicated by antiretroviral therapy (ART). This reservoir presents the greatest barrier to an HIV-1 cure and has remained difficult to characterize, in part, because the vast majority of integrated sequences are defective and incapable of reactivation. To characterize the replication-competent reservoir, we have combined two techniques, quantitative viral outgrowth and qualitative sequence analysis of clonal outgrowth viruses. Leukapheresis samples from four fully ART-suppressed, chronically infected individuals were assayed at two time points separated by a 4- to 6-mo interval. Overall, 54% of the viruses emerging from the latent reservoir showed gp160 env sequences that were identical to at least one other virus. Moreover, 43% of the env sequences from viruses emerging from the reservoir were part of identical groups at the two time points. Groups of identical expanded sequences made up 54% of proviral DNA, and, as might be expected, the sequences of replication-competent viruses in the active reservoir showed limited overlap with integrated proviral DNA, most of which is known to represent defective viruses. Finally, there was an inverse correlation between proviral DNA clone size and the probability of reactivation, suggesting that replication-competent viruses are less likely to be found among highly expanded provirus-containing cell clones.

Keywords: HIV; culture; method; replication-competent; reservoir.


Conflict of interest statement

The authors declare no conflict of interest.

Figures

Fig. 1.
Fig. 1.
Quantitative and qualitative analysis of the replication-competent reservoir. Diagrammatic representation of the assay. CD4+ T cells are cultured at a limiting dilution under conditions whereby a single virus emerges from the latent reservoir in each positive well (red). The number of infectious units per million (IUPM) is determined directly from the number of p24-positive wells. Virus-containing supernatants from positive cultures are harvested for env sequencing and neutralization assays.
Fig. 2.
Fig. 2.
Env sequences from outgrowth cultures. (A) Maximum likelihood phylogenetic trees of full-length env sequences of viruses from Q2VOA outgrowth cultures from four individuals. Viruses from time point 1 are green, viruses from time point 2 are red, and bulk culture SGA is gray. Asterisks indicate nodes with significant bootstrap values (bootstrap support ≥ 70%). Numbers next to sequences correspond to viruses assayed for neutralization in Fig. 6. (B) Pie charts depict the distribution of culture-derived env sequences from the two time points. The number in the inner circle indicates the total number of env sequences analyzed. White represents sequences isolated only once across both time points, and colored areas represent identical sequences that appear more than once. The size of the pie slice is proportional to the number of sequences in the clone. Clones found at both time points are the same color and denoted by asterisks. Percentages of identical sequences are displayed at the bottom right of each pie chart. (C) Representation of overlapping sequences between the two time points. The size of the hemisphere is proportional to the number of sequences. Light blue hemispheres represent overlapping sequences and gray hemispheres represent the total number of sequences. The percentage of overlap is indicated at the bottom of each hemisphere.
Fig. S1.
Fig. S1.
Maximum likelihood phylogenetic tree was constructed from viral env sequences from outgrowth culture supernatants as well as archived proviral DNA from all participants. Hypervariable (as defined in https://www.hiv.lanl.gov/content/sequence/VAR_REG_CHAR/) and other poorly aligned regions were excluded from the analysis. The tree was constructed using RAxML v. 8.0.22 (55) with a GTRGAMMA substitution model, with 1,000 bootstrap replicates and midpoint rooted.
Fig. 3.
Fig. 3.
Env sequences from archived proviral DNA. (A) Maximum likelihood phylogenetic trees of full-length env sequences derived by SGA from primary CD4+ T cells from four individuals. Viruses from time point 1 are green, and viruses from time point 2 are red. Asterisks indicate nodes with significant bootstrap values (bootstrap support ≥ 70%). (B) Pie charts depict the distribution of archived env sequences from the two time points. The number in the inner circle indicates the total number of env sequences analyzed. White represents unique sequences isolated only once across both time points, and colored areas represent identical sequences that appear more than once. The size of the pie slice is proportional to the number of sequences in the clone. Clones found at both time points are the same color and denoted by asterisks. Percentages of identical sequences are displayed at the bottom right of each pie chart. (C) Representation of overlapping sequences between the two time points. The size of the hemisphere is proportional to the number of sequences. Light blue hemispheres represent overlapping sequences and gray hemispheres represent the total number of sequences. The percentage of overlap is indicated at the bottom of each hemisphere.
Fig. 4.
Fig. 4.
Comparison of env sequences from archived proviruses and replication-competent viruses. Sequences from the two time points were pooled for each patient. (A) Maximum likelihood phylogenetic trees of env sequences. Limiting dilution outgrowth viruses are red, bulk culture viruses are gray, and viral sequences amplified from primary CD4+ T cells are blue. Asterisks indicate nodes with significant bootstrap values (bootstrap support ≥ 70%). (B) Pie charts depicting the distribution of archived proviruses and culture-derived sequences. The numbers in the inner circles indicate the total number of env sequences analyzed. White represents sequences isolated only once, and colored areas represent identical sequences. The size of the pie slice is proportional to the number of sequences in the clone. Clones found in proviral DNA and outgrowth cultures are the same color and denoted by asterisks. Percentages of identical groups of sequences are displayed at the bottom right of each pie chart. (C) Representation of overlapping sequences between the two sources. The size of the hemisphere is proportional to the number of sequences. Light blue hemispheres represent overlapping sequences and gray hemispheres represent the total number of sequences. The percentage of overlap is indicated at the bottom of each hemisphere.
Fig. 5.
Fig. 5.
Negative correlation between proviral clone size and probability of reactivation in culture. The frequency of integrated provirus (p) is negatively correlated with its probability of reactivation in culture (r). Bars denote interquartile ranges of posterior parameter estimates. The Pearson correlation is computed using median values for large clones. Clones with diverse frequencies and reactivation probabilities are observed in each patient.
Fig. 6.
Fig. 6.
Sensitivity of latent viruses to bNAbs. (A) Table shows antibody concentration that inhibits infection by 80% (IC80) titers for selected outgrowth culture viruses (Fig. 2A) against a panel of bNAbs indicated at the top determined by TZM.bl assay. Viruses with low median tissue culture infectious dose (TCID50) titers could not be tested against the entire bNAb panel (red, IC80 of 0–0.1 μg/mL; orange, IC80 of 0.1–1.0 μg/mL; yellow, IC80 of 1.0–10 μg/mL; green, IC80 of 10–50 μg/mL). NT, not tested. (B) Graph shows combined IC80 titers across all four patients for each bNAb. Each dot represents one virus.
Fig. S2.
Fig. S2.
Maximum likelihood phylogenetic tree was constructed from viral env sequences from outgrowth culture supernatants for each participant. Viruses from time point 1 are red, viruses from time point 2 are orange, and bulk culture viruses are green. Asterisks indicate nodes with significant bootstrap values (bootstrap support ≥ 70%). Tables beneath each tree show concentration that inhibits response by 80% (IC80) titers for selected outgrowth culture viruses (red, IC80 of 0–0.1 μg/mL; orange, IC80 of 0.1–1.0 μg/mL; yellow, IC80 of 1.0–10 μg/mL; green, IC80 of 10–50 μg/mL). NT, not tested.
Fig. S2.
Fig. S2.
Maximum likelihood phylogenetic tree was constructed from viral env sequences from outgrowth culture supernatants for each participant. Viruses from time point 1 are red, viruses from time point 2 are orange, and bulk culture viruses are green. Asterisks indicate nodes with significant bootstrap values (bootstrap support ≥ 70%). Tables beneath each tree show concentration that inhibits response by 80% (IC80) titers for selected outgrowth culture viruses (red, IC80 of 0–0.1 μg/mL; orange, IC80 of 0.1–1.0 μg/mL; yellow, IC80 of 1.0–10 μg/mL; green, IC80 of 10–50 μg/mL). NT, not tested.

Similar articles

Cited by

References

    1. Chun TW, et al. Presence of an inducible HIV-1 latent reservoir during highly active antiretroviral therapy. Proc Natl Acad Sci USA. 1997;94(24):13193–13197. - PMC - PubMed
    1. Finzi D, et al. Latent infection of CD4+ T cells provides a mechanism for lifelong persistence of HIV-1, even in patients on effective combination therapy. Nat Med. 1999;5(5):512–517. - PubMed
    1. Crooks AM, et al. Precise quantitation of the latent HIV-1 reservoir: Implications for eradication strategies. J Infect Dis. 2015;212(9):1361–1365. - PMC - PubMed
    1. Hughes SH, Coffin JM. What integration sites tell us about HIV Persistence. Cell Host Microbe. 2016;19(5):588–598. - PMC - PubMed
    1. Churchill MJ, Deeks SG, Margolis DM, Siliciano RF, Swanstrom R. HIV reservoirs: What, where and how to target them. Nat Rev Microbiol. 2016;14(1):55–60. - PubMed

Publication types