. 2017 Apr;18(2):227-245.
doi: 10.1007/s10162-016-0598-0. Epub 2016 Nov 21.

Quantitative Analysis of Supporting Cell Subtype Labeling Among CreER Lines in the Neonatal Mouse Cochlea

Affiliations

Quantitative Analysis of Supporting Cell Subtype Labeling Among CreER Lines in the Neonatal Mouse Cochlea

Melissa M McGovern et al. J Assoc Res Otolaryngol. 2017 Apr.

Abstract

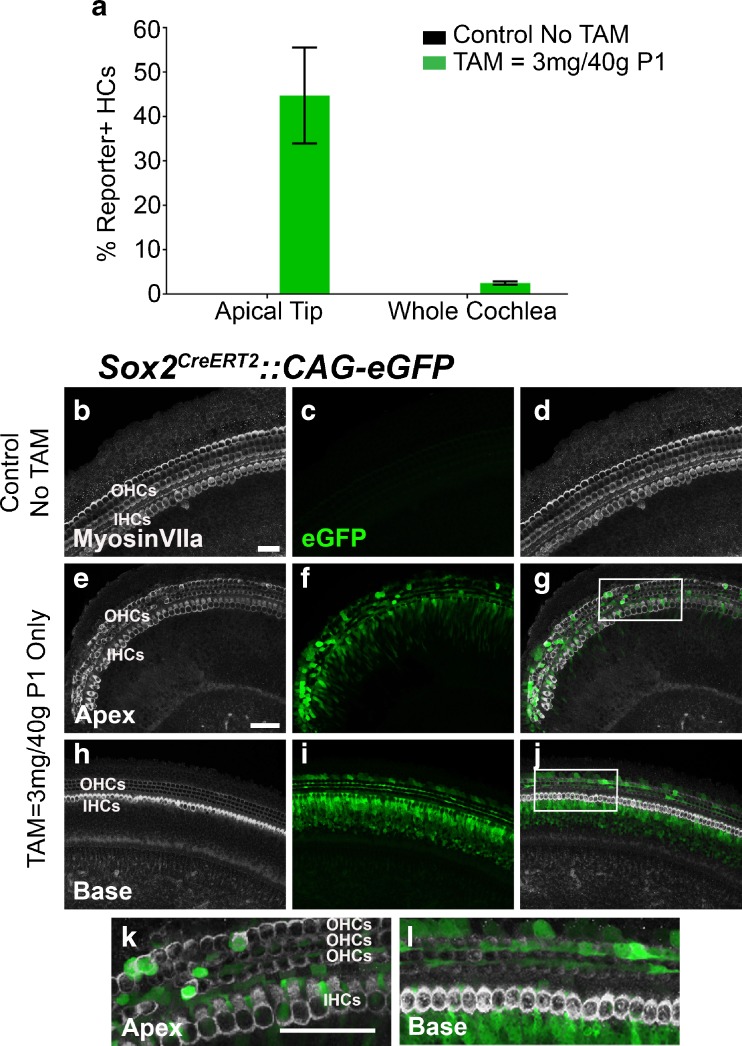
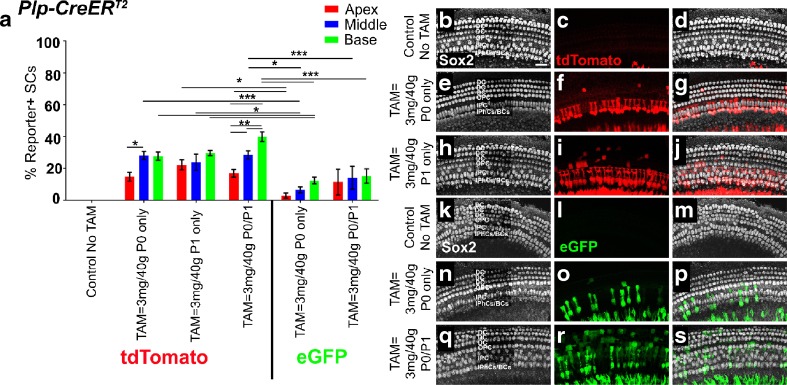
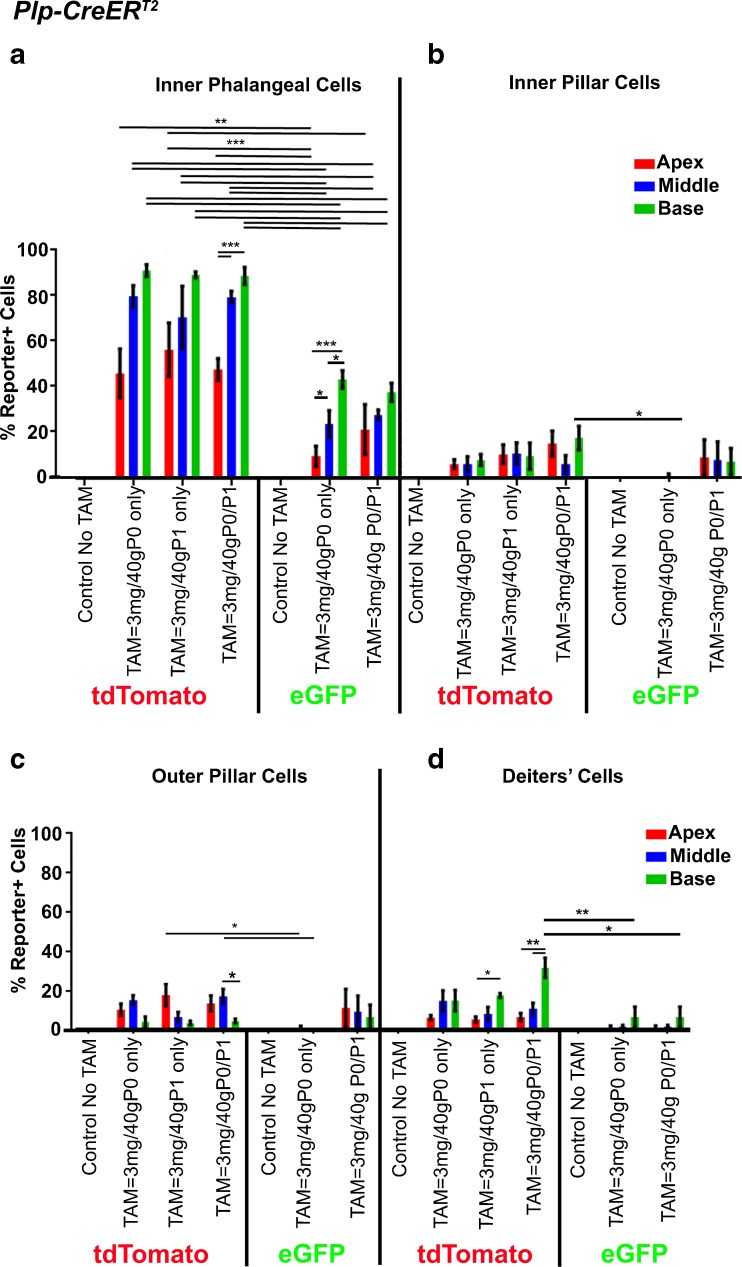
Four CreER lines that are commonly used in the auditory field to label cochlear supporting cells (SCs) are expressed in multiple SC subtypes, with some lines also showing reporter expression in hair cells (HCs). We hypothesized that altering the tamoxifen dose would modify CreER expression and target subsets of SCs. We also used two different reporter lines, ROSA26 tdTomato and CAG-eGFP, to achieve the same goal. Our results confirm previous reports that Sox2 CreERT2 and Fgfr3-iCreER T2 are not only expressed in neonatal SCs but also in HCs. Decreasing the tamoxifen dose did not reduce HC expression for Sox2 CreERT2 , but changing to the CAG-eGFP reporter decreased reporter-positive HCs sevenfold. However, there was also a significant decrease in the number of reporter-positive SCs. In contrast, there was a large reduction in reporter-positive HCs in Fgfr3-iCreER T2 mice with the lowest tamoxifen dose tested yet only limited reduction in SC labeling. The targeting of reporter expression to inner phalangeal and border cells was increased when Plp-CreER T2 was paired with the CAG-eGFP reporter; however, the total number of labeled cells decreased. Changes to the tamoxifen dose or reporter line with Prox1 CreERT2 caused minimal changes. Our data demonstrate that modifications to the tamoxifen dose or the use of different reporter lines may be successful in narrowing the numbers and/or types of cells labeled, but each CreER line responded differently. When the ROSA26 tdTomato reporter was combined with any of the four CreER lines, there was no difference in the number of tdTomato-positive cells after one or two injections of tamoxifen given at birth. Thus, tamoxifen-mediated toxicity could be reduced by only giving one injection. While the CAG-eGFP reporter consistently labeled fewer cells, both reporter lines are valuable depending on the goal of the study.

Keywords: CAG-eGFP; Cre/loxP; Fgfr3-iCreER; Plp-CreER; Prox1-CreER; ROSA26-tdTomato; Sox2-CreER; mouse genetics.


Conflict of interest statement

All authors declare no conflict of interest on the present manuscript.

Figures

FIG. 1
FIG. 1
F gfr3-iCreER T2 is expressed in the majority of PCs/DCs. A Cross-sectional view of the mouse organ of Corti with SC subtypes highlighted in different colors. The tunnel of Corti is partially open to represent the immature state of the neonatal cochlea. GER, greater epithelial ridge; SGN, spiral ganglion neuron. B Quantification of total reporter-positive SCs in Fgfr3-iCreER T2/+ ::ROSA26 tdTomato/+ mice or Fgfr3-iCreER T2/+ ::CAG-eGFP +/loxP mice given different doses of tamoxifen (TAM). Cells were quantified in two randomly chosen 200 μm regions per cochlear turn, averaged, and expressed as a percentage of labeled cells compared to total cells. (**P < 0.01, ***P < 0.001 as determined by a two-way ANOVA F(3, 24) = 274.5 with a Tukey’s post hoc test) (N = 3–4). Representative confocal images of tdTomato (red) expression in Fgfr3-iCreER T2/+ ::ROSA26 tdTomato/+ controls without tamoxifen (CE) and those given various doses of tamoxifen (FH″′). Representative confocal images of eGFP (green) expression in Fgfr3-iCreER T2/+ ::CAG-eGFP +/loxP controls without tamoxifen (IK) and those given various doses of tamoxifen (LN″′). Optical cross sections showing that the location of tdTomato (H′H″′) and eGFP (N′N″′) expression is primarily in SCs. Scale bar in C is 25 μm and in H′ and N′ is 6.25 μm.
FIG. 2
FIG. 2
Fgfr3-iCreER T2/+ ::ROSA26 tdTomato/+ is robustly expressed in OHCs in an apical to basal gradient. A For quantification with the ROSA26 tdTomato/+ reporter line, the entire cochlea was imaged, measured, and divided into six equal sections. A, apex and B, base. B Quantification of reporter-positive OHCs in Fgfr3-iCreER T2/+ ::ROSA26 tdTomato/+ mice given different doses of tamoxifen (TAM). All cells were quantified in each of the six segments, averaged, and expressed as a percentage of labeled cells compared to total cells. (N = 3–4). Representative confocal images of tdTomato (red) expression in Fgfr3-iCreER T2/+ ::ROSA26 tdTomato/+ controls without tamoxifen (CE) and those given various doses of tamoxifen (FK). LM Higher magnification images from regions marked in H and K, respectively. Scale bars = 25 μm.
FIG. 3
FIG. 3
Fgfr3-iCreER T2/+ ::CAG-eGFP +/loxP labels fewer HCs except for the apical tip of the cochlea. A For quantification with the CAG-eGFP reporter line, the cochlea was divided into two sections: the apical most 250 μm and the rest of the cochlea. A, apex and B, base. B Quantification of reporter-positive OHCs in Fgfr3-iCreER T2/+ ::CAG-eGFP +/loxP mice given different doses of tamoxifen (TAM). All cells were quantified in the two segments, averaged, and expressed as a percentage of labeled cells compared to total cells. (*P = 0.0101, as determined by a paired Student’s t test t(2) = 9.867) (N = 3–4). Representative confocal images of eGFP (green) expression in Fgfr3-iCreER T2/+ ::CAG-eGFP +/loxP controls without tamoxifen (CE) and those given various doses of tamoxifen (FK). LM Higher magnification images from regions marked in H and K, respectively. Scale bars = 25 μm.
FIG. 4
FIG. 4
Sox2 CreERT2 is expressed in all SCs within the organ of Corti. A Quantification of total reporter-positive SCs in Sox2 CreERT2+/− ::ROSA26 tdTomato /+ mice or Sox2 CreERT2+/− ::CAG-eGFP +/loxP mice given different doses of tamoxifen (TAM). Cells were quantified in two randomly chosen 200 μm regions per cochlear turn, averaged, and expressed as a percentage of labeled cells compared to total cells. (***P < 0.0001 as determined by a two-way ANOVA F(4, 33) = 462.3 with a Tukey’s post hoc test) (N = 3–4). Representative confocal images of tdTomato (red) expression in Sox2 CreERT2+/− ::ROSA26 tdTomato /+ controls without tamoxifen (BD) and those given various doses of tamoxifen (EG″′). Representative confocal images of eGFP (green) expression in Sox2 CreERT2+/− ::CAG-eGFP +/loxP controls without tamoxifen (HJ) and those given various doses of tamoxifen (KM″′). Optical cross sections showing location of tdTomato (G′G″′) and eGFP (M′M″′) expression is in SCs and some HCs. Scale bar in B is 25 μm and in G′ and M′ is 6.25 μm.
FIG. 5
FIG. 5
Sox2 CreERT2+/− ::ROSA26 tdTomato /+ is expressed in a large number of HCs in a descending apical to basal gradient. A Quantification of reporter-positive HCs in Sox2 CreERT2+/− ::ROSA26 tdTomato /+ mice given different doses of tamoxifen (TAM). All cells were quantified in each of the six segments labeled in Fig. 2A, averaged, and expressed as a percentage of labeled cells compared to total cells. (For comparison of OHCs ***P = 0.00005 as determined by a Pearson correlation coefficient r 2 = 0.994, for comparison of IHCs ***P = 0.0003 as determined by a Pearson correlation coefficient r 2 = 0.985) (N = 3–4). Representative confocal images of tdTomato (red) expression in Sox2 CreERT2+/− ::ROSA26 tdTomato /+ controls without tamoxifen (BD) and those given various doses of tamoxifen (EJ). KL Higher magnification images from regions marked in G and J, respectively. Scale bars = 25 μm.
FIG. 6
FIG. 6
Sox2 CreERT2+/−::CAG-eGFP +/loxP labels fewer HCs except for the most apical tip of the cochlea. A Quantification of reporter-positive HCs in Sox2 CreERT2+/−::CAG-eGFP +/loxP mice given different doses of tamoxifen (TAM). All cells were quantified in the two segments labeled in Fig. 3A, averaged, and expressed as a percentage of labeled cells compared to total cells. (N = 3–4). Representative confocal images of eGFP (green) expression in Sox2 CreERT2+/−::CAG-eGFP +/loxP controls without tamoxifen (BD) and those given various doses of tamoxifen (EJ). KL Higher magnification images from regions marked in G and J, respectively. Scale bars = 25 μm.
FIG. 7
FIG. 7
Targeting of Plp-CreER T2 to IPhCs/BCs increased when the CAG-eGFP reporter was used. A Quantification of total reporter-positive SCs in the three cochlear turns of Plp-CreER T2/+ ::ROSA26 tdTomato /+ or Plp-CreER T2/+ ::CAG-eGFP +/loxP mice given different doses of tamoxifen (TAM). Cells were quantified in two randomly chosen 200 μm regions per cochlear turn, averaged, and expressed as a percentage of labeled cells compared to total cells. Representative confocal images of tdTomato (red) expression in Plp-CreER T2/+ ::ROSA26 tdTomato /+ controls without tamoxifen (BD) and those given various doses of tamoxifen (EJ). Representative confocal images of eGFP (green) expression in Plp-CreER T2/+ ::CAG-eGFP +/loxP controls without tamoxifen (KM) and those given various doses of tamoxifen (NS). Scale bar = 25 μm. (For comparison among cochlear turns within the same tamoxifen dosing paradigm: 3 mg/40 g tamoxifen dose at P0 only *P < 0.05 as determined by a one-way ANOVA F(1.016, 2.031) = 7.435 with a Tukey’s post hoc test, for the 3-mg/40-g tamoxifen dose at P0/P1 **P < 0.01 as determined by a one-way ANOVA F(1.346, 4.038) = 129.5 with a Tukey’s post hoc test. For comparison across tamoxifen dosing paradigms: *P < 0.05 and ***P < 0.001 as determined by a two-way ANOVA F(6, 44) = 40.9 with a Tukey’s post hoc test.) (N = 3–4).
FIG. 8
FIG. 8
Quantification of reporter expression among SC subtypes in Plp-CreER T2 mice. SC subtypes that expressed the tdTomato or eGFP reporter were quantified as described in 7A. A IPhCs/BCs (For comparison among cochlear turns within the same tamoxifen dosing paradigm: ROSA26 tdTomato reporter with tamoxifen at P0/P1 ***P < 0.001 as determined by a one-way ANOVA F(1.313, 3.940) = 71.03 with a Tukey’s post hoc test and CAG-eGFP +/loxP reporter with tamoxifen at P0 *P < 0.05, ***P < 0.001 as determined by a one-way ANOVA F(1.012, 2.025) = 268.8 with a Tukey’s post hoc test. For comparison across tamoxifen dosing paradigms: **P < 0.01 and ***P < 0.001 as determined by a two-way ANOVA F(6, 45) = 97.06 with a Tukey’s post hoc test). B IPCs (For comparison across tamoxifen dosing paradigms: *P < 0.05 as determined by a two-way ANOVA F(6, 45) = 6.017 with a Tukey’s post hoc test). C OPCs (For comparison across tamoxifen dosing paradigms: *P < 0.05 as determined by a two-way ANOVA F(6, 60) = 8.524 with a Tukey’s post hoc test). D DCs (For comparison among cochlear turns within the same tamoxifen dosing paradigm: ROSA26 tdTomato reporter with tamoxifen at P0/P1 *P < 0.05 as determined by a one-way ANOVA F(1.193, 3.579) = 39.29 with a Tukey’s post hoc test and ROSA26 tdTomato reporter with tamoxifen at P1 *P < 0.05 as determined by a one-way ANOVA F(2, 6) = 5.189 with a Tukey’s post hoc test. For comparison across tamoxifen dosing paradigms: *P < 0.05 and **P < 0.01 as determined by a two-way ANOVA F(6, 45) = 6.313 with a Tukey’s post hoc test) (N = 3–4).
FIG. 9
FIG. 9
Targeting of Prox1 CreERT2 to PCs and DCs was not altered with changes in tamoxifen induction paradigm. A Quantification of total reporter-positive SCs in the three cochlear turns of Prox1 CreERT2+/− ::ROSA26 tdTomato /+ or Prox1 CreERT2+/− ::CAG-eGFP +/loxP mice given different doses of tamoxifen (TAM). Cells were quantified in two randomly chosen 200 μm regions per cochlear turn, averaged, and expressed as a percentage of labeled cells compared to total cells. (For comparison among cochlear turns within the same tamoxifen dosing paradigm: 3 mg/40 g tamoxifen dose at P0/P1 *P < 0.05 as determined by a one-way ANOVA F(1.018, 2.036) = 37.08 with a Tukey’s post hoc test and 5 mg/40 g tamoxifen dose *P < 0.05 and **P < 0.01 as determined by a one-way ANOVA F(1, 2) = 144.1 with a Tukey’s post hoc test. For comparison across tamoxifen dosing paradigms: **P < 0.01 and ***P < 0.001 as determined by a two-way ANOVA F(4, 30) = 151.8 with a Tukey’s post hoc test) (N = 3–4). Representative confocal images of tdTomato (red) expression in Prox1 CreERT2+/− ::ROSA26 tdTomato /+ controls without tamoxifen (BD) and those given various doses of tamoxifen (EM). NP SC subtypes that expressed the tdTomato reporter were quantified as described in A. N IPCs (For comparison among cochlear turns within the same tamoxifen dosing paradigm: 3 mg/40 g tamoxifen dose at P0/P1 **P < 0.01 as determined by a one-way ANOVA F(1.021, 2.042) = 35.11 with a Tukey’s post hoc test and 5 mg/40 g tamoxifen dose *P < 0.05 as determined by a one-way ANOVA F(1.445, 2.890) = 47.77 with a Tukey’s post hoc test. For comparison across tamoxifen dosing paradigms: *P < 0.05, **P < 0.01, and ***P < 0.001 as determined by a two-way ANOVA F(4, 30) = 24.63 with a Tukey’s post hoc test). O OPCs (For comparison among cochlear turns within the same tamoxifen dosing paradigm: 5 mg/40 g tamoxifen dose *P < 0.05 as determined by a one-way ANOVA F(1.427, 2.854) = 37.35 with a Tukey’s post hoc test. For comparison across tamoxifen dosing paradigms: **P < 0.01 and ***P < 0.001 as determined by a two-way ANOVA F(4, 30) = 139.5 with a Tukey’s post hoc test). P DCs (For comparison among cochlear turns within the same tamoxifen dosing paradigm: 5 mg/40 g tamoxifen dose *P < 0.05, **P < 0.01 as determined by a one-way ANOVA F(1.156, 2.911) = 94.69 with a Tukey’s post hoc test. For comparison across tamoxifen dosing paradigms: ***P < 0.001 as determined by a two-way ANOVA F(4, 30) = 231.2 with a Tukey’s post hoc test). (N = 3–4). OQ Representative confocal images of a tdTomato-positive HC (arrow) in Prox1 CreERT2+/− ::ROSA26 tdTomato /+ mice given the highest dose of tamoxifen (5 mg/40 g, P0/P1). Scale bars = 25 μm.

Similar articles

Cited by

References

    1. Abrashkin KA, Izumikawa M, Miyazawa T, Wang CH, Crumling MA, Swiderski DL, Beyer LA, Gong TW, Raphael Y. The fate of outer hair cells after acoustic or ototoxic insults. Hear Res. 2006;218:20–29. doi: 10.1016/j.heares.2006.04.001. - DOI - PubMed
    1. Anttonen T, Belevich I, Kirjavainen A, Laos M, Brakebusch C, Jokitalo E, Pirvola U. How to bury the dead: elimination of apoptotic hair cells from the hearing organ of the mouse. J Assoc Res Otolaryngol. 2014;15:975–992. doi: 10.1007/s10162-014-0480-x. - DOI - PMC - PubMed
    1. Arnold K, Sarkar A, Yram MA, Polo JM, Bronson R, Sengupta S, Seandel M, Geijsen N, Hochedlinger K. Sox2(+) adult stem and progenitor cells are important for tissue regeneration and survival of mice. Cell Stem Cell. 2011;9:317–329. doi: 10.1016/j.stem.2011.09.001. - DOI - PMC - PubMed
    1. Bermingham-McDonogh O, Oesterle EC, Stone JS, Hume CR, Huynh HM, Hayashi T. Expression of Prox1 during mouse cochlear development. J Comp Neurol. 2006;496:172–186. doi: 10.1002/cne.20944. - DOI - PMC - PubMed
    1. Boettger T, Hubner CA, Maier H, Rust MB, Beck FX, Jentsch TJ. Deafness and renal tubular acidosis in mice lacking the K-Cl co-transporter Kcc4. Nature. 2002;416:874–878. doi: 10.1038/416874a. - DOI - PubMed

LinkOut - more resources