

Newborn Screening for Severe Primary Immunodeficiency Diseases in Sweden-a 2-Year Pilot TREC and KREC Screening Study
- PMID: 27873105
- PMCID: PMC5226987
- DOI: 10.1007/s10875-016-0347-5
Newborn Screening for Severe Primary Immunodeficiency Diseases in Sweden-a 2-Year Pilot TREC and KREC Screening Study
Abstract
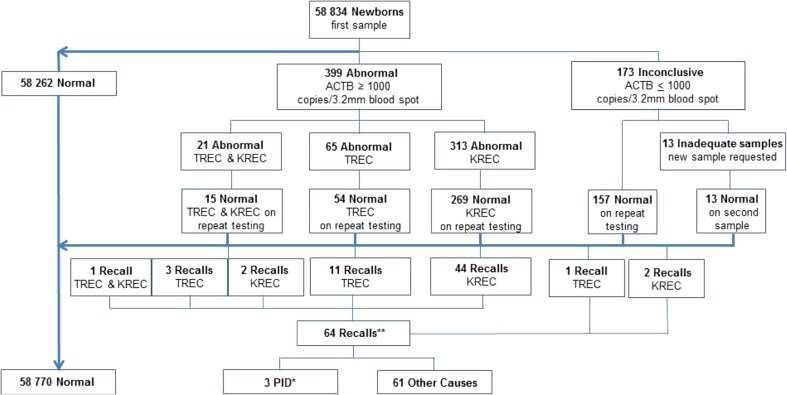
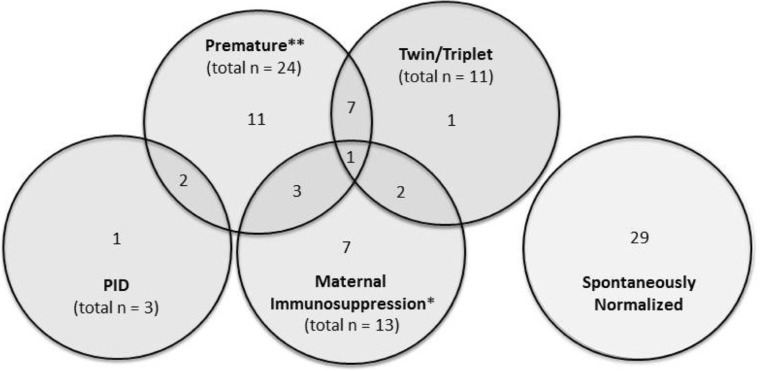
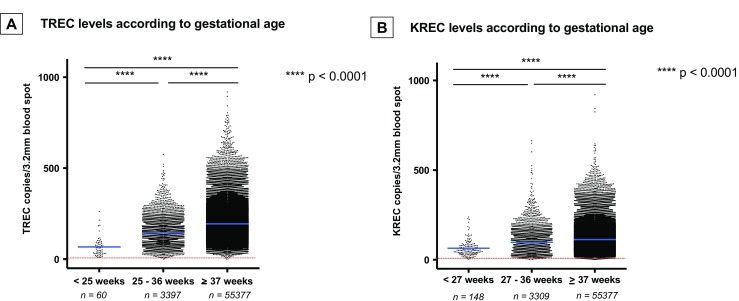
Newborn screening for severe primary immunodeficiencies (PID), characterized by T and/or B cell lymphopenia, was carried out in a pilot program in the Stockholm County, Sweden, over a 2-year period, encompassing 58,834 children. T cell receptor excision circles (TREC) and kappa-deleting recombination excision circles (KREC) were measured simultaneously using a quantitative PCR-based method on DNA extracted from dried blood spots (DBS), with beta-actin serving as a quality control for DNA quantity. Diagnostic cutoff levels enabling identification of newborns with milder and reversible T and/or B cell lymphopenia were also evaluated. Sixty-four children were recalled for follow-up due to low TREC and/or KREC levels, and three patients with immunodeficiency (Artemis-SCID, ATM, and an as yet unclassified T cell lymphopenia/hypogammaglobulinemia) were identified. Of the positive samples, 24 were associated with prematurity. Thirteen children born to mothers treated with immunosuppressive agents during pregnancy (azathioprine (n = 9), mercaptopurine (n = 1), azathioprine and tacrolimus (n = 3)) showed low KREC levels at birth, which spontaneously normalized. Twenty-nine newborns had no apparent cause identified for their abnormal results, but normalized with time. Children with trisomy 21 (n = 43) showed a lower median number of both TREC (104 vs. 174 copies/μL blood) and KREC (45 vs. 100 copies/3.2 mm blood spot), but only one, born prematurely, fell below the cutoff level. Two children diagnosed with DiGeorge syndrome were found to have low TREC levels, but these were still above the cutoff level. This is the first large-scale screening study with a simultaneous detection of both TREC and KREC, allowing identification of newborns with both T and B cell defects.
Keywords: KREC; Newborn screening; TREC; primary immunodeficiency diseases; severe combined immunodeficiency.
Conflict of interest statement
Compliance with Ethical Standards All procedures performed in studies involving human participants were in accordance with the ethical standards of the regional ethical board in Stockholm (Ethical permit 2013/414-31/4) and with the 1964 Helsinki declaration and its later amendments or comparable ethical standards. Conflict of Interest The authors declare that they have no conflict of interest.
Figures
Similar articles
-
Newborn screening for severe combined immunodeficiency: The results of the first pilot TREC and KREC study in Ukraine with involving of 10,350 neonates.Front Immunol. 2022 Sep 15;13:999664. doi: 10.3389/fimmu.2022.999664. eCollection 2022. Front Immunol. 2022. PMID: 36189201 Free PMC article.
-
Beyond TREC: Pivotal role of tandem TREC/KREC assay in Czech SCID NBS pilot programme.Pediatr Allergy Immunol. 2025 May;36(5):e70100. doi: 10.1111/pai.70100. Pediatr Allergy Immunol. 2025. PMID: 40321024 Free PMC article.
-
Newborn screening for severe T and B cell immunodeficiency in Israel: a pilot study.Isr Med Assoc J. 2013 Aug;15(8):404-9. Isr Med Assoc J. 2013. PMID: 24079059
-
Newborn Screening through TREC, TREC/KREC System for Primary Immunodeficiency with limitation of TREC/KREC. Comprehensive Review.Antiinflamm Antiallergy Agents Med Chem. 2021;20(2):132-149. doi: 10.2174/1871523019999200730171600. Antiinflamm Antiallergy Agents Med Chem. 2021. PMID: 32748762 Review.
-
TREC Based Newborn Screening for Severe Combined Immunodeficiency Disease: A Systematic Review.J Clin Immunol. 2015 May;35(4):416-30. doi: 10.1007/s10875-015-0152-6. Epub 2015 Apr 17. J Clin Immunol. 2015. PMID: 25893636 Free PMC article.
Cited by
-
X-linked severe combined immunodeficiency complicated by disseminated bacillus Calmette-Guérin disease caused by a novel pathogenic mutation in exon 3 of the IL2RG gene: a case report and literature review.Front Immunol. 2024 Aug 8;15:1453046. doi: 10.3389/fimmu.2024.1453046. eCollection 2024. Front Immunol. 2024. PMID: 39176082 Free PMC article. Review.
-
Early Diagnosis of Ataxia Telangiectasia Through Newborn Screening for SCID: a Case Report Highlighting the Dilemma of Pre-emptive HSCT.J Clin Immunol. 2023 Nov;43(8):1770-1773. doi: 10.1007/s10875-023-01571-y. Epub 2023 Aug 25. J Clin Immunol. 2023. PMID: 37624468 No abstract available.
-
Analysis of the TREC and KREC Levels in the Dried Blood Spots of Healthy Newborns with Different Gestational Ages and Weights.Acta Naturae. 2022 Jan-Mar;14(1):101-108. doi: 10.32607/actanaturae.11501. Acta Naturae. 2022. PMID: 35441044 Free PMC article.
-
Premature Infants Have Normal Maturation of the T Cell Receptor Repertoire at Term.Front Immunol. 2022 May 30;13:854414. doi: 10.3389/fimmu.2022.854414. eCollection 2022. Front Immunol. 2022. PMID: 35707545 Free PMC article.
-
Newborn Screening for Primary Immunodeficiency Diseases: History, Current and Future Practice.J Clin Immunol. 2018 Jan;38(1):56-66. doi: 10.1007/s10875-017-0455-x. Epub 2017 Nov 8. J Clin Immunol. 2018. PMID: 29116556 Free PMC article. Review.
References
-
- Guthrie R, Susi A. A simple phenylalanine method for detecting phenylketonuria in large populations of newborn infants. Pediatrics. 1963;32:338–343. - PubMed
-
- Wilson J, Jungner G. The principles and practice of screening for disease. Geneva: World Health Organization; 1968.
-
- Bruton OC. Agammaglobulinemia. Pediatrics. 1952;9(6):722–728. - PubMed
Publication types
MeSH terms
Substances
LinkOut - more resources
Full Text Sources
Other Literature Sources
Medical
Research Materials
Miscellaneous
