

Object-Based Point Cloud Analysis of Full-Waveform Airborne Laser Scanning Data for Urban Vegetation Classification
- PMID: 27873771
- PMCID: PMC3705457
- DOI: 10.3390/s8084505
Object-Based Point Cloud Analysis of Full-Waveform Airborne Laser Scanning Data for Urban Vegetation Classification
Abstract
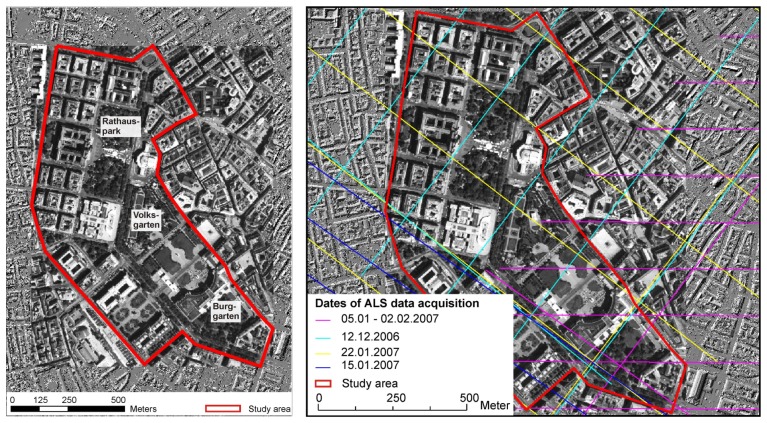
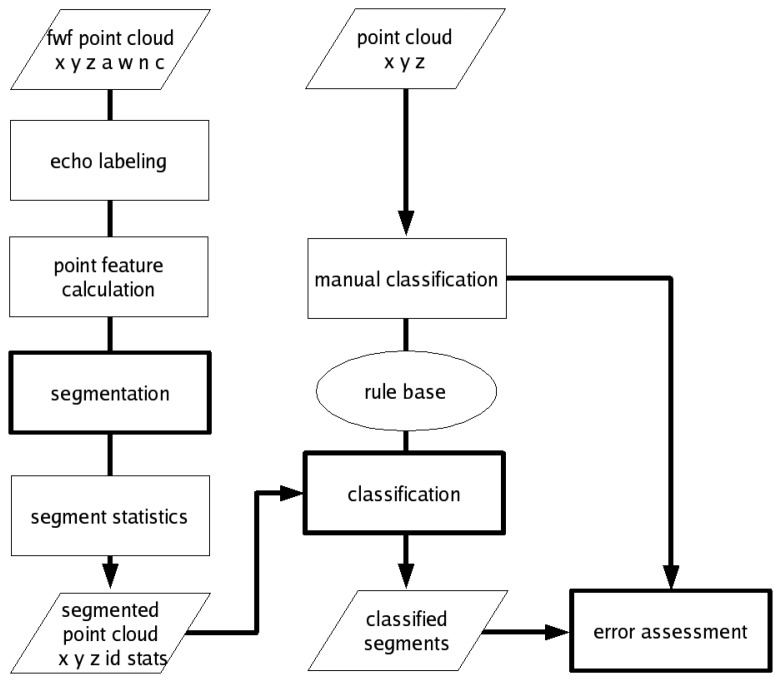
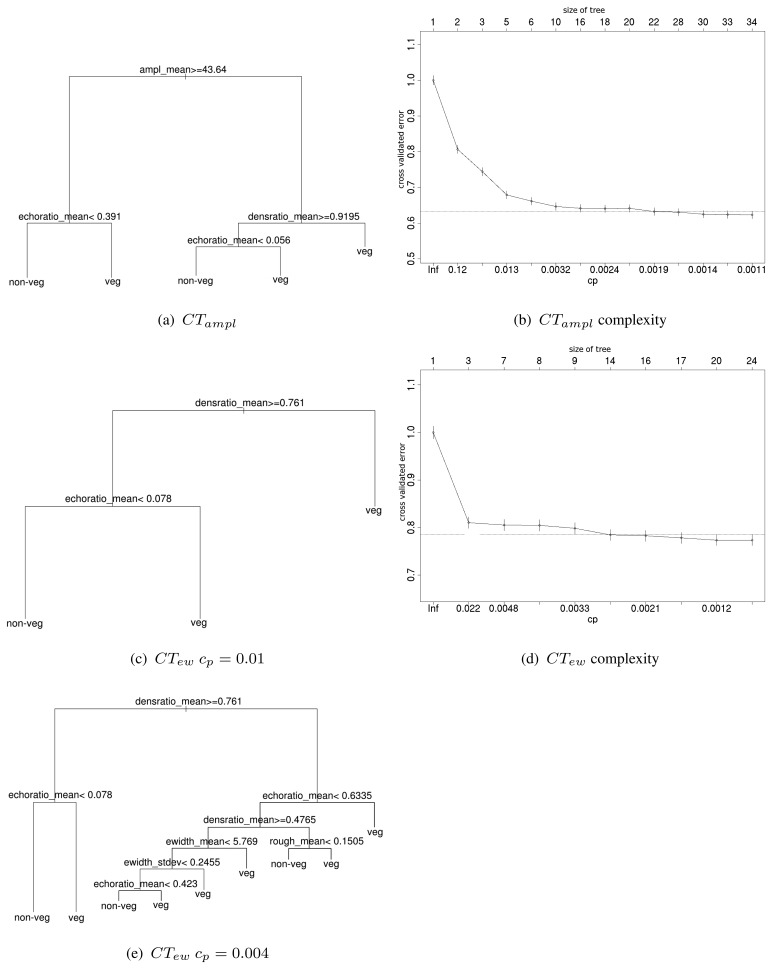
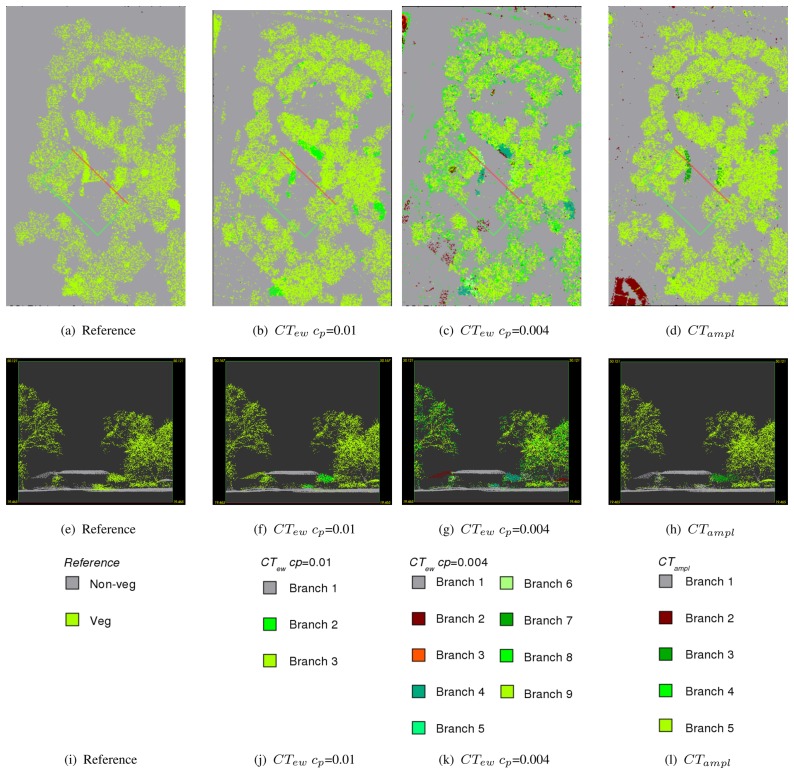
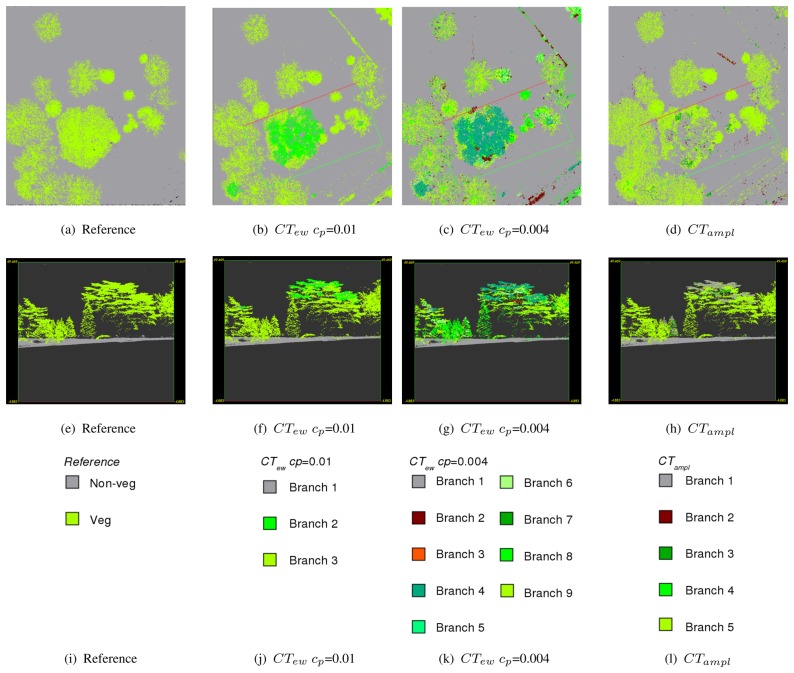
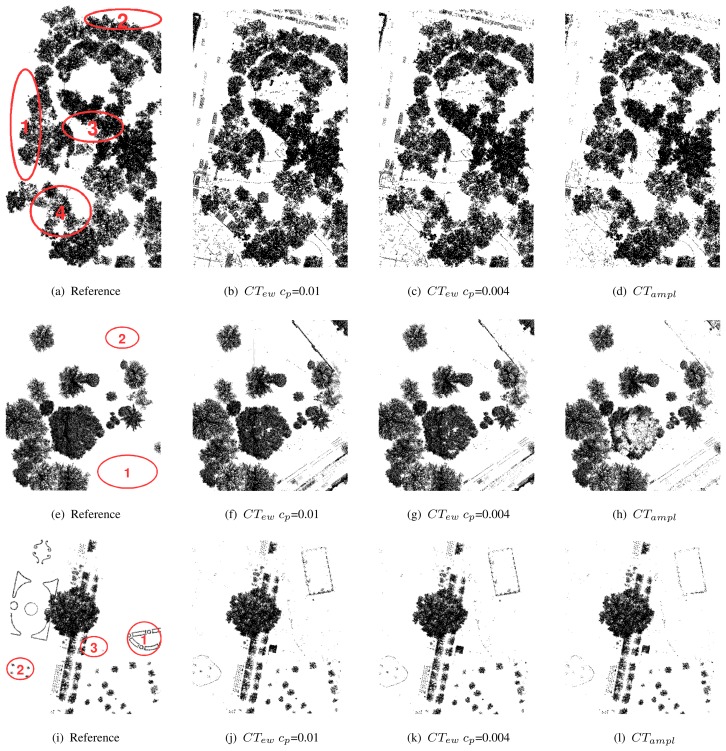
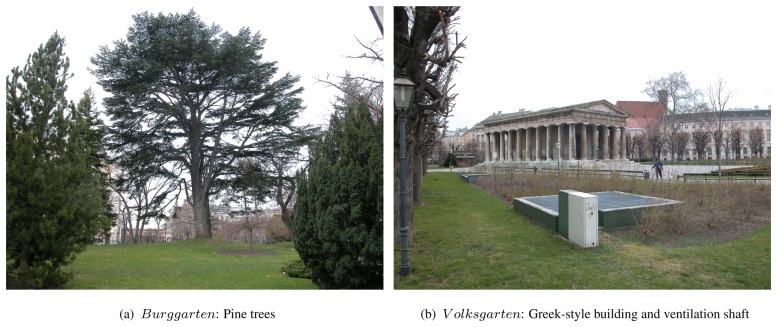
Airborne laser scanning (ALS) is a remote sensing technique well-suited for 3D vegetation mapping and structure characterization because the emitted laser pulses are able to penetrate small gaps in the vegetation canopy. The backscattered echoes from the foliage, woody vegetation, the terrain, and other objects are detected, leading to a cloud of points. Higher echo densities (> 20 echoes/m2) and additional classification variables from full-waveform (FWF) ALS data, namely echo amplitude, echo width and information on multiple echoes from one shot, offer new possibilities in classifying the ALS point cloud. Currently FWF sensor information is hardly used for classification purposes. This contribution presents an object-based point cloud analysis (OBPA) approach, combining segmentation and classification of the 3D FWF ALS points designed to detect tall vegetation in urban environments. The definition tall vegetation includes trees and shrubs, but excludes grassland and herbage. In the applied procedure FWF ALS echoes are segmented by a seeded region growing procedure. All echoes sorted descending by their surface roughness are used as seed points. Segments are grown based on echo width homogeneity. Next, segment statistics (mean, standard deviation, and coefficient of variation) are calculated by aggregating echo features such as amplitude and surface roughness. For classification a rule base is derived automatically from a training area using a statistical classification tree. To demonstrate our method we present data of three sites with around 500,000 echoes each. The accuracy of the classified vegetation segments is evaluated for two independent validation sites. In a point-wise error assessment, where the classification is compared with manually classified 3D points, completeness and correctness better than 90% are reached for the validation sites. In comparison to many other algorithms the proposed 3D point classification works on the original measurements directly, i.e. the acquired points. Gridding of the data is not necessary, a process which is inherently coupled to loss of data and precision. The 3D properties provide especially a good separability of buildings and terrain points respectively, if they are occluded by vegetation.
Keywords: 3D feature calculation; Airborne laser scanning.; Classification; Error assessment; Full-waveform; Object-based point cloud analysis; Segmentation; Urban vegetation.
Figures
References
-
- Kraus K., Pfeifer N. Determination of terrain models in wooded areas with ariborne laser scanner data. ISPRS Journal of Photogrammetry and Remote Sensing. 1998;53:193–203.
-
- Sithole G., Vosselman G. Experimental comparison of filter algorithms for bare-earth extraction from airborne laser scanning point clouds. ISPRS Journal of Photogrammetry and Remote Sensing. 2004;59(1-2):85–101.
-
- Koukal T., Schneider W., editors. Proceedings of the International Workshop on 3D Remote Sensing in Forestry; Vienna, Austria. 2006.
-
- Rönnholm P., Hyyppä H., Hyyppä J., editors. Proceedings of the ISPRS Workshop 'Laser Scanning 2007 and SilviLaser 2007', volume 36 of International Archives of Photogrammetry, Remote Sensing and Spatial Information Sciences; Espoo, Finland. 2007.
-
- Rottensteiner F., Trinder J., Clode S., Kubik K. Building detection by fusion of airborne laser scanner data and multi-spectral images: Performance evaluation and sensitivity analysis. ISPRS Journal of Photogrammetry and Remote Sensing. 2007;62:135–149.
LinkOut - more resources
Full Text Sources
Miscellaneous
