. 2016 Nov 22:5:37581.
doi: 10.1038/srep37581.

Identification of Polo-like kinase 1 interaction inhibitors using a novel cell-based assay

Affiliations

Identification of Polo-like kinase 1 interaction inhibitors using a novel cell-based assay

Karine Normandin et al. Sci Rep. .

Abstract

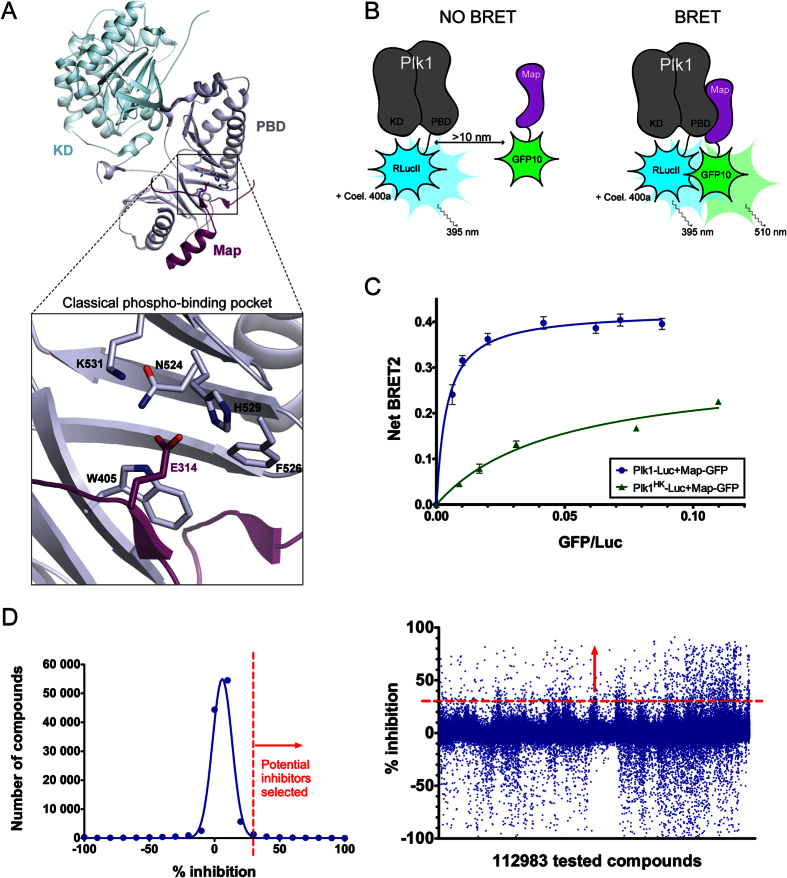
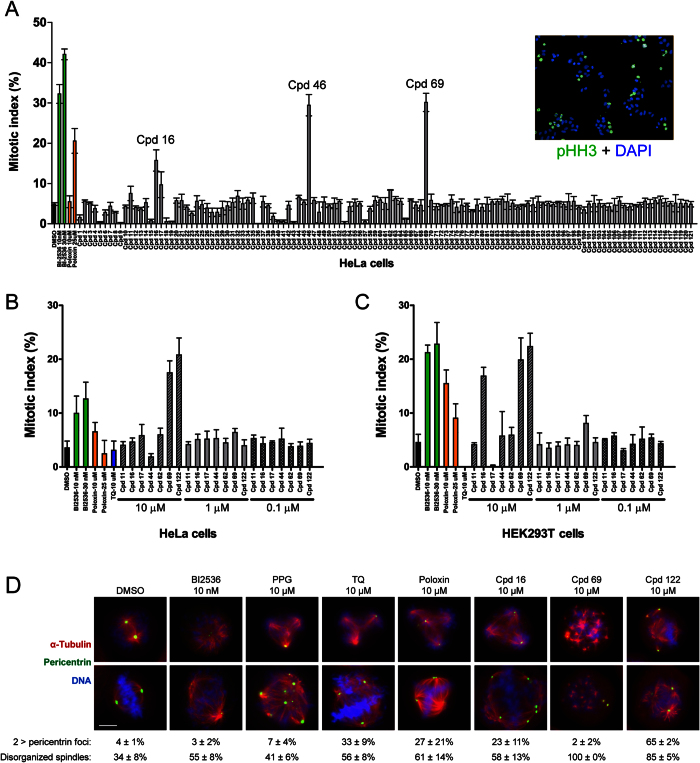
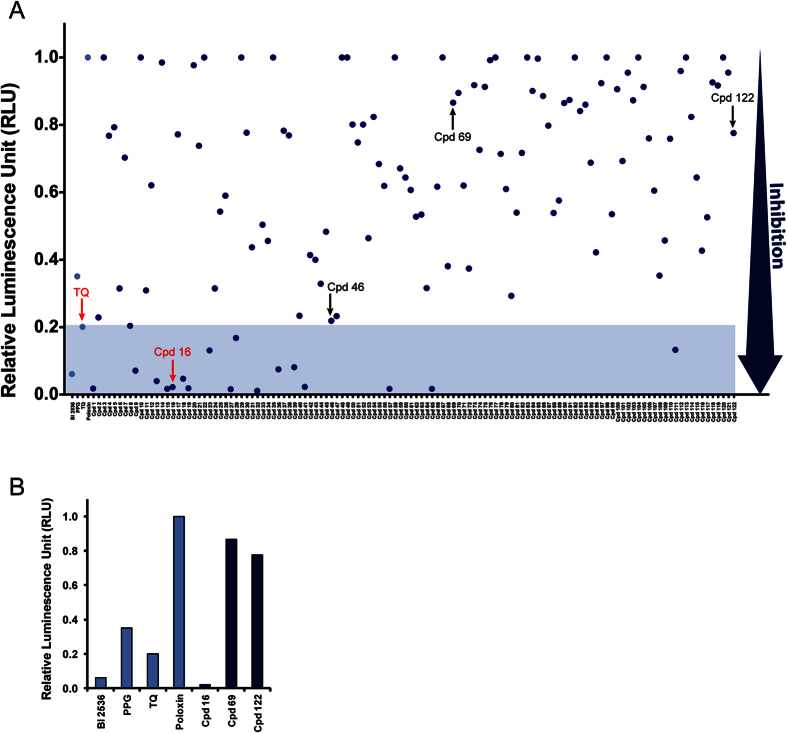
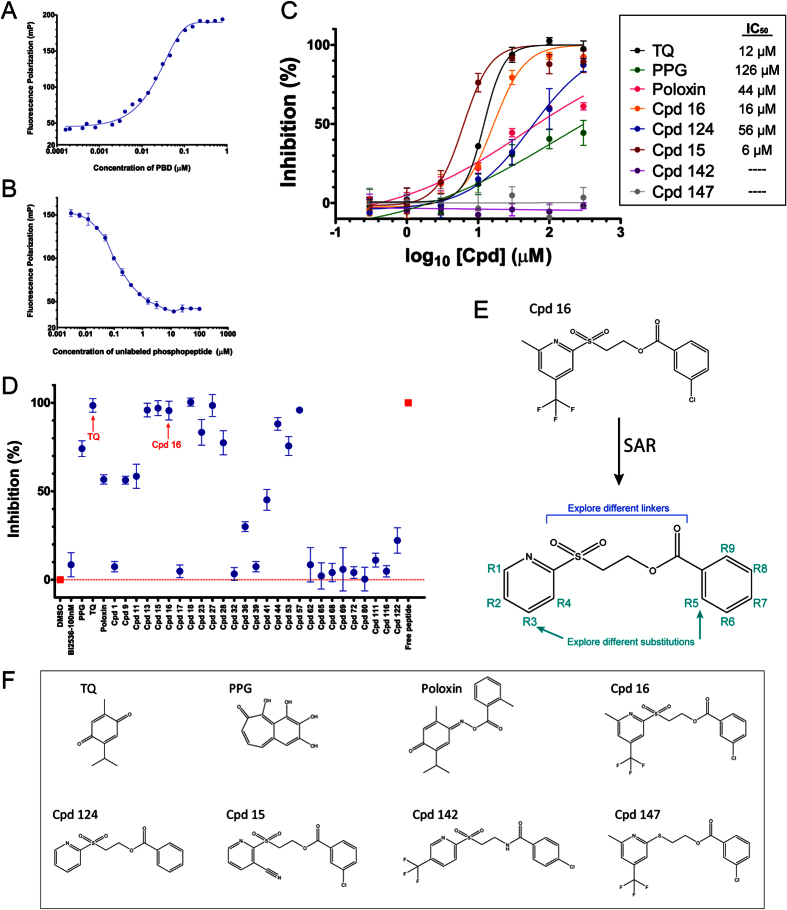
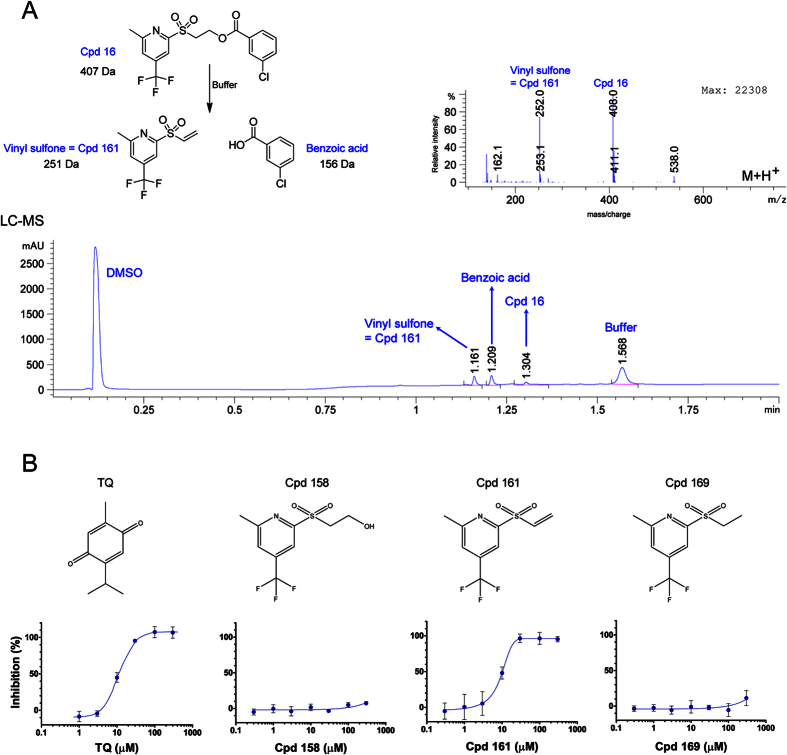
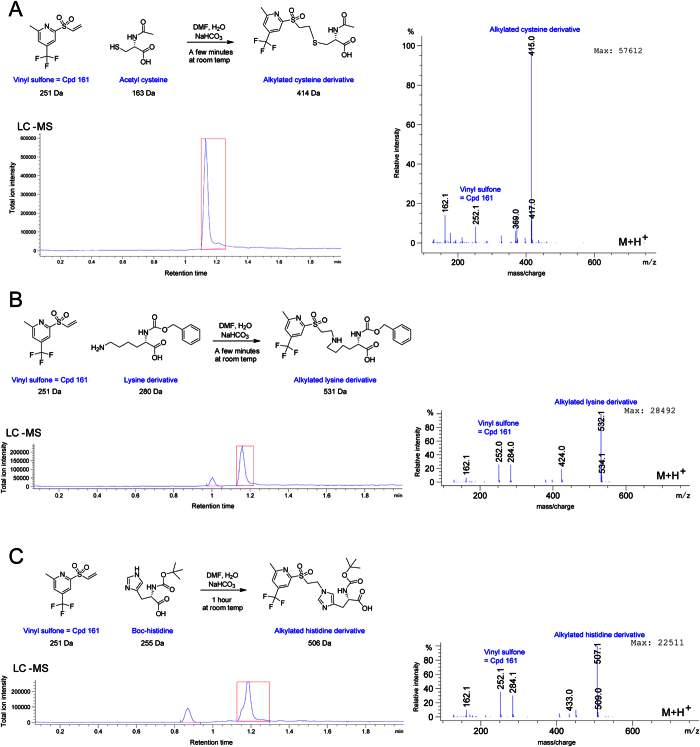
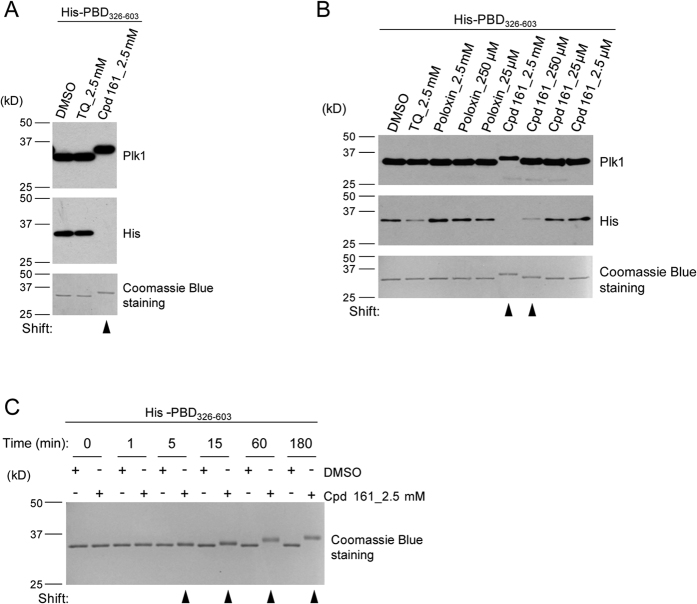
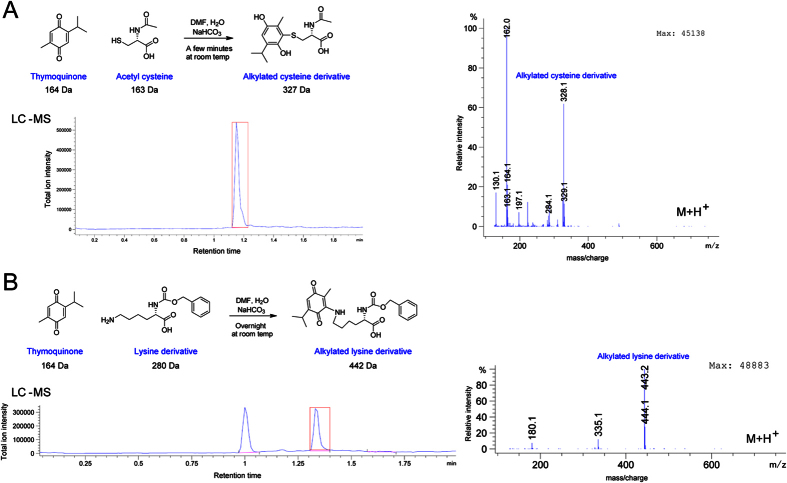
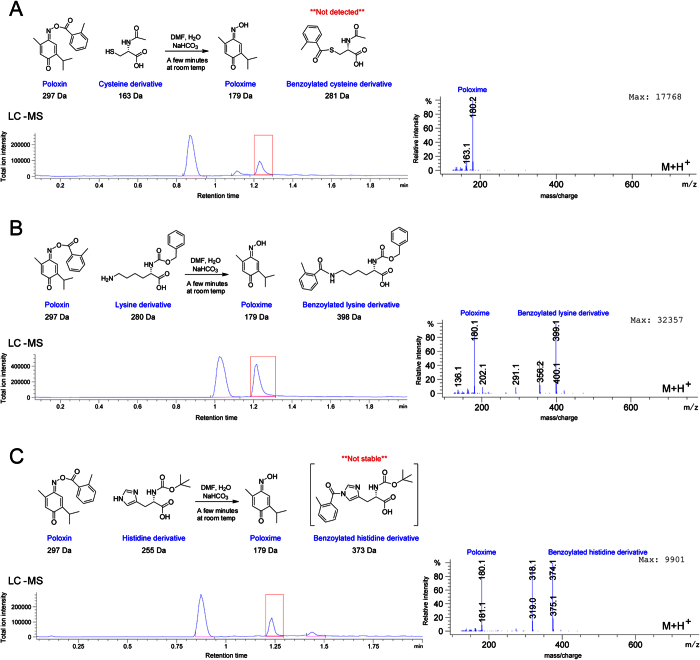
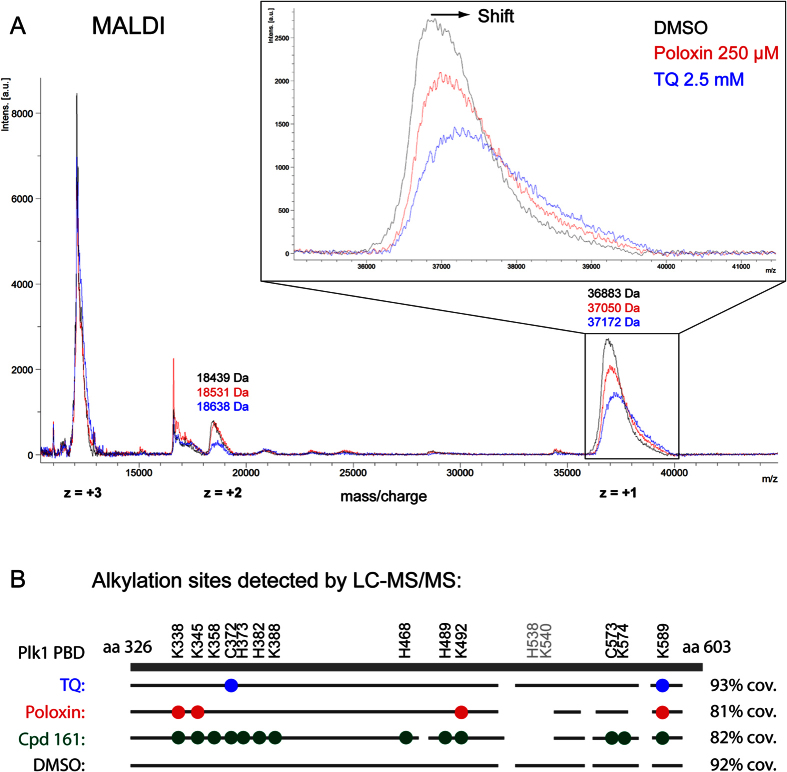
Polo-like kinase 1 (Plk1) plays several roles in cell division and it is a recognized cancer drug target. Plk1 levels are elevated in cancer and several types of cancer cells are hypersensitive to Plk1 inhibition. Small molecule inhibitors of the kinase domain (KD) of Plk1 have been developed. Their selectivity is limited, which likely contributes to their toxicity. Polo-like kinases are characterized by a Polo-Box Domain (PBD), which mediates interactions with phosphorylation substrates or regulators. Inhibition of the PBD could allow better selectivity or result in different effects than inhibition of the KD. In vitro screens have been used to identify PBD inhibitors with mixed results. We developed the first cell-based assay to screen for PBD inhibitors, using Bioluminescence Resonance Energy Transfer (BRET). We screened through 112 983 compounds and characterized hits in secondary biochemical and biological assays. Subsequent Structure-Activity Relationship (SAR) analysis on our most promising hit revealed that it requires an alkylating function for its activity. In addition, we show that the previously reported PBD inhibitors thymoquinone and Poloxin are also alkylating agents. Our cell-based assay is a promising tool for the identification of new PBD inhibitors with more drug-like profiles using larger and more diverse chemical libraries.


Conflict of interest statement

The authors declare no competing financial interests.

Figures

Figure 1
Figure 1. A BRET-based assay to screen for chemical inhibitors of Plk1 protein interaction.
(A) Co-crystal structure of zebrafish Plk1 (kinase domain and Polo-Box Domain in light blue and grey, respectively) in complex with a fragment of Drosophila Map205 (purple) (PDB entry 4J7B). The assay developed in this study exploited the analogous interaction between human Plk1 and a Drosophila Map205 fragment. Residues of the PBD phospho-binding pocket (zoomed in) within a 4-angstroms distance of Map205 phospho-mimetic residue E314 are shown as sticks (W405 corresponds to W414 in human Plk1, N514 to N523, F526 to F535, H529 to H538 and K531 to K540). (B) Principle of the assay. Human Plk1 is C-terminally fused to RLucII and Map is N-terminally fused to GFP10. When the RLucII and GFP10 moieties are brought closer than 10 nm, oxidation of the coelenterazine 400a substrate by RLucII induces an energy transfer from RLucII to GFP10, causing GFP10 to emit fluorescence. (C) The Plk1-Map interaction used in the assay strongly depends on pincer (H538 and K540) residues in the PBD of Plk1 required for its interactions with phosphorylated proteins. HEK293T cells were transiently transfected with a constant amount of Plk1-Luc plasmid and an increasing amount of Map-GFP plasmid. The BRET signal measured 48 hours later is plotted as a function of ratio GFP fluorescence/luciferase activity. Error bars: standard deviation of triplicate values from the same experiment. (D) Distribution of the screened compounds according to their effect on the Plk1-Map BRET signal. Left: distribution of the number of compounds according to the percentage of inhibition. Right: Percentage of inhibition values for each compound tested. A minimum threshold of 30% inhibition was applied as a first selection criterion.
Figure 2
Figure 2. Some primary hit compounds increase the mitotic index and induce abnormal mitotic phenotypes.
(A) The 121 primary BRET hits from the library were tested in a mitotic index assay (concentrations ranging from 10 μM to 25 μM). The known Plk1 inhibitors BI2536 and Poloxin were included at the indicated concentrations, for comparison. HeLa cells were treated for 7 hours before the immunofluorescence with phospho-Histone H3 antibody. Upper right: example of the image generated by the Operetta. Error bars: standard deviation of triplicate values from the same experiment. (BC) Mitotic index for selected compounds purchased separately and re-tested at different concentrations in HeLa cells (B) and in HEK293T cells (C). (D) Plk1 inhibitors induce mitotic defects. HeLa cells were treated as above with the indicated compounds and examined by immunofluorescence to reveal α-Tubulin (red), the centrosome marker pericentrin (green) and DNA (DAPI, blue). The percentage of cells with more than 2 pericentrin foci and the percentage of cells showing a disorganized spindle are shown. Two representative images are shown for each treatment. For DMSO, the top image shows a normal disorganized spindle in prometaphase and the bottom image shows a normal metaphase. All experiments were done in triplicate and error bars correspond to standard deviation.
Figure 3
Figure 3. Some primary hit compounds interfere with the Plk1-Map interaction in a co-immunoprecipitation assay.
(A) The 121 BRET hits (+Cpd 122) disrupt the Plk1/Map interaction to various degrees in this assay, some disrupting the interaction more efficiently than TQ (blue zone), including Cpd 16. For each compound, values (relative luminescence unit) were calculated relative to the maximal value in each column of compounds (see Table S1 for raw data and analysis). (B) Focus on selected hit compounds and controls. Note that like TQ and Cpd 16, BI2536 also disrupts the interaction in this assay. All values are averages of duplicates from the same experiment.
Figure 4
Figure 4. Some of the compounds identified interfere with the interaction between the PBD and binding peptides in a Fluorescence Polarization (FP) assay.
(A) The FP signal increases when a FITC-labeled PBD-binding phosphopeptide (10 nM) is incubated with increasing concentrations of GST-PBD367-603. (B) Competitive displacement of the FITC-phosphopeptide (10 nM) from the GST-PBD367-603 (used at EC65 = 38 nM) by the corresponding unlabeled phosphopeptide added at increasing concentrations. Experiment was done in duplicate. Error bars: range between values. (C) Inhibition curves of compounds assayed by FP. GST-PBD367-603 (38 nM) was pre-incubated for 1 hour with indicated compounds before addition of the FITC-phosphopeptide. TQ and Cpd 16 show similar IC50 values. Experiment was done in triplicate. Error bars: standard deviation. (D) Targeted screen of selected compounds in the FP assay. GST-PBD367-603 (38 nM) was pre-incubated for 1 hour with different compounds at 50 μM before addition of the FITC-phosphopeptide. Values are means of triplicates from the same experiment (±standard deviation). (E) Summary of SAR strategy targeting substitutions on the cycles and the linker between them. (F) Chemical structures of published PBD inhibitors used in this study, Cpd 16 and 4 selected analogs of Cpd 16 tested in FP in panel C.
Figure 5
Figure 5. Cpd 16 spontaneously fragments to generate a vinyl sulfone whose vinyl group is required for PBD inhibition.
(A) Cpd 16 fragments into vinyl sulfone and benzoic acid products in an aqueous solution at approximate pH 8.0. Upper left: Diagram showing the reagent and products. Bottom: Diode array detector chromatogram (DAD) showing all the components detected after approximately 10 minutes in FP buffer. Upper right: Vinyl sulfone was detected on the mass spectrometer (m + 1 = 252) by LC-MS. (B) Inhibition dose-response curves obtained by FP with the chemical structures of the compounds tested. GST-PBD367-603 at 38 nM (EC65) was incubated for 1 hour with the compound before addition of the FITC-phosphopeptide (10 nM). Experiment was done in triplicate. Error bars: standard deviation.
Figure 6
Figure 6. Cpd 161 alkylates nucleophilic amino acid side chains.
Alkylated cysteine (A), lysine (B) and histidine (C) derivatives were detected by LC-MS. For the 3 amino-protected amino acids, the scheme of the reaction, Total Ion Chromatogram (TIC), and mass spectrum (m + 1) are presented. Cpd 161 reacted to completion with amino-protected cysteine (A) and lysine (B) after approximately 10 minutes at room temperature. The reaction also occurred with amino-protected histidine (C) but was slower. TIC peaks corresponding to reaction products analyzed by MS are indicated by red boxes.
Figure 7
Figure 7. Covalent reaction of Cpd 161 with the PBD is detected by SDS-PAGE.
(A) Alkylation of the PBD by Cpd 161 is detected as a shift in apparent molecular mass. His-PBD326-603 (2 μg) was treated for 4 hours with DMSO, TQ (2.5 mM) or Cpd 161 (2.5 mM). Fractions of the reaction equivalent to 0.1 μg of protein per lane were subjected to Western blot analyses using antibodies directed against Plk1 or the poly-histidine tag. Fractions of the reaction equivalent to 1 μg were loaded on a gel for Coomassie Blue gel staining. (B) Alkylation of the PBD by Cpd 161 is dose-dependent. His-PBD326-603 (2 μg) was treated for 3 hours with different concentrations of Cpd 161, Poloxin and TQ. Note that only Cpd 161 can induce a clear shift of the protein, which is dose-dependent. Western blotting and Coomassie Blue gel staining were performed as described in (A). (C) Alkylation of the PBD by Cpd 161 is time-dependent. His-PBD326-603 (2 μg) was treated with DMSO or 2.5 mM of Cpd 161 for different times before SDS-PAGE analysis. Cropped images of blots and gels are shown; uncropped images are provided in Supplementary Fig. S5.
Figure 8
Figure 8. TQ alkylates nucleophilic amino acid side chains.
Alkylated cysteine (A) and lysine (B) derivatives were detected by LC-MS. For the 2 amino-protected amino acids, the scheme of the reaction, Total Ion Chromatogram (TIC), and mass spectrum (m + 1) are presented. TQ reacted to completion with amino-protected cysteine (A) and lysine (B). With cysteine (A) completion occurred after only approximately 10 minutes at room temperature and the reaction was much slower (several hours) with lysine (B). TIC peaks corresponding to reaction products analyzed by MS are indicated by red boxes. No reaction was detected with amino-protected histidine (data not shown).
Figure 9
Figure 9. Poloxin alkylates nucleophilic amino acid side chains.
Benzoylated lysine (B) and histidine (C) derivatives were detected by LC-MS. For the 3 amino-protected amino acids, the scheme of the reaction, Total Ion Chromatogram (TIC), and mass spectrum (m + 1) are presented. Poloxin did not react with protected cysteine (A); only the hydrolysed Poloxime form was detected. Poloxin reacted to completion with amino-protected lysine (B) and histidine (C) after only approximately 10 minutes at room temperature, where a cleaved Poloxime form was also observed in all cases. TIC peaks corresponding to reaction products analyzed by MS are indicated by red boxes. Note that benzoylated histidine derivative was not stable and was no longer detected after a few hours, when only the Poloxime form was detected (data not shown).
Figure 10
Figure 10. Covalent reaction of TQ and Poloxin with the PBD is detected by mass spectrometry.
(A) His-PBD326-603 (4 μg) was treated with 2.5 mM TQ, 250 μM Poloxin (2.5 mM precipitated), or DMSO (negative control) for approximately 2 hours. Samples were submitted to MALDI-TOF analysis. The full spectra showing the 3 forms of the protein (+1 peak around 36.9 kDa, +2 peak around 18.5 kDa, and the +3 peak around 12 kDa), are shown. The +1 form was zoomed in to better evaluate the peak displacement of the PBD caused by alkylation by TQ and Poloxin. (B) Alkylation sites detected by LC-MS/MS on tryptic digests of alkylated PBD. Residues observed to be alkylated by TQ, Poloxin and Cpd 161 are indicated by colored circles. In each case, the grey line indicates the sequence covered by the peptides observed in the analysis, with percentages of PBD sequence on the right.

References

    1. Llamazares S. et al.. polo encodes a protein kinase homolog required for mitosis in Drosophila. Genes Dev 5, 2153–65 (1991). - PubMed
    1. Sunkel C. E. & Glover D. M. polo, a mitotic mutant of Drosophila displaying abnormal spindle poles. J Cell Sci 89 (Pt 1), 25–38 (1988). - PubMed
    1. Archambault V. & Glover D. M. Polo-like kinases: conservation and divergence in their functions and regulation. Nat Rev Mol Cell Biol 10, 265–75 (2009). - PubMed
    1. de Carcer G., Manning G. & Malumbres M. From Plk1 to Plk5: functional evolution of polo-like kinases. Cell Cycle 10, 2255–62 (2011). - PMC - PubMed
    1. Elia A. E., Cantley L. C. & Yaffe M. B. Proteomic screen finds pSer/pThr-binding domain localizing Plk1 to mitotic substrates. Science 299, 1228–31 (2003). - PubMed

Publication types

MeSH terms

LinkOut - more resources