. 2016 Nov 22:3:160104.
doi: 10.1038/sdata.2016.104.

A global gas flaring black carbon emission rate dataset from 1994 to 2012

Affiliations

A global gas flaring black carbon emission rate dataset from 1994 to 2012

Kan Huang et al. Sci Data. .

Abstract

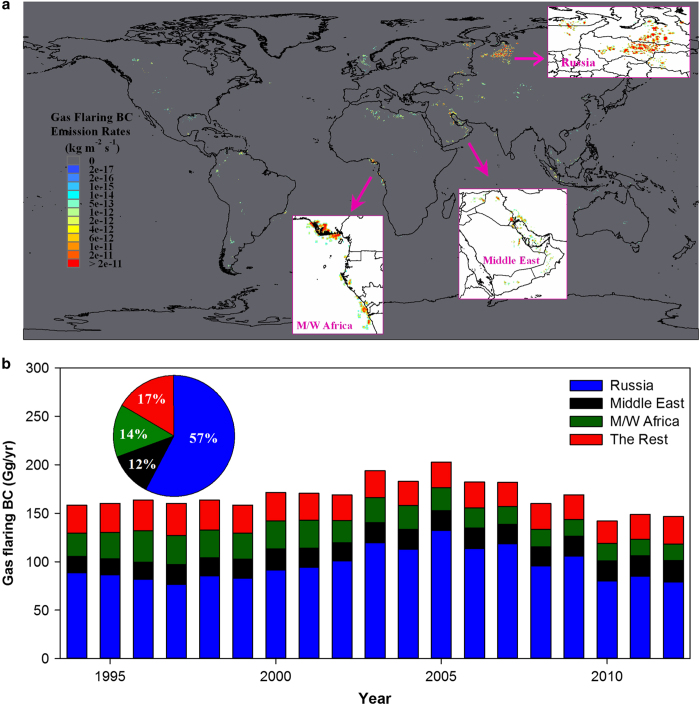
Global flaring of associated petroleum gas is a potential emission source of particulate matters (PM) and could be notable in some specific regions that are in urgent need of mitigation. PM emitted from gas flaring is mainly in the form of black carbon (BC), which is a strong short-lived climate forcer. However, BC from gas flaring has been neglected in most global/regional emission inventories and is rarely considered in climate modeling. Here we present a global gas flaring BC emission rate dataset for the period 1994-2012 in a machine-readable format. We develop a region-dependent gas flaring BC emission factor database based on the chemical compositions of associated petroleum gas at various oil fields. Gas flaring BC emission rates are estimated using this emission factor database and flaring volumes retrieved from satellite imagery. Evaluation using a chemical transport model suggests that consideration of gas flaring emissions can improve model performance. This dataset will benefit and inform a broad range of research topics, e.g., carbon budget, air quality/climate modeling, and environmental/human exposure.


Conflict of interest statement

The authors declare no competing financial interests.

Figures

Figure 1
Figure 1. The global map of the mean values of EFflare,BC for various gas flaring regions.
A histogram of EFflare,BC is shown inside the bottom left corner of the figure. Abbreviations of some regions are defined as: USA—United States of America; CONUS—Conterminous United States; UK—United Kingdom of Great Britain and Northern Ireland; DR Congo—Congo (Democratic Republic of the); UAE—United Arab Emirates.
Figure 2
Figure 2. Gas flaring BC emissions at the grid and regional scale.
(a) The spatial distribution of annual mean gas flaring BC emitting rates (unit: kg m−2 s−1) across the whole globe during 1994–2012 with subsets enlarging three hotspot regions: (1) Russia (mainly in the Khanty-Mansiysk and Yamalo-Nenets Autonomous Okrug) (2) the Middle East (including Iran, Iraq, Saudi Arabia, Qatar, Oman, Syria, United Arab Emirates, Kuwait, and Yemen) (3) the coastal areas of Middle and Western Africa (M/W Africa, including Nigeria, Angola, Gabon, Congo, Equatorial Guinea, Cameroon, and Democratic Republic of the Congo). (b) The annual gas flaring BC emissions (Gg/yr) of Russia, the Middle East, M/W Africa, and the rest of the world during 1994–2012. The pie chart inserted into b shows the average contributions from the defined four regions to the global total gas flaring BC emissions during 1994–2012.
Figure 3
Figure 3. Comparison of AAOD between observation and simulation over Russia’s major flaring source region.
(a) AAOD from MISR observation during the fall in 2010 (b) AAOD from H-CMAQ simulation during the same observation period. The gas flaring areas in Russia are denoted by the red polygons. The grids with valid AAOD values within the gas flaring areas are marked by alphabets from ai in a. These grids are marked in b as well. (c) The scatter plot between MISR AAOD and simulated AAOD. Each scatter is marked by the alphabet corresponding to that shown in a,b. The 1:1 line is also plotted for reference.
Figure 4
Figure 4. Comparison between hourly measurements of equivalent BC concentrations measured by a filter absorption photometer at the Zeppelin Observatory at Svalbard, Norway and simulated BC concentrations by H-CMAQ during February—March, 2010.
The simulated BC concentrations are divided into flaring BC (yellow filled areas) and non-flaring BC (gray filled areas) concentrations by conducting brute-force simulation of zeroing out flaring emissions. The high observed BC episodes are highlighted by red rectangles. The inner plot visualizes the locations of gas flaring activities (red placemark) in the main oil and gas production fields in Russia (Khanty-Mansiysk and Yamalo-Nenets Autonomous Okrug) and the location of the Zeppelin Observatory (pink placemark).
Figure 5
Figure 5. Comparison of AAOD between observation and simulation over the Persian Gulf.
(a) Visualization of gas flaring activities in the Middle East in Google Earth (b) BC emission rates (kg m−2 s−1) from gas flaring (rainbow contour) and non-flaring emissions sectors (white/black contour, including energy/industry/traffic/residential/shipping sectors) based on the HTAPv2 dataset (ce) Simulated AAOD without gas flaring emissions over the Persian Gulf in January, November, and December of 2010, respectively (fh) The same as (ce) but for simulated AAOD with gas flaring emissions (ik) AAOD from MISR satellite observation.

References

Data Citations

    1. Huang K., Fu J. S. 2016. Figshare. https://dx.doi.org/10.6084/m9.figshare.c.3269243 - DOI

References

    1. Elvidge C. D., Zhizhin M., Baugh K., Hsu F. C. & Ghosh T. Methods for Global Survey of Natural Gas Flaring from Visible Infrared Imaging Radiometer Suite Data. Energies 9, 14 (2016).
    1. World Bank. Igniting Solutions to Gas Flaring in Russia http://www.worldbank.org/en/news/feature/2013/11/12/igniting-solutions-t..., November 12, 2013 (2013).
    1. Anomohanran O. Determination of greenhouse gas emission resulting from gas flaring activities in Nigeria. Energ. Policy 45, 666–670 (2012).
    1. Ologunorisa T. E. A review of the effects of gas flaring on the Niger Delta environment. Int. J. Sust. Dev. World 8, 249–255 (2001).
    1. Solov'yanov A. Associated petroleum gas flaring: Environmental issues. Russ. J. Gen. Chem. 81, 2531–2541 (2011).

Publication types

LinkOut - more resources