. 2017 Feb;13(2):386-403.
doi: 10.1080/15548627.2016.1256934. Epub 2016 Nov 22.

Autolysosome biogenesis and developmental senescence are regulated by both Spns1 and v-ATPase

Affiliations

Autolysosome biogenesis and developmental senescence are regulated by both Spns1 and v-ATPase

Tomoyuki Sasaki et al. Autophagy. 2017 Feb.

Abstract

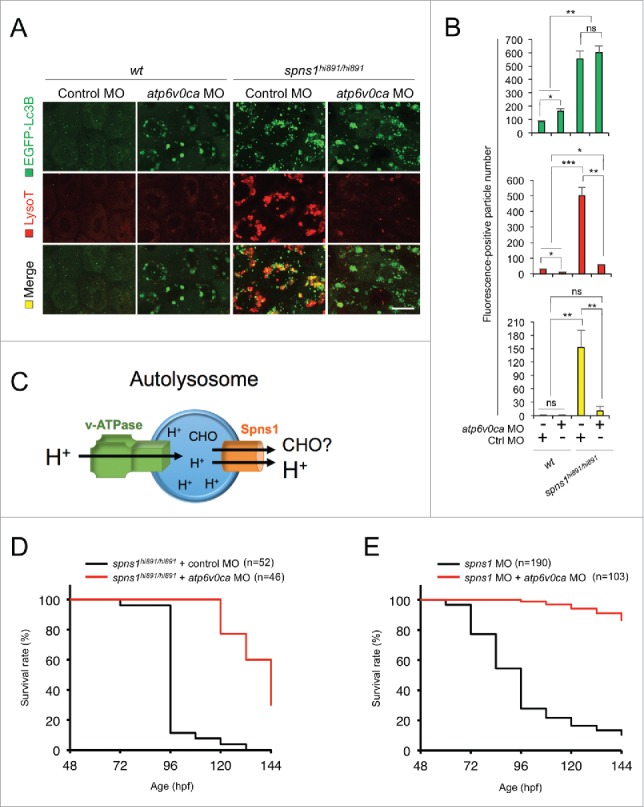
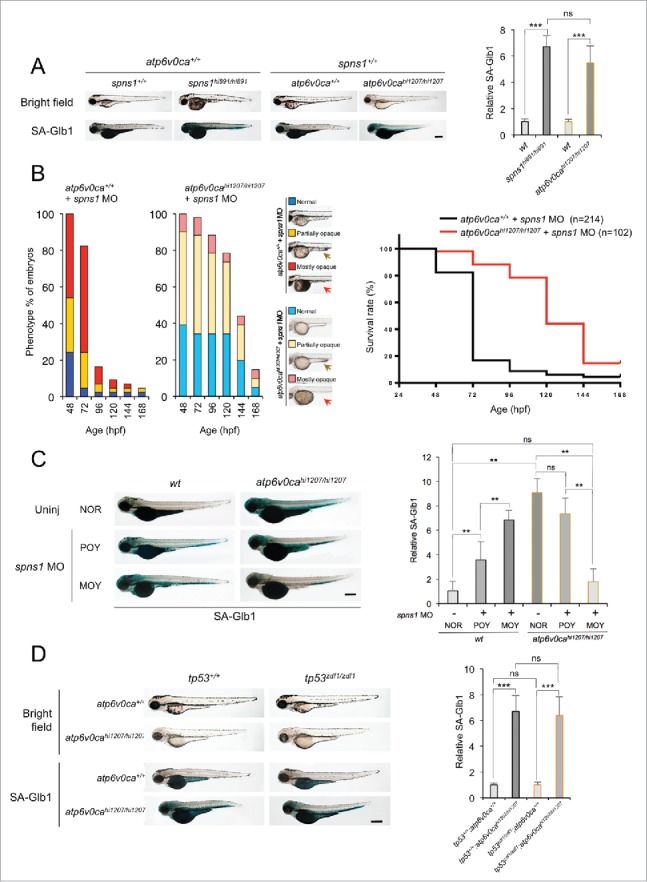
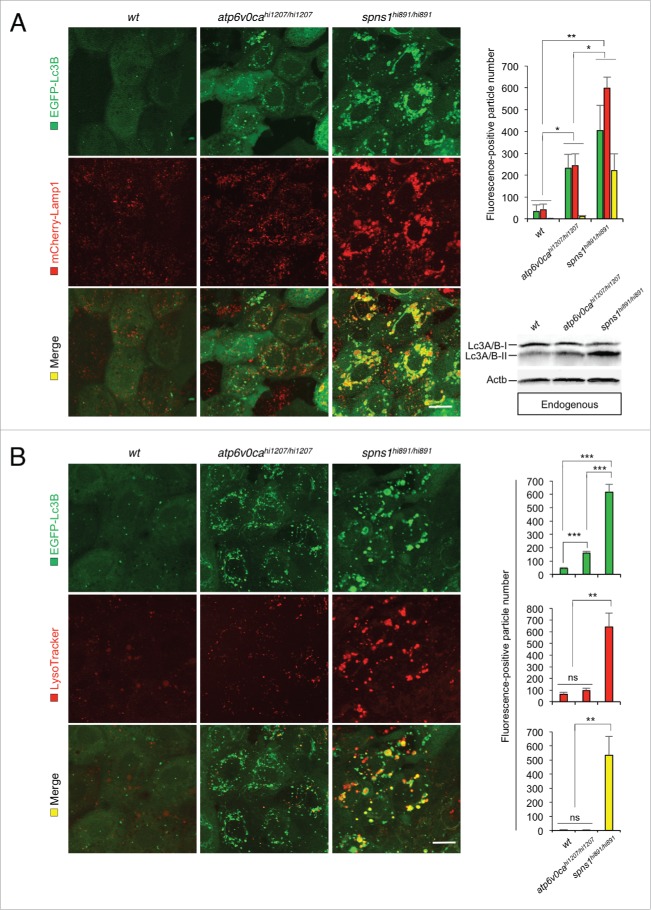
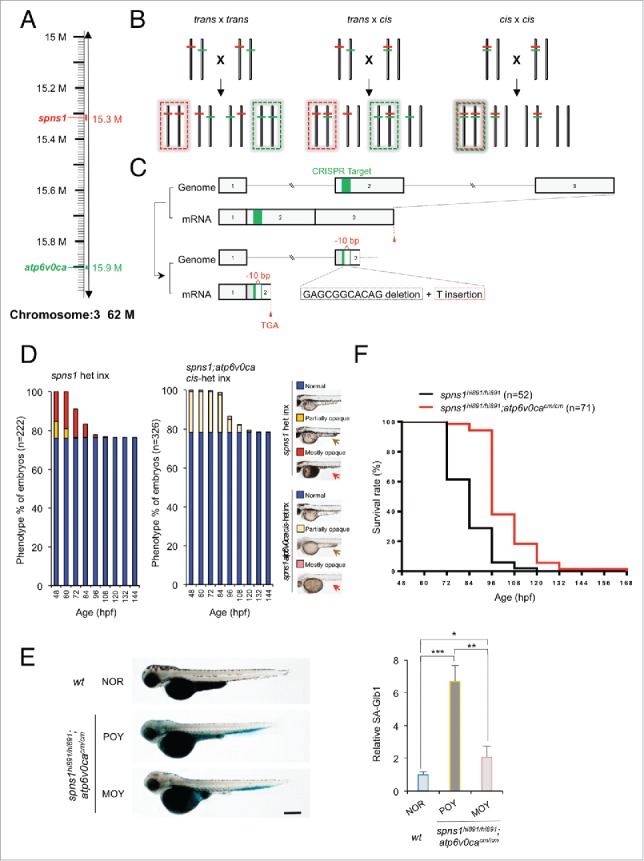
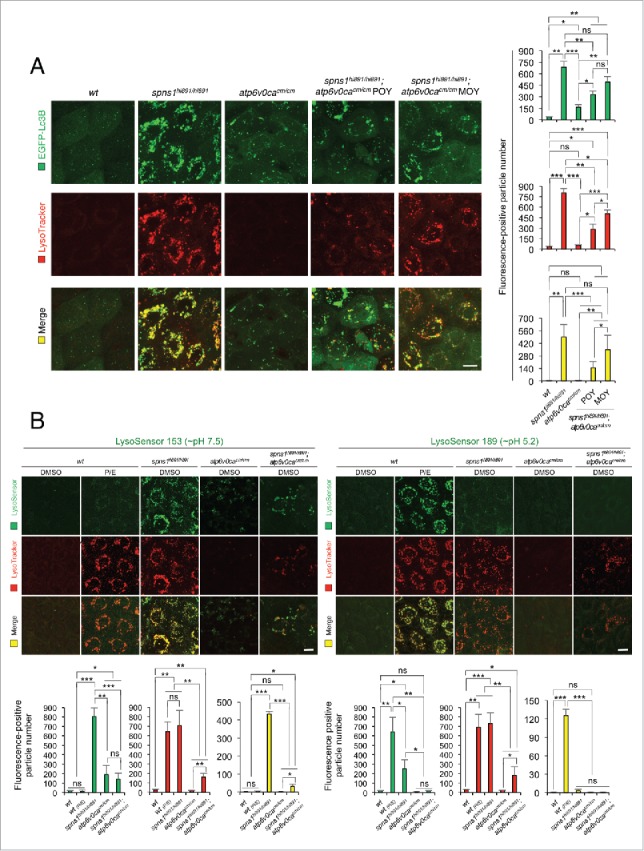
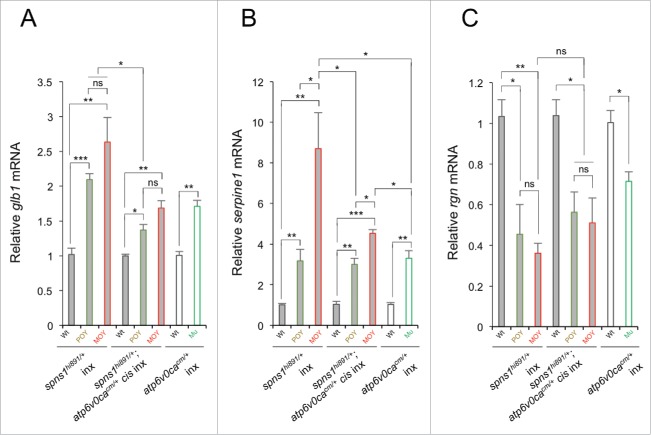
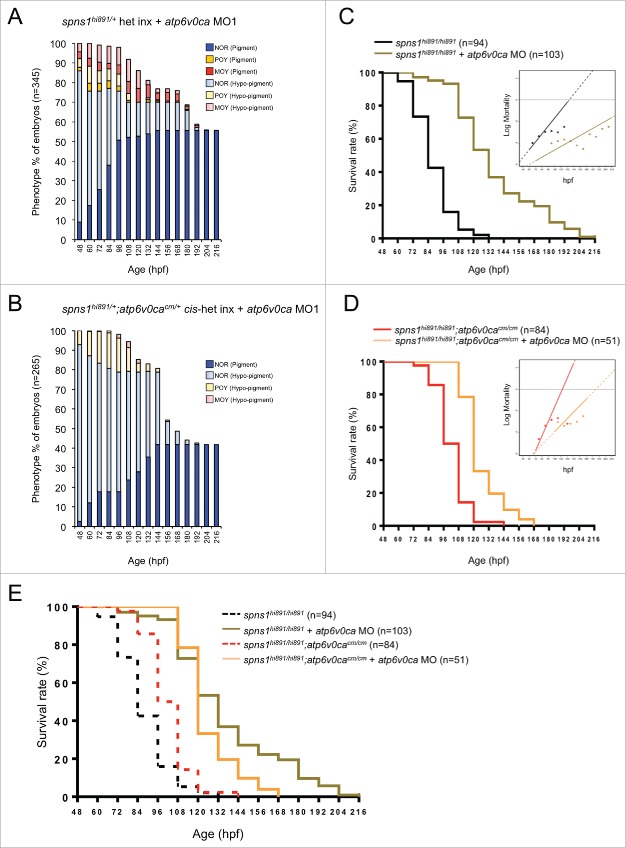
Spns1 (Spinster homolog 1 [Drosophila]) in vertebrates, as well as Spin (Spinster) in Drosophila, is a hypothetical lysosomal H+-carbohydrate transporter, which functions at a late stage of macroautophagy (hereafter autophagy). The Spin/Spns1 defect induces aberrant autolysosome formation that leads to developmental senescence in the embryonic stage and premature aging symptoms in adulthood. However, the molecular mechanism by which loss of Spin/Spns1 leads to the specific pathogenesis remains to be elucidated. Using chemical, genetic and CRISPR/Cas9-mediated genome-editing approaches in zebrafish, we investigated and determined a mechanism that suppresses embryonic senescence as well as autolysosomal impairment mediated by Spns1 deficiency. Unexpectedly, we found that a concurrent disruption of the vacuolar-type H+-ATPase (v-ATPase) subunit gene, atp6v0ca (ATPase, H+ transporting, lysosomal, V0 subunit ca) led to suppression of the senescence induced by the Spns1 defect, whereas the sole loss of Atp6v0ca led to senescent embryos similar to the single spns1 mutation. Moreover, we discovered that the combined stable defect seen in the presence of both the spns1 and atp6v0ca mutant genes still subsequently induced premature autophagosome-lysosome fusion marked by insufficient acidity, while extending developmental life span, compared with the solely mutated spns1 defect. Our data suggest that Spns1 and the v-ATPase orchestrate proper autolysosomal biogenesis with optimal acidification that is critically linked to developmental senescence and survival.

Keywords: aging; autophagy; lysosome; senescence; spinster; vacuolar-type H+-ATPase; zebrafish.


Figures

Figure 1.
Figure 1.
Atp6v0ca knockdown suppresses Spns1 deficiency and prolongs the survival of the defective animals. (A) Intracellular autolysosome formation and lysosomal biogenesis monitored by EGFP-Lc3B and LysoTracker at 76 hpf in wild-type (wt) and spns1-mutant animals injected with atp6v0c MO (4 ng/embryo). The samples were observed by using confocal microscopy at high magnification (x600). Scale bar: 10 µm. (B) Quantification of the EGFP-Lc3B (green), LysoTracker (red) and merged (yellow) fluorescence-positive particle numbers shown in (A). Quantification of images (and 4 additional sets of data) presented in the top, middle and bottom rows (red, LysoTracker Red; green, EGFP; yellow, merge) in panel (A) is shown (the number [n] of animals for each genotype with MO = 5). Error bars represent the mean ± SD, *P < 0.05, **P < 0.01, ***P < 0.005; ns, not significant. (C) The schematic illustrates the location and function of the v-ATPase (which acidifies the lysosome and allows the activation of lysosomal hydrolases) and Spns1 (which is proposed to function in carbohydrate [CHO] efflux) in the lysosome membrane. (D) Survival curve for spns1-mutant animals injected with atp6v0ca MO or control MO (log rank test: χ2 = 82.71 on one degree of freedom; P < 0.0001). (E) Survival curve for spns1;atp6v0ca-double morphant larvae or spns1-single morphants (log rank test: χ2 = 151.6 on one degree of freedom; P < 0.0001).
Figure 2.
Figure 2.
Counteractive balancing of developmental senescence induced by the defect of Spns1 and Atp6v0ca. (A) Induction of developmental senescence with the defect of either Spns1 or Atp6v0ca at 84 hpf. Scale bar: 500 µm. Quantification of the SA-Glb1 intensities is shown in the right graph (the number [n] of animals for each genotype = 6). Error bars represent the mean ± SD, ***P < 0.0005; ns, not significant. (B) Phenotype appearance of yolk opaqueness and survival of offspring cohorts from intercrosses of atp6v0cahi1207/+ fish. Comparisons of survival rates between wt (atp6v0ca+/+) and atp6v0cahi1207/hi1207 fish injected with spns1 MO are shown in the right survival curves (log rank test: χ2 = 99.36 on one degree of freedom; P < 0.0001). The arrows mark the yolk extension, which has largely regressed in embryos displaying the MOY phenotype. (C) Inverse correlation of strength of yolk opacity (NOR, normal; POY, partially opaque yolk; MOY, mostly opaque yolk) and SA-Glb1 activity in atp6v0ca-mutant animals injected with spns1 MO at 84 hpf. Scale bar: 500 µm. Quantification of the SA-Glb1 intensities is shown in the right graph (the number of animals for each genotype and phenotype = 6). Error bars represent the mean ± SD, **P < 0.001; ns, not significant. (D) Effect of a tp53 mutation on embryonic SA-Glb1 activity in the atp6v0ca mutant. The heritable impact of Tp53 and Atp6v0ca on SA-Glb1 induction was tested in each single-gene mutant (atp6v0cahi1207/hi1207 or tp53zdf1/zdf1) and double mutant atp6v0cahi1207/hi1207;tp53zdf1/zdf1 (atp6v0ca/;tp53 zdf1/zdf1) compared with WT animals at 84 hpf. Scale bar: 500 µm. Quantification of the SA-Glb1 intensities in WT, tp53zdf1/zdf1, atp6v0cahi1207/hi1207 and atp6v0cahi1207/hi1207;tp53zdf1/zdf1 animals, shown in the right graph (n = 10); the number (n) of animals is for each genotype. Error bars represent the mean ± SD, ***P < 0.0005; ns, not significant.
Figure 3.
Figure 3.
Premature autolysosomal fusion resulting from Atp6v0ca deficiency, as well as Spns1 deficiency. (A) Appearance of EGFP-Lc3B- and mCherry-Lamp1-positive autolysosomal fusion with Atp6v0ca deficiency, as well as Spns1 deficiency, was detectable. Embryos of EGFP-Lc3B- and mCherry-Lamp1-double transgenic spns1-mutant (Tg[CMV:EGFP-Lc3B;mCherry-Lamp1];spns1hi891/hi891) fish and EGFP-Lc3B- and mCherry-Lamp1-double transgenic atp6v0ca-mutant (Tg[CMV:EGFP-lc3b;eef1a1l1:mCherry-lamp1];atp6v0cahi1207/hi1207) fish were examined to confirm autophagosome-lysosome fusion at 76 hpf. Scale bar: 10 µm. Quantification of the EGF (green), mCherry (red) and merged (yellow) fluorescence-positive particle numbers is shown in the right graph (n = 6); the number (n) of animals is for each genotype and phenotype. Error bars represent the mean ± SD, *P < 0.005, **P < 0.001. Three independent areas (periderm or basal epidermal cells above the eye) were selected from individual animals. Western blot analysis using anti-Lc3A/B antibody shows endogenous Lc3A/B protein levels, which can confirm an increase of the total amount of Lc3A/B in wt, atp6v0cahi1207/hi1207- and spns1hi891/hi891-mutant fish. Increased Lc3A/B-II conversion or accumulation was detected slightly in atp6v0cahi1207/hi1207 and more significantly in spns1 mutants. (B) Most of the EGFP-Lc3B-positive autolysosomes were not LysoTracker Red-positive compartments. LysoTracker Red DND-99 staining of EGFP-Lc3B-transgenic spns1-mutant (Tg[CMV:EGFP-lc3b];spns1hi891/hi891) or atp6v0ca-mutant (Tg[CMV:EGFP-lc3b];atp6v0cahi1207/hi1207) embryos was performed at 76 hpf. Scale bar: 10 µm. Quantification of the EGFP (green) and LysoTracker (red) fluorescence-positive particle numbers is shown in the right graph (the number of animals for each genotype and phenotype = 6). Error bars represent the mean ± SD, **P < 0.001, ***P < 0.0005; ns, not significant. Three independent areas (periderm or basal epidermal cells above the eye) were selected from individual animals.
Figure 4.
Figure 4.
CRISPR/Cas9-mediated knockout of the atp6v0ca gene in spns1-mutant zebrafish. (A) Distance of the spns1 and atp6v0ca loci at the same linkage group of chromosome 3. M, mega-base pairs. (B) Schemes for trans- and cis-heterozygosity of the spns1 and atp6v0ca loci generated by Crisper/Cas9-mediated genome editing at chromosome 3. Chromosome pairs in the dashed “red” squares contain homozygous spns1 mutations with opaque-yolk phenotype and lethality. Chromosome pairs in the dashed “green” squares contain homozygous atp6v0ca mutations with hypopigmented phenotype and lethality. Double homozygous mutations generated by cis x cis concurrently show both opaque-yolk and hypopigmented phenotypes. (C) A schematic presentation of CRISPR/Cas9-mediated genome editing for the atp6v0ca gene. (D) Phenotype appearance of yolk opaqueness and survival of offspring cohorts from intercrosses (inx) of spns1hi891/+fish and spns1hi891/+;atp6v0cacm/+ fish. (E) SA-Glb1 images of spns1;atp6v0ca-double mutants with partially opaque yolk (POY) and mostly opaque yolk (MOY) phenotypes compared with a normal wild-type (WT) phenotype animal. Quantification of the SA-Glb1 intensities is shown in the right graph (n = 8); the number (n) of animals is for each genotype and phenotype. Error bars represent the mean ± SD, *P < 0.005, **P < 0.001, ***P < 0.0005. (F) Comparisons of survival rates between Spns1-deficient and double Spns1- and Atp6v0ca-deficient animals (log rank test: χ2 = 54.16 on one degree of freedom; P < 0.0001).
Figure 5.
Figure 5.
Autolysosomal biogenesis with the concurrent defect of both Atp6v0ca and Spns1 in zebrafish. (A) Subsequent formation of aberrant premature autolysosomes with concurrent deficiency of both Atp6v0ca (atp6v0cacm/cm) and Spns1 (spns1hi891/hi891) in double-homozygous mutant zebrafish (atp6v0cacm/cm;spns1hi891/hi891). Scale bar: 10 µm. Quantification of the EGFP (green), LysoTracker (red) and merged (yellow) fluorescence-positive particle numbers is shown in the right graph (the number of animals for each genotype and phenotype = 9). Three independent areas (periderm or basal epidermal cells above the eye) were selected from individual animals. Error bars represent the mean ± SD, *P < 0.005, **P < 0.001, ***P < 0.0005; ns, not significant. Three independent areas (periderm or basal epidermal cells above the eye) were selected from individual animals. (B) Acidity-dependent autolysosomal biogenesis is rate limiting in spns1- and atp6v0ca-mutant animals; intracellular constituents still have insufficient acidity in the double spns1;atp6v0ca mutants. Using 2 different acidic-sensitive probes, LysoSensor Green 189 and neutral-sensitive LysoSensor Green 153 (green), in combination with LysoTracker Red (red), WT and spns1-mutant animals showed detectable signals when stained at 72 hpf. In spns1-mutant animals, autolysosomal and/or lysosomal compartments were more prominently detectable by LysoSensor Green 153 than by LysoSensor Green 189, at the cellular level with enhanced signal intensity of these enlarged compartments. In stark contrast, the cellular compartments in WT fish treated with pepstatin A and E-64-d (P/E) (12-h treatment from 60 hpf through 72 hpf) were more prominently detectable by LysoSensor Green 189 than by LysoSensor Green 153 under the identical LysoTracker-staining conditions. Scale bar: 10 µm. Quantification of the LysoSensor (green), LysoTracker (red) and merged (yellow) fluorescence-positive particle is shown in the right graph (the number (n) of animals for each genotype and phenotype = 9). Three independent areas (periderm or basal epidermal cells above the eye) were selected from individual animals. Error bars represent the mean ± SD, *P < 0.005, **P < 0.001, ***P < 0.0005; ns, not significant. Three independent areas (periderm or basal epidermal cells above the eye) were selected from individual animals.
Figure 6.
Figure 6.
Gene expression analyses of senescence markers and/or mediators (glb1, serpine1 and rgn) in WT, spns1hi891/hi891 and spns1hi891/hi891;atp6v0cacm/cm (POY and MOY), and atp6v0cacm/cm (Mu; mutant) embryos from intercrosses (inx) of spns1hi891/+fish and spns1hi891/+;atp6v0cacm/+ fish at 72 hpf. Data are mean ±SD (n = 4 samples [3 embryos/sample] per genotype). Error bars represent the mean ± SD, *P < 0.05, **P < 0.01, ***P < 0.005; ns, not significant.
Figure 7.
Figure 7.
Survival control by balancing the deficiency between Spns1 and Atp6v0ca. (A) Appearance of an opaque-yolk phenotype (NOR; normal, POY; partially opaque yolk, MOY; mostly opaque yolk) in embryonic and larval spns1hi891/hi891 fish with the impact of atp6v0ca MO1. (B) Appearance of an opaque-yolk phenotype in embryonic and larval spns1hi891/hi891;atp6v0cacm/cm fish with the impact of atp6v0ca MO1. (C) Survival of embryonic and larval spns1hi891/hi891 fish with the impact of atp6v0ca MO1 (log rank test: χ2 = 139.9 on one degree of freedom; P < 0.0001). Inset shows Gompertz curves from survival data of embryo and larval zebrafish. (D) Survival of embryonic and larval spns1hi891/hi891;atp6v0cacm/cm fish with the impact of atp6v0ca MO1 (log rank test: χ2 = 56.43 on one degree of freedom; P < 0.0001). Inset shows Gompertz curves from survival data of embryo and larval zebrafish. (E) Comparisons of survival rates between Spns1-deficient and double Spns1- and Atp6v0ca-deficient animals with or without atp6v0ca MO (2 groups with atp6v0ca MO1; log rank test: χ2 = 7.735 on one degree of freedom; P < 0.0054, 4 groups with and without atp6v0ca MO1; log rank test: χ2 = 233.3 on 3 degrees of freedom; P < 0.0001).

References

    1. Cao L, Li W, Kim S, Brodie SG, Deng CX. Senescence, aging, and malignant transformation mediated by p53 in mice lacking the Brca1 full-length isoform. Genes Dev 2003; 17(2):201; PMID:12533509; http://dx.doi.org/ 10.1101/gad.1050003 - DOI - PMC - PubMed
    1. Keyes WM, Wu Y, Vogel H, Guo X, Lowe SW, Mills AA. p63 deficiency activates a program of cellular senescence and leads to accelerated aging. Genes Dev 2005; 19(17):1986. - PMC - PubMed
    1. Cao L, Xu X, Bunting SF, Liu J, Wang RH, Cao LL, Wu JJ, Peng TN, Chen J, Nussenzweig A, et al.. A selective requirement for 53BP1 in the biological response to genomic instability induced by Brca1 deficiency. Mol Cell 2009; 35(4):534; PMID:19716796; http://dx.doi.org/ 10.1016/j.molcel.2009.06.037 - DOI - PMC - PubMed
    1. Kishi S, Bayliss PE, Uchiyama J, Koshimizu E, Qi J, Nanjappa P, Imamura S, Islam A, Neuberg D, Amsterdam A, et al.. The identification of zebrafish mutants showing alterations in senescence-associated biomarkers. PLoS Genet 2008; 4(8):e1000152; PMID:18704191; http://dx.doi.org/ 10.1371/journal.pgen.1000152 - DOI - PMC - PubMed
    1. Storer M, Mas A, Robert-Moreno A, Pecoraro M, Ortells MC, Di Giacomo V, Yosef R, Pilpel N, Krizhanovsky V, Sharpe J, et al.. Senescence is a developmental mechanism that contributes to embryonic growth and patterning. Cell 2013; 155(5):1119; PMID:24238961; http://dx.doi.org/ 10.1016/j.cell.2013.10.041 - DOI - PubMed

MeSH terms