. 2017 Feb 1;220(Pt 3):358-368.
doi: 10.1242/jeb.151043. Epub 2016 Nov 10.

Reversible developmental stasis in response to nutrient availability in the Xenopus laevis central nervous system

Affiliations

Reversible developmental stasis in response to nutrient availability in the Xenopus laevis central nervous system

C R McKeown et al. J Exp Biol. .

Abstract

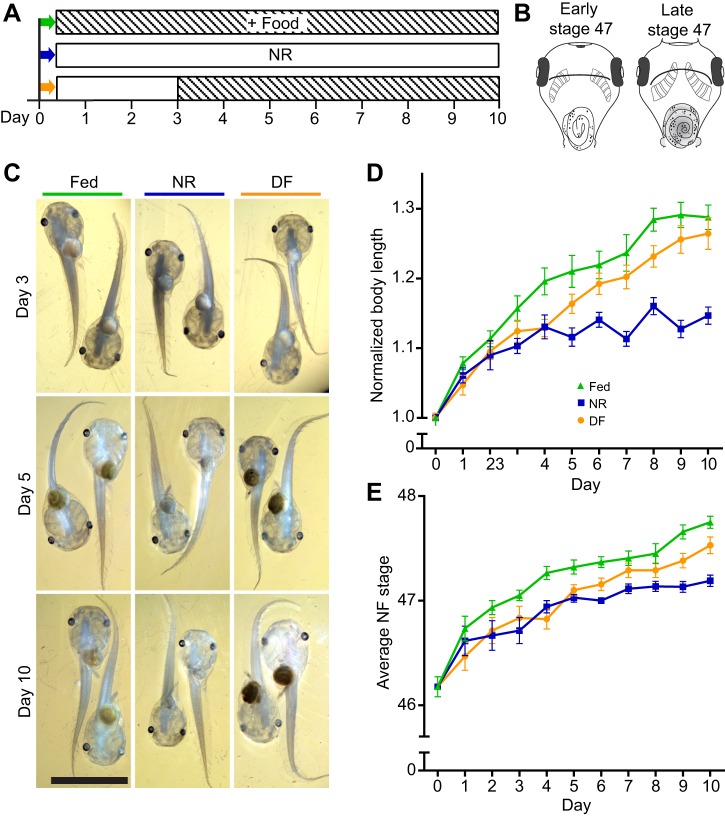
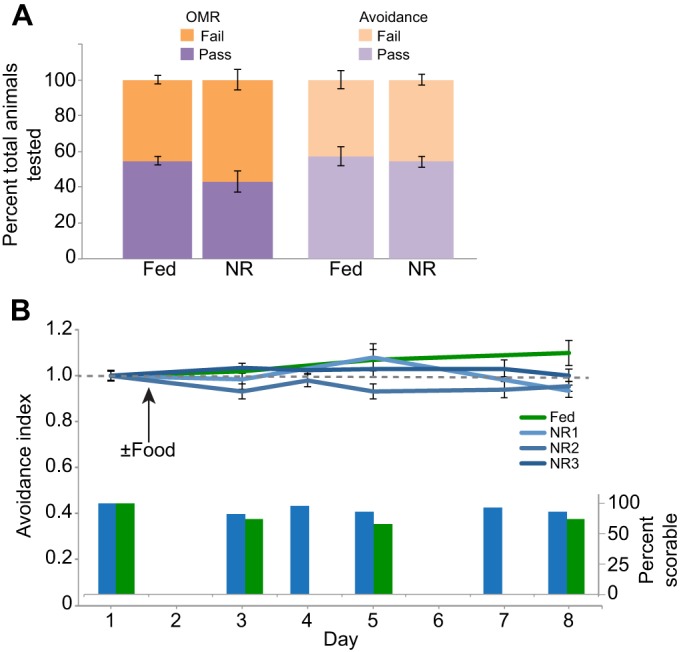
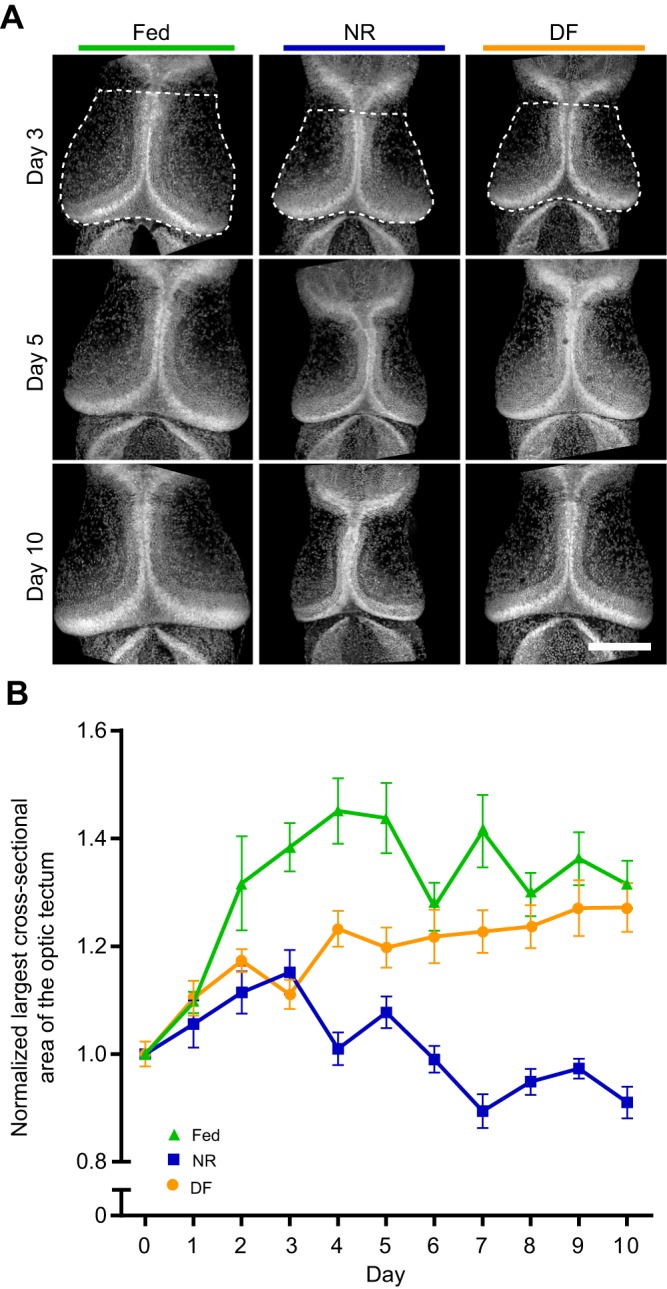
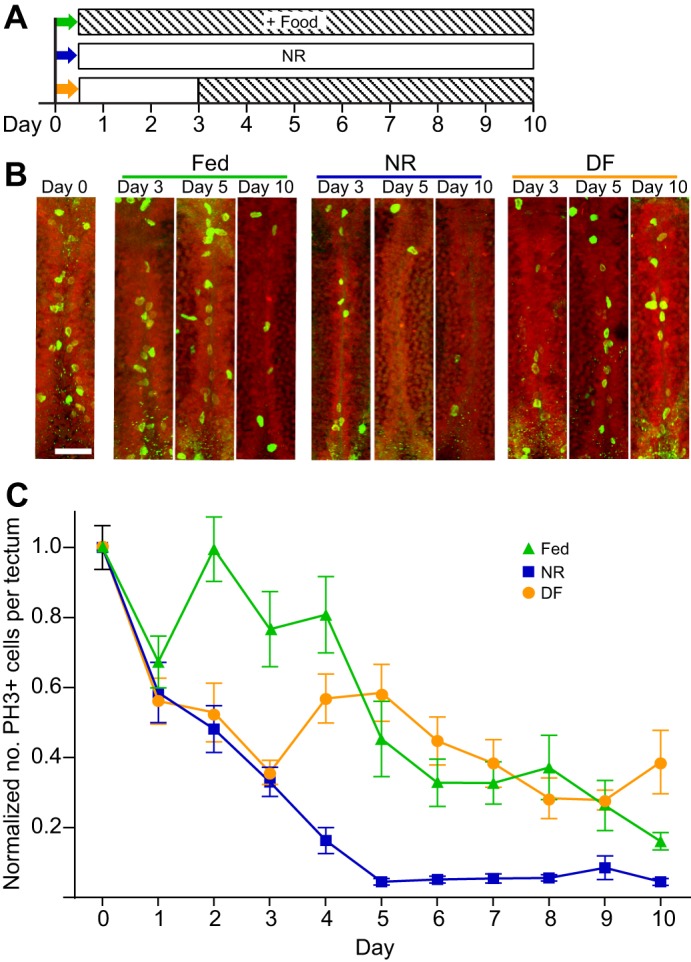
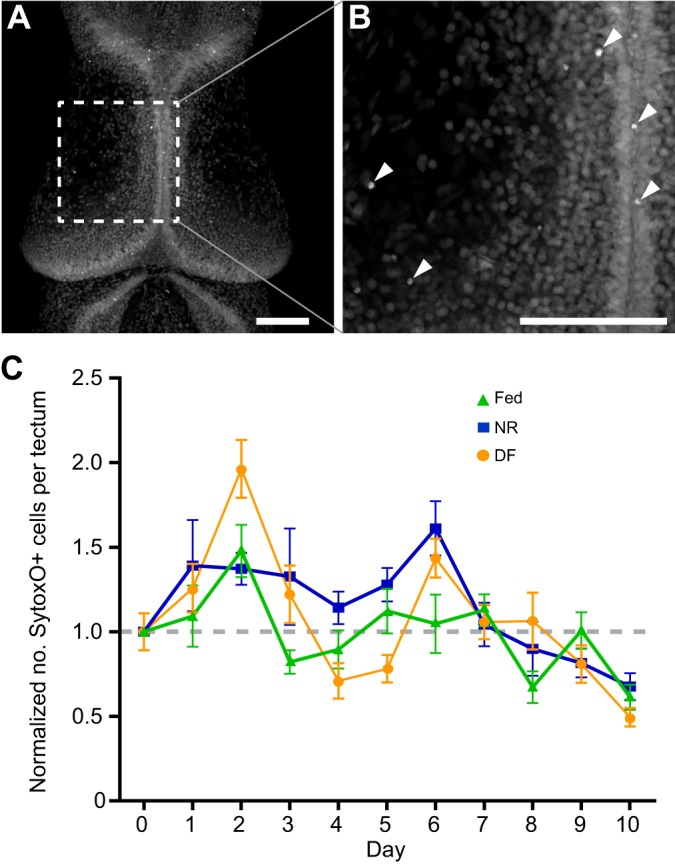
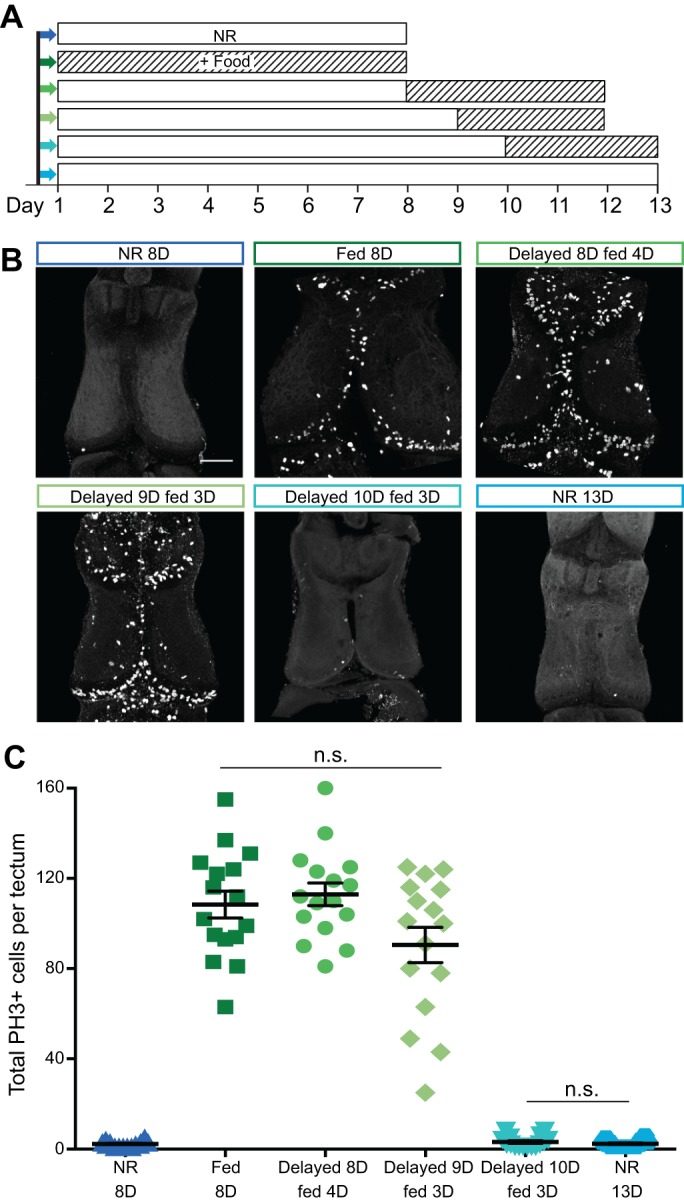
Many organisms confront intermittent nutrient restriction (NR), but the mechanisms to cope with nutrient fluctuations during development are not well understood. This is particularly true of the brain, the development and function of which is energy intensive. Here we examine the effects of nutrient availability on visual system development in Xenopus laevis tadpoles. During the first week of development, tadpoles draw nutrients from maternally provided yolk. Upon yolk depletion, animals forage for food. By altering access to external nutrients after yolk depletion, we identified a period of reversible stasis during tadpole development. We demonstrate that NR results in developmental stasis characterized by a decrease in overall growth of the animals, a failure to progress through developmental stages, and a decrease in volume of the optic tectum. During NR, neural progenitors virtually cease proliferation, but tadpoles swim and behave normally. Introducing food after temporary NR increased neural progenitor cell proliferation more than 10-fold relative to NR tadpoles, and cell proliferation was comparable to that of fed counterparts 1 week after delayed feeding. Delayed feeding also rescued NR-induced body length and tectal volume deficits and partially rescued developmental progression defects. Tadpoles recover from developmental stasis if food is provided within the first 9 days of NR, after which access to food fails to increase cell proliferation. These results show that early stages of tadpole brain development are acutely sensitive to fluctuations in nutrient availability and that NR induces developmental stasis from which animals can recover if food becomes available within a critical window.

Keywords: Development; Nutrition; Optic tectum; Stasis; Xenopus.


Conflict of interest statement

Competing interests

The authors declare no competing or financial interests.

Figures

Fig. 1.
Fig. 1.
Nutrient availability regulates Xenopus laevis tadpole growth and progression through developmental stages. (A) Schematic of experimental timeline. Day 0 is defined as stage 46. Some animals were euthanized at day 0 and the rest were separated into three nutritional treatment groups: fed=continuously fed twice a day for 10 days (green, top); NR=nutrient restricted for 10 days (blue, middle); and DF=nutrient restricted to day 3 and then fed twice a day for 7 days (orange, bottom). Empty boxes indicate no additional feeding; striped boxes indicate supplemental food. Colors in A correspond to images in C and data in D and E. (B) Depiction of early and late stage 47 animals. (C) Representative images of tadpoles from each group from three time points, ventral side visible. Scale bar, 5 mm. (D) Plot of normalized body length in tadpoles from the three different nutritional groups defined in A: fed (green triangles), NR (blue squares) and DF (orange circles). NR led to significantly shorter body lengths starting on Day 4. DF reversed the increase in body length starting on day 5. (E) Plot of Nieuwkoop–Faber stage in the three different nutritional treatment groups defined in A. NR slowed average progression of development, and DF significantly increased progression of development by day 6. Refer to Table 1 for data and Table 2 for corresponding statistics; n=500 animals total from two independent clutches, with a subset of 11–22 animals measured per group per time point.
Fig. 2.
Fig. 2.
Locomotory activity and avoidance behavior are resistant to temporary nutrient restriction. (A) Fed and NR animals were screened for the visually mediated behaviors optomotor response (OMR) and avoidance. The fraction of animals that passed and failed the visual screening tests is plotted; groups were not statistically significant from each other for either visual stimulus. n=439 animals total, including n=182 for the two NR groups and n=257 in the three fed groups. 54.8±2.4% of fed and 43.1±5.8% of NR animals passed the OMR screening (P=0.2), while 54.2±3.0% of fed and 57.1±5.1% of NR animals subsequently performed the visual avoidance task (P=0.11). (B) Animals were tested for visual avoidance behavior daily over the course of 7 days. The avoidance index is a ratio of the number of times an animal turns to avoid an approaching stimulus over 10 encounters with the stimulus. Note that animals must be swimming to show an avoidance response. Data shown are as means±s.e.m. To keep timelines consistent throughout the paper, behavior tests begin at day 1 because animals do not perform the visual avoidance test until stage 47. Three different NR groups (blues) are presented to show variability among different clutches, compared with a single continuously fed control (green). n≥16 animals per group, with the same animals tested daily over the course of the experiment. Inset bar graph in B displays the percent of animals that were scorable and included in the analysis at each time point during the course of the experiment shown above, with the three NR groups pooled.
Fig. 3.
Fig. 3.
Nutrient availability regulates growth of the X. laevis optic tectum. Experimental timeline is identical to that in Fig. 1. (A) Representative images of the midbrain from tadpoles from three selected time points. Dotted lines in top left panel are shown as an example to indicate area measured. Scale bar, 200 µm. (B) Plot of the largest cross-sectional area of the optic tectum in NR (blue squares), fed (green triangles) and DF (orange circles) groups, shown as means±s.e.m. and normalized to day 0. NR led to smaller tectum cross-sectional areas by day 3 relative to fed groups. DF on day 3 promoted growth, allowing midbrain size to catch up to that of fed animals. Cross-sectional area in NR animals (blue squares) reversed, with tectum sizes declining to below the day 0 baseline by day 7. Refer to Table 1 for data and Table 3 for corresponding statistics; n=500 animals total from two independent clutches, with 11–22 animals measured per group per time point.
Fig. 4.
Fig. 4.
Nutrient availability controls cell proliferation in the X. laevis optic tectum. (A) Experimental timeline (identical to that in Fig. 1). (B) Confocal z-projections of the medial ventricular layer of the optic tectum labeled for phospho-histone H3 (PH3) (bright green dividing nuclei) and Sytox Orange (SytoxO; red label in all nuclei) at day 0 (left) and at days 3, 5 and 10 from NR, fed and DF groups. Scale bar, 40 µm. (C) Plot of the number of PH3+ cells in the ventricular zone of the optic tectum (mean±s.e.m. normalized to day 0) in NR (blue squares), fed (green triangles) and DF (orange circles) groups over time. NR led to significantly reduced levels of proliferation by Day 2. DF significantly increased the number of PH3+ cells on day 4. Refer to Table 1 for data and Table 3 for corresponding statistics; n=500 animals total from two independent clutches, with a subset of 11–22 animals measured per group per time point.
Fig. 5.
Fig. 5.
Nutrient availability does not cause cell death in the X. laevis optic tectum. Experimental timeline is identical to that in Fig. 1. (A) Confocal z-projection of the optic tectum stained with SytoxO nuclear label. Scale bar, 100 µm. (B) Increased magnification of region in A indicated by dashed lines. Scale bar, 100 µm. Arrowheads show dying cells, characterized by having small, intensely stained SytoxO+ nuclei. (C) Plot of the number of dying SytoxO+ cells in the optic tectum in NR (blue squares), fed (green triangles) and DF (orange circles) groups, shown as means±s.e.m., normalized to day 0. There are no significant changes in number of dying cells between groups across the time course. Refer to Table 1 for data and Table 3 for corresponding statistics; n=500 animals total from two independent clutches, with a subset of 11–22 animals measured per group per time point.
Fig. 6.
Fig. 6.
Nutrient restriction causes reversible neurogenic stasis in X. laevis tadpoles. (A) Experimental schematic. Empty boxes indicate no additional feeding; striped boxes indicate supplemental food. Colors in A correspond to images in B and data in C. (B) Representative confocal z-projections of the optic tectum from groups defined in A. Brains are processed for PH3 whole-mount immunofluorescence to label proliferating cells. Scale bar, 100 µm. (C) Quantitation of proliferation in each group. Absolute values of PH3+ cells per tectum are shown, with bars indicating means±s.e.m. Without feeding, animals have very low levels of proliferation in the tectum (dark blue triangles in first column). Continuous access to food increases proliferation (dark green squares in second column). Unfed animals can recover normal proliferative levels upon feeding after 8 or 9 days (increasingly lighter greens, circles in third column and diamonds in fourth column). After 10 days without food (aqua inverted triangles in fifth column), proliferation levels are unrecoverable and identical to long-term unfed animals (light blue hexagons in last column). n=16 animals total from two independent clutches for each group. The only significant differences are between the blue and green groups (P<0.0001), with no significant differences within the green or blue groups.

Similar articles

Cited by

References

    1. Baugh L. R. (2013). To grow or not to grow: nutritional control of development during Caenorhabditis elegans L1 arrest. Genetics 194, 539-555. 10.1534/genetics.113.150847 - DOI - PMC - PubMed
    1. Baugh L. R. and Sternberg P. W. (2006). DAF-16/FOXO regulates transcription of cki-1/Cip/Kip and repression of lin-4 during C. elegans L1 arrest. Curr. Biol. 16, 780-785. 10.1016/j.cub.2006.03.021 - DOI - PubMed
    1. Baugh L. R., DeModena J. and Sternberg P. W. (2009). RNA Pol II accumulates at promoters of growth genes during developmental arrest. Science 324, 92-94. 10.1126/science.1169628 - DOI - PubMed
    1. Bestman J. E., Lee-Osbourne J. and Cline H. T. (2012). In vivo time-lapse imaging of cell proliferation and differentiation in the optic tectum of Xenopus laevis tadpoles. J. Comp. Neurol. 520, 401-433. 10.1002/cne.22795 - DOI - PMC - PubMed
    1. Birket M. J., Orr A. L., Gerencser A. A., Madden D. T., Vitelli C., Swistowski A., Brand M. D. and Zeng X. (2011). A reduction in ATP demand and mitochondrial activity with neural differentiation of human embryonic stem cells. J. Cell Sci. 124, 348-358. 10.1242/jcs.072272 - DOI - PMC - PubMed

LinkOut - more resources