. 2016 Dec 30;291(53):27387-27402.
doi: 10.1074/jbc.M116.751289. Epub 2016 Nov 15.

The Fission Yeast Pre-mRNA-processing Factor 18 (prp18+) Has Intron-specific Splicing Functions with Links to G1-S Cell Cycle Progression

Affiliations

The Fission Yeast Pre-mRNA-processing Factor 18 (prp18+) Has Intron-specific Splicing Functions with Links to G1-S Cell Cycle Progression

Nagampalli Vijaykrishna et al. J Biol Chem. .

Abstract

The fission yeast genome, which contains numerous short introns, is an apt model for studies on fungal splicing mechanisms and splicing by intron definition. Here we perform a domain analysis of the evolutionarily conserved Schizosaccharomyces pombe pre-mRNA-processing factor, SpPrp18. Our mutational and biophysical analyses of the C-terminal α-helical bundle reveal critical roles for the conserved region as well as helix five. We generate a novel conditional missense mutant, spprp18-5 To assess the role of SpPrp18, we performed global splicing analyses on cells depleted of prp18+ and the conditional spprp18-5 mutant, which show widespread but intron-specific defects. In the absence of functional SpPrp18, primer extension analyses on a tfIId+ intron 1-containing minitranscript show accumulated pre-mRNA, whereas the lariat intron-exon 2 splicing intermediate was undetectable. These phenotypes also occurred in cells lacking both SpPrp18 and SpDbr1 (lariat debranching enzyme), a genetic background suitable for detection of lariat RNAs. These data indicate a major precatalytic splicing arrest that is corroborated by the genetic interaction between spprp18-5 and spprp2-1, a mutant in the early acting U2AF59 protein. Interestingly, SpPrp18 depletion caused cell cycle arrest before S phase. The compromised splicing of transcripts coding for G1-S regulators, such as Res2, a transcription factor, and Skp1, a regulated proteolysis factor, are shown. The cumulative effects of SpPrp18-dependent intron splicing partly explain the G1 arrest upon the loss of SpPrp18. Our study using conditional depletion of spprp18+ and the spprp18-5 mutant uncovers an intron-specific splicing function and early spliceosomal interactions and suggests links with cell cycle progression.

Keywords: RNA splicing; Schizosaccharomyces pombe; SpPrp18; functional genomics; intron-specific splicing; molecular genetics; mutagenesis; splicing microarrays.


Figures

FIGURE 1.
FIGURE 1.
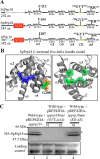
Residues in conserved region and helix 5 of SpPrp18 have critical roles. A, domain architecture with schematic representation of primary structures of Prp18 from budding yeast, fission yeast, and humans. The positions of the helices and loops within the conserved five-helical bundle in the C-terminal region are indicated. The amino acids mutated in SpPrp18 and the corresponding homologous residues in ScPrp18 and hPrp18 are highlighted. The dotted line between hashes indicates unaligned amino acids, and the yellow dotted line indicates the CR loop between helix 4 and 5. B, two representations of the five α-helix bundle model for the SpPrp18 C-terminal domain predicted by homology modeling using budding yeast ScPrp18Δ79. The various helices are indicated. Residues chosen for mutational analyses are highlighted with their side chains. The left panel shows surface-exposed residues where positively charged amino acids are in blue, polar residues in orange, and hydrophobic residue in green. The right panel shows hydrophobic buried residues in green. C, immunoblotting of SpPrp18 mutant proteins. The HA epitope-tagged wild-type SpPrp18 or mutant proteins, expressed from the pREP42HA vector in wild-type (FY528) cells, were assessed by immunoblotting with anti-HA antibody. The levels of SpPrp18 wild-type or G288A/V289A/T290A or K325A/R326E mutant proteins are shown in lanes 1–4. Two independent colonies were tested for the presence of HA-tagged SpPrp18-G288A/V289A/T290A mutant (lanes 2 and 3). Lysates are labeled above and Coomassie-stained loading control is shown below each lane. *, slow mobility form of SpPrp18.
FIGURE 2.
FIGURE 2.
SpPrp18V194R mutant confers reduced growth due to altered thermodynamic stability of the protein. A, diagrammatic representation of WT and prp18-5 strains with integrations at the leu1+ locus of nmt81 promoter-driven spprp18+ or prp18V194R ORFs. 10-fold serial dilutions of these cell cultures grown at 30 °C were made and spotted on EMM L-media without (first row) or with (second row) 15 μm thiamine. For each strain, a suspension with starting optical density of 0.4 was first spotted, which was followed by subsequent dilutions. The third and fourth rows are serial dilutions of WT and prp18-5 strains that were transformed with a plasmid expressing spprp18+ from native promoter (pDBlet spprp18+). All plates were incubated at 30 °C for 3–4 days. B, cell lysates from a strain expressing wild-type SpPrp18 protein grown in the absence and presence of thiamine (lanes 1 and 2), lysates from similarly treated prp18-5 cells (lanes 3 and 4), and lysates of wild-type (FY528) (lane 5) were analyzed by Western blotting using SpPrp18 polyclonal sera as described under “Experimental Procedures.” *, slow mobility form of SpPrp18. C, immunoblotting analysis on crude whole cell extracts from spprp18:his3+ pREP42HA-spprp18+ cells using monoclonal anti-HA antibodies (top). Two forms of the epitope-tagged wild-type protein are detected. Coomassie-stained gel post-transfer serves as the loading control. D, thermodynamic stability of bacterially expressed and purified wild-type SpPrp18 (left) and mutant SpPrp18 V194R (right) proteins. Far UV circular dichroism spectroscopy of 12 nm protein solutions subjected to temperatures from 20 to 90 °C are shown. E, steady-state emission spectra (300–450 nm) of the intrinsic tryptophan fluorescence of 9.8 μm wild-type (left) and mutant (right) protein solutions. Excitation was at 295 nm, and emission spectra were recorded over a range of temperatures.
FIGURE 3.
FIGURE 3.
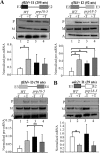
Loss of functional SpPrp18 results in intron-specific splicing defects. A and B, investigations of the splicing status of three introns in tfIId+ and the ade2+ intron 1. Schematic representations show each intron together with its flanking exons. Intron length is given within brackets. RNA from WT and prp18-5 cells grown at 30 °C for 36 h in the presence (+T) and absence (−T) of 15 μm thiamine was taken for limiting cycle, tracer-labeled ([α-32P]dATP) semiquantitative RT-PCR. For each intron, the pre-mRNA (P) or mRNA (M) levels were normalized to that of the intronless act1+ (A) mRNA. The normalized pre-mRNA or mRNA levels, from 3–4 biological replicates, are plotted with WT−T (white bar, lane 1), WT+T (gray bar, lane 2), prp18-5−T (black bar, lane 3), and prp18-5+T (dark gray bar, lane 4). Error bars, S.D. *, p < 0.05 as determined by unpaired Student's t test. ns, non-significant change with p > 0.05.
FIGURE 4.
FIGURE 4.
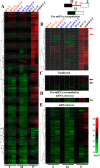
Global splicing analysis of SpPrp18 shows a range of splicing phenotypes. Shown is a schematic representation of a pre-mRNA and mRNA isoform with the positions of the multiple probes: intronic (P), splice junction (M), intron exon junction (IE), and gene expression (T). A, heat map representation of the hierarchical clustering of the -fold changes in cells before and after depletion of wild-type SpPrp18 (WTT and WT+T) and cells expressing mutant SpPrp18-5 protein (prp18-5T), seen for the stringent subset of 253 introns. The probes are specified below, and the -fold changes were obtained upon zero transforming to the untreated wild-type RNA (WTT) in two biological replicates. Color coding represents -fold change in log2 scale. Each horizontal row depicts the -fold change of the normalized transcript isoform for an individual intron as detected by the probes labeled below. Each vertical row represents the average of two biological replicate cultures grown either in the presence or the absence of thiamine. The expanded heat map representations of the subcategories of splicing defects are shown to the right in B–E. B–E, heat map representation of different categories of splicing defects, introns with pre-mRNA accumulation and mRNA decrease (D), unaffected introns (C), introns showing only pre-mRNA accumulation (B), and those with only decrease of mRNA (E). Indicated by colored arrows are the representative introns chosen for RT-PCR validation in Fig. 5.
FIGURE 5.
FIGURE 5.
Validation by semiquantitative RT-PCR analysis of the three categories of splicing phenotypes inferred from microarray analyses. A, splicing status of mdm35+ intron 1 measured by semiquantitative RT-PCR as a representative of the subcategory with both pre-mRNA accumulation and mRNA decrease on depletion of SpPrp18. B, splicing status of spf38+ intron 5 and sfc9+ intron 2 as representatives for the intron class showing accumulation of unspliced pre-mRNA without change in mRNA levels in cells depleted of SpPrp18. C, ubc4+ intron 1 and cwf2+ intron 1 represent a subcategory of introns unaffected by the absence of SpPrp18. Semiquantitative RT-PCRs were carried out using tracer label as described under “Experimental Procedures.” The -fold change accumulation or reduction of various transcript forms was calculated by densitometric analysis of the amplicon from pre-mRNA and mRNA species after normalization to the intronless act1+ transcript, as described in the legend to Fig. 3. P, pre-mRNA; M, mRNA; A, intronless act1+ mRNA. Bars, average value from three biological replicates; error bars, S.D. *, p < 0.05; **, p < 0.01; ***, p < 0.005, as determined by unpaired Student's t test. ns, non-significant change with p > 0.05 as determined by unpaired Student's t test. D, in vivo splicing analysis of ubc4+ intron 1 and cwf2+ intron 1 for splicing in slu7+ and slu7-2 mutant cells grown in the absence and presence of 15 μm thiamine (−T and +T) for 28 h using semiquantitative RT-PCR.
FIGURE 6.
FIGURE 6.
Early precatalytic splicing arrest and genetic interactions of SpPrp18. A, primer extensions to measure products from mRNA, pre-mRNA, and lariat intermediate species for tfIId+ intron 1 using 5′ end-radiolabeled exonic reverse primer. Schematic representations for each of these are shown on the far right. In the left panel, RNA from WT (leu1:spprp18+) −T and +T (lanes 1 and 2) cells and from prp18-5(leu1:spprp18V194R) −T and +T (lanes 3 and 4) are shown. In the right panel, RNA from WT dbr1Δ −T and +T (lanes 1 and 2) cells and from prp18-5 dbr1Δ −T and +T cells (lanes 3 and 4) were used. The dashed line with an open arrowhead points to the very minor lariat-intermediate species. Primer extensions for the intronless snu2+ RNA were taken as loading controls (smaller panel). The labeled DNA used as marker are shown in the far left and right lanes in both larger panels. B, growth kinetics of WT (leu1:spprp18+) dbr1Δ and prp18-5 (leu1:spprp18V194R) dbr1Δ cells compared with single mutants prp18-5 and dbr1Δ and with wild-type cells. Growth was tested at permissive temperature (28 °C) in the presence and absence of 15 μm thiamine. 10-fold serial dilutions of cultures were made as described in the legend to Fig. 2A. C, growth kinetics of prp18- 5(leu1:spprp18V194R) and as a double mutant with prp2-1 show their genetic interactions. Cultures were grown in EMM complete media in the presence and in the absence of 15 μm thiamine at 28 °C. 10-fold serial dilutions of these cultures made as described in the legend to Fig. 2A were spotted onto the different agar plates and incubated at indicated temperatures. D, semiquantitative RT-PCR analysis of in vivo splicing of representative spf38+ intron 5 (left) and tfIId+ intron 1 (right) in prp18-5, prp2-1, and prp18-5 prp2-1 cells grown in the absence and presence of thiamine (−T and +T). Intronless act1+ was used as a normalizing control. P, unspliced pre-mRNA; M, spliced mRNA.
FIGURE 7.
FIGURE 7.
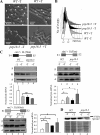
Cell cycle arrest in the prp18-5 mutant and in wild-type cells depleted of spprp18+. A, cell morphology in WT and prp18-5 strains grown at 30 °C in the absence (−T) and presence of thiamine (+T). Fluorescence images of DAPI-stained nuclei were overlaid with bright field images of cells. B, DNA content of WT or prp18-5 cells as determined by FACS analysis described under “Experimental Procedures.” Cells in WT−T culture are shown by the white curve, in WT+T by the gray curve, in prp18-5−T by the black curve, and in prp18-5 +T cultures by a dark gray curve. The DNA content (PI(DNA)) and relative cell number are plotted along the x and y axes, respectively. The positions of peaks for 1C and 2C DNA content are indicated. C, splicing status of some intron-containing transcripts encoding factors critical for G1-S transition: cdc2+ intron 4, skp1+ intron 1, and res2+ intron 1. Splicing status in WT and prp18-5 cells was determined through limiting cycle semiquantitative RT-PCRs as described in the legend to Fig. 3. For each intron, densitometric values for amplicons representing mRNA or pre-mRNA species were normalized to that from intronless act1+ (y axis). White bar, data from WT−T cultures; gray bar, data from WT+T cultures; black bar, data from prp18-5 −T cultures; dark gray bar, data from prp18-5+T cultures. *, p < 0.05 calculated using unpaired t test for data from multiple experiments (n =3 or 4). D, Western blotting analysis of SpCdc2 protein levels in whole cell lysates of WT and prp18-5 cells grown in the absence and presence of thiamine (−T and +T) at 30 °C. Coomassie-stained gel post-transfer served as the loading control.

References

    1. Burge C. B., Tuschl T., and Sharp P. A. (1999) Splicing of precursors to mRNAs by the spliceosomes. in RNA World, 2nd Ed (Gesteland R. F., Cech T. R., and Atkins J. F.) pp. 525–560, Cold Spring Harbor Laboratory Press, Cold Spring Harbor, NY
    1. Will C. L., and Lührmann R. (2006) Spliceosome Structure and Function. in RNA World, 3rd Ed (Gesteland R. F., Cech T. R., and Atkins J. F.) pp. 369–400, Cold Spring Harbor Laboratory, Cold Spring Harbor, NY
    1. Umen J. G., and Guthrie C. (1995) The second catalytic step of pre-mRNA splicing. RNA 1, 869–885 - PMC - PubMed
    1. Horowitz D. S., and Krainer A. R. (1997) A human protein required for the second step of pre-mRNA splicing is functionally related to a yeast splicing factor. Genes Dev. 11, 139–151 - PubMed
    1. Zhou Z., and Reed R. (1998) Human homologs of yeast prp16 and prp17 reveal conservation of the mechanism for catalytic step II of pre-mRNA splicing. EMBO J. 17, 2095–2106 - PMC - PubMed

MeSH terms

Associated data

LinkOut - more resources