. 2016 Dec 30;291(53):27023-27041.
doi: 10.1074/jbc.M116.761015. Epub 2016 Nov 14.

Extending Halogen-based Medicinal Chemistry to Proteins: IODO-INSULIN AS A CASE STUDY

Affiliations

Extending Halogen-based Medicinal Chemistry to Proteins: IODO-INSULIN AS A CASE STUDY

Krystel El Hage et al. J Biol Chem. .

Abstract

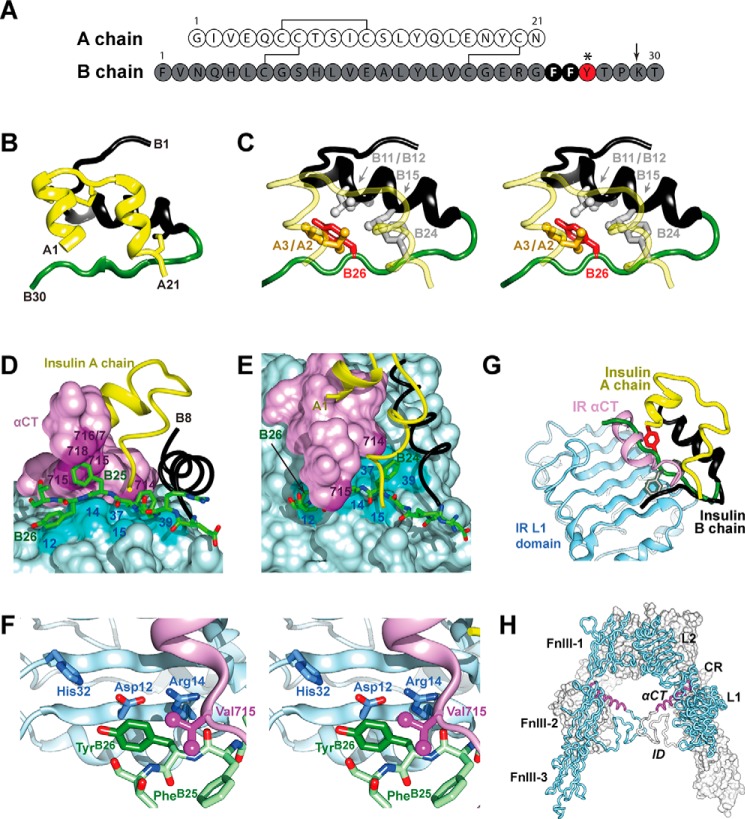
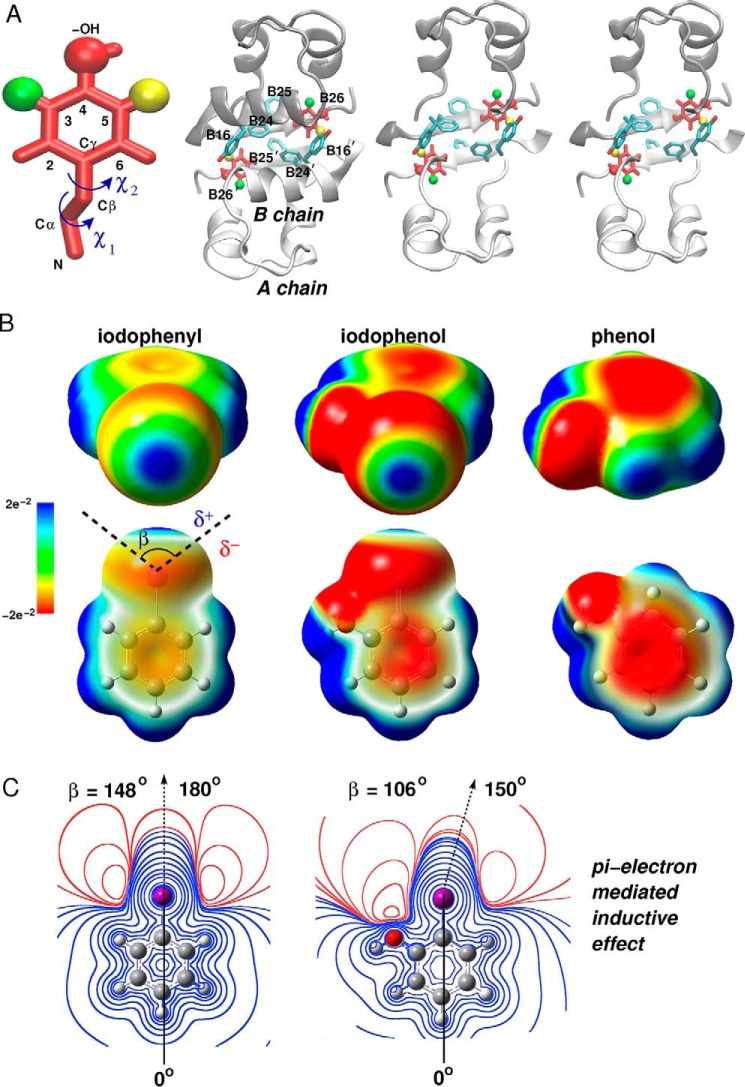
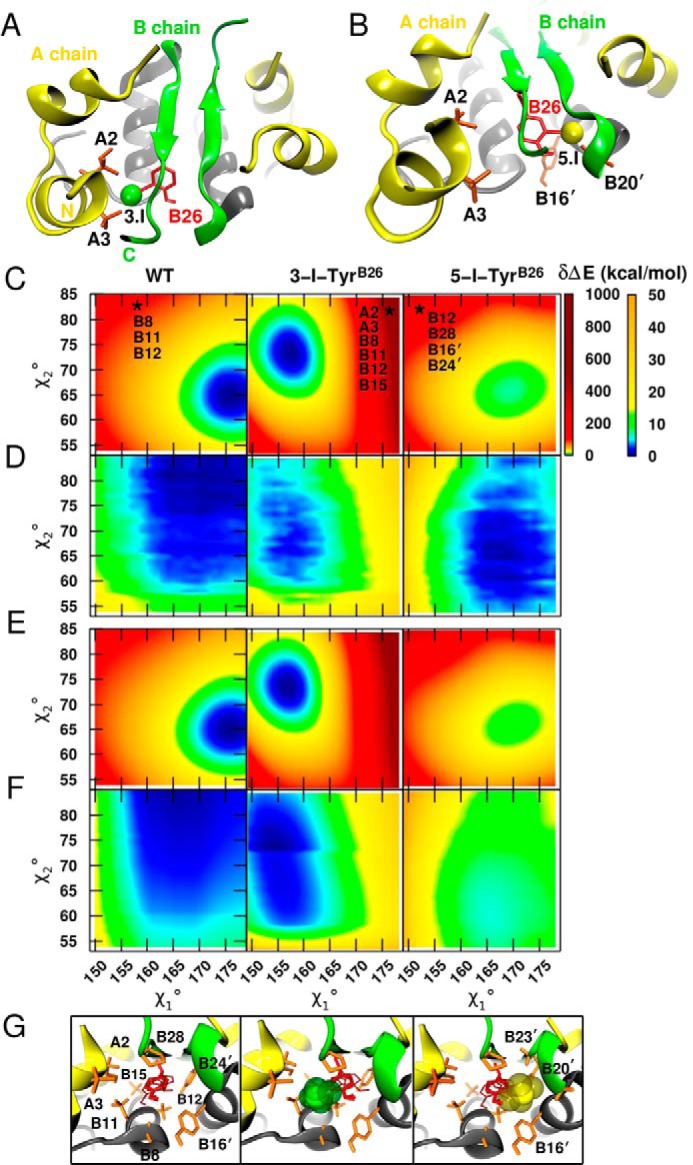
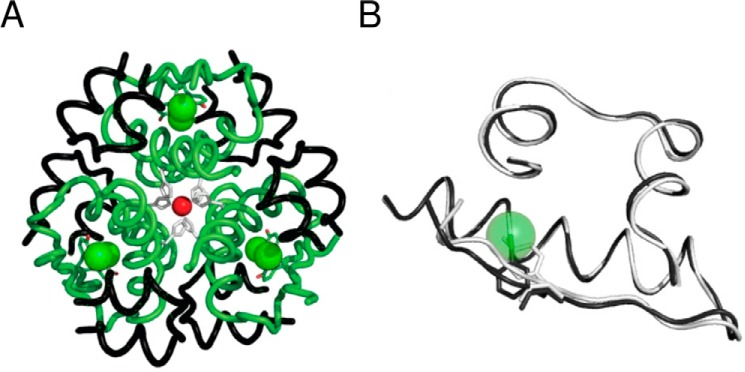
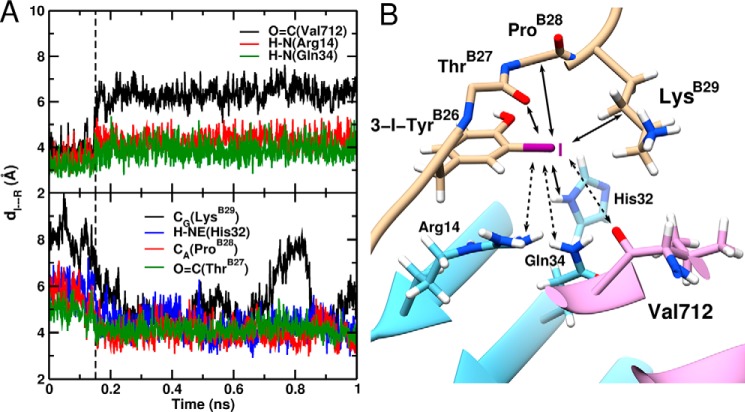
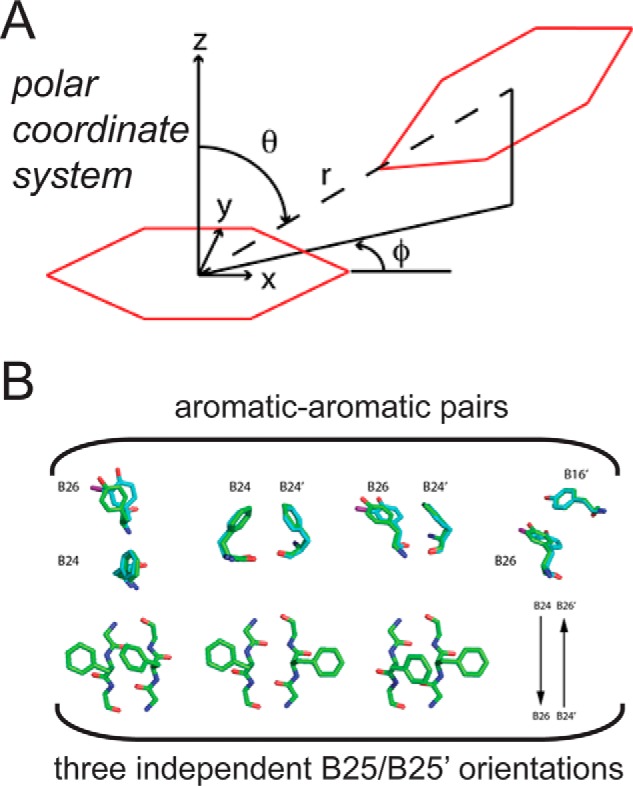
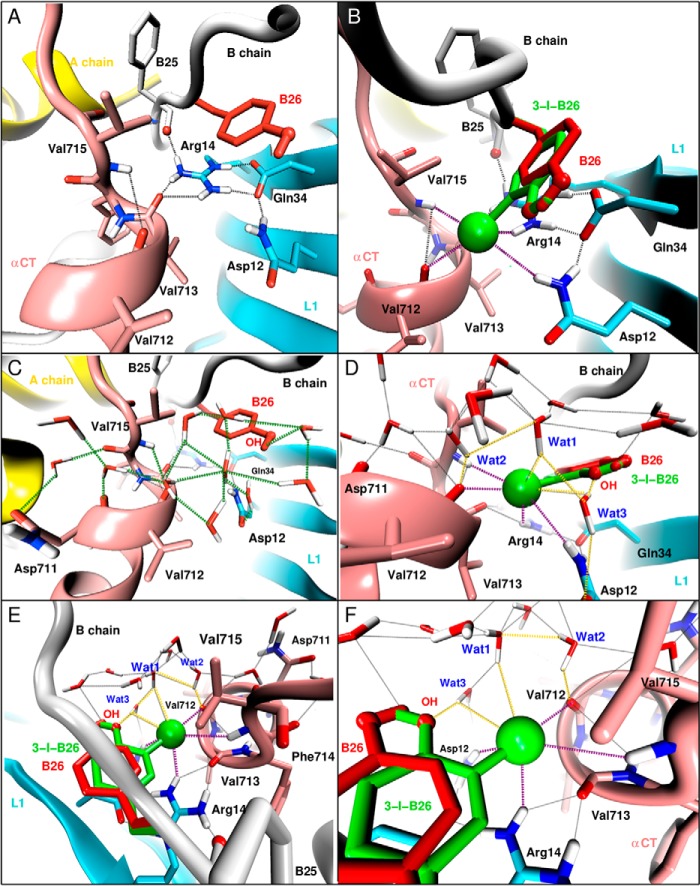
Insulin, a protein critical for metabolic homeostasis, provides a classical model for protein design with application to human health. Recent efforts to improve its pharmaceutical formulation demonstrated that iodination of a conserved tyrosine (TyrB26) enhances key properties of a rapid-acting clinical analog. Moreover, the broad utility of halogens in medicinal chemistry has motivated the use of hybrid quantum- and molecular-mechanical methods to study proteins. Here, we (i) undertook quantitative atomistic simulations of 3-[iodo-TyrB26]insulin to predict its structural features, and (ii) tested these predictions by X-ray crystallography. Using an electrostatic model of the modified aromatic ring based on quantum chemistry, the calculations suggested that the analog, as a dimer and hexamer, exhibits subtle differences in aromatic-aromatic interactions at the dimer interface. Aromatic rings (TyrB16, PheB24, PheB25, 3-I-TyrB26, and their symmetry-related mates) at this interface adjust to enable packing of the hydrophobic iodine atoms within the core of each monomer. Strikingly, these features were observed in the crystal structure of a 3-[iodo-TyrB26]insulin analog (determined as an R6 zinc hexamer). Given that residues B24-B30 detach from the core on receptor binding, the environment of 3-I-TyrB26 in a receptor complex must differ from that in the free hormone. Based on the recent structure of a "micro-receptor" complex, we predict that 3-I-TyrB26 engages the receptor via directional halogen bonding and halogen-directed hydrogen bonding as follows: favorable electrostatic interactions exploiting, respectively, the halogen's electron-deficient σ-hole and electronegative equatorial band. Inspired by quantum chemistry and molecular dynamics, such "halogen engineering" promises to extend principles of medicinal chemistry to proteins.

Keywords: diabetes; diabetes mellitus; hormone; molecular dynamics; non-standard mutagenesis; quantum chemistry; quantum mechanics; weakly polar.


Figures

FIGURE 1.
FIGURE 1.
Insulin sequence and structure. A, sequence of WT insulin and modification sites. A and B chains are shown in white and gray. Conserved aromatic residues PheB24 and PheB25 are highlighted as black circles. This study focused on substitutions of TyrB26 (red circle); additional substitutions were made at position B29 (Nle; arrow) to facilitate semi-synthesis. B, ribbon model of insulin monomer (T state extracted from T6 zinc hexamer) (2). The A chain is shown in yellow and the B chain in black (B1–B19) and green (B20-B30). C, environment of TyrB26 (stereo). The side chain of TyrB26 is highlighted in red; IleA2, ValA3, ValB12, LeuB15, and PheB24 are as labeled. D, stick representation of residues B20–B27 (carbon atoms (green), nitrogen atoms (blue) and oxygen atoms (red)) packed between αCT and the L1-β2 sheet. B chain residues B8–B19 are shown as a black ribbon and the A chain as a yellow ribbon; residues A1–A3 are concealed behind the surface of αCT. Key contact surfaces of αCT with B24–B26 are highlighted in magenta, and L1 with B24–B26 are highlighted in cyan; L1 and αCT surfaces not in interaction with B24–B26 are shown in lighter shades. E, orthogonal view to D, showing interaction of the side chain of PheB24 with the nonpolar surface of the L1-β2 sheet. TyrB26 is hidden below the surface of αCT. Engagement of conserved residues A1–A3 against the nonpolar surface of αCT is shown at top. F, environment of TyrB26 within site 1 complex (stereo). Neighboring side chains in L1 and αCT are as labeled. Coordinates were obtained from PDB code 4OGA (39). G, model of wild-type insulin in its receptor-free conformation overlaid onto the structure of the insulin-bound μIR (71). The L1 domain and part of CR domain are shown in powder blue; αCT is shown in purple. Residues PheB24 and TyrB26 are as in A. The B chain of μIR-bound insulin is shown in dark gray (B6–B19); the brown tube indicates classical location within the overlay of residues B20–B30 of insulin in its receptor-free conformation, highlighting steric clash of B26–B30 with αCT. In the μIR co-crystal structure, insertion of the insulin B20–B27 segment between L1 and αCT peptide is associated with a small rotation of the B20–B23 β-turn and changes in main-chain dihedral angles flanking PheB24 (39). H, inverted V-shaped assembly of IR ectodomain homodimer. One monomer is in ribbon representation (labeled), the second in surface representation. Domains are labeled as follows: L1, first leucine-rich repeat domain; CR, cysteine-rich domain; L2, second leucine-rich repeat domain; FnIII-1, -2, and -3, first, second, and third fibronectin type III domains, respectively; ID, insert domain; and αCT, α-chain C-terminal segment. Coordinates were obtained from PDB code 4ZXB (42).
FIGURE 2.
FIGURE 2.
Quantum chemistry of iodo-aromatic system. A, Tyr side chain with iodine in its 3- or 5-ring position (green and yellow, in and out, respectively) with carbon-atom positions labeled. Rotation angles for rigid-body modeling involve rotations around the Cα–Cβ bond (χ1) and Cβ–Cγ bond (χ2). The insulin dimer with B26 side chains (red) and side chains of TyrB16, PheB24, PheB25, and their dimer-related mates (blue). The right-hand side provides a cross-eyed stereo view of the modified dimer with the B chain helix removed for clarity. B, electrostatic potential (ESP) surface maps of phenol, iodophenol, and iodophenyl at the 0.001 e bohr−3 isodensity. The color scale of the surface potential ranges from −2.12 e−2 (red) through 0 (green) to 2.12 e−2 (blue). In the upper row the iodine (facing the viewer) exhibits the effect of the electron-donating –OH on the σ-hole. The lower row shows effects of iodine on the π-system of the phenol ring. In the 1st row the surface is opaque, and in the 2nd row the surface is transparent. Angle β represents the σ-hole size as delimited by black dashed lines. δ+ and δ represent respective regions of positive and negative charge around the iodine. C, ESP contours of iodophenyl (left) and 2-iodophenol (right), at different isovalues, calculated in the plane of the aromatic ring. The halogen boundary represents a region of an electron isodensity of 10−3 e bohr3 (111). Isocontours in the left and right panels are at the same heights but in uneven separations. The σ-hole size, defined by an angle β (B), was calculated from the angular profile of the ESP on the intersection line of the 2D grid and halogen boundary where the ESP changes its sign (55); positive ESP and negative ESP regions are shown in blue and red, respectively. The black dashed arrow indicates directionality of the C–I bond.
FIGURE 3.
FIGURE 3.
Rigid-body modeling of 3- and 5-[iodo-TyrB26]insulin analogs. A, naive model of 3-[iodo-TyrB26]insulin highlights overlap of the iodine with the side chains of IleA2 and ValA3. B, analogous model of 5-[iodo-TyrB26]insulin exhibits clash with TyrB16′ and the backbone oxygen atom of GlyB20′. This view is slightly tilted relative to that in A to better illustrate the unfavorable contacts. C, conformational rotational maps for a PC representation of the B26 side chain around dihedral angles χ1 and χ2 for WT (left), 3-I-TyrB26 (middle), and 5-I-TyrB26 (right). The two energy scales highlight large (0–1000 kcal/mol) and finer energy differences (0–50 kcal/mol) relative to the global minimum. The zero of energy for WT and 3-I-TyrB26 is at 0 kcal/mol, whereas the minimum for 5-I-TyrB26 is relative to that of 3-I-TyrB26. The stars indicate one of the (χ12) conformations leading to severe steric clashes with neighboring residues. The geometries are at 〈157°, 84°〉, 〈176°, 83°〉, and 〈151°, 84°〉 for WT, 3-I, and 5-I, respectively, and the clashing residues are listed. D is as in C but for a relaxed scan over the (χ12) grid. The panels show only energies covering χ1 and χ2 intervals common to the three dimers as follows: [149°, 180°] for χ1 and [53°, 85°] for χ2. E and F contain respective rigid and relaxed conformational rotational maps for an MTP representation of the B26 side chain. G, corresponding structures in the neighborhoods of residue B26 (transparent red) highlighting residues affected by dihedral rotations of B26 (orange): left to right, WT insulin, 3-[iodo-TyrB26]insulin model, and 5-[iodo-TyrB26]insulin model.
FIGURE 4.
FIGURE 4.
Crystal structure of 3-[iodo-TyrB26,NleB29]Insulin. A, R6 hexamer with A and B chains (black and green ribbons, respectively). Iodine atoms (green spheres) and the two axial zinc ions (red spheres) are aligned at center, each coordinated by 3-fold-related HisB10 side chains (light gray). B, superposition of WT protomer (light gray) and 3-I-TyrB26 analog (dark gray). Side chains of TyrB26 and 3-I-TyrB26 are shown as sticks. For clarity, the iodine atom is shown as a transparent sphere; NleB29 is not shown.
FIGURE 5.
FIGURE 5.
Crystallographic features of R6 3-[iodo-TyrB26]insulin hexamer. A, (2FobsFcalc) difference σA-weighted electron density contoured at the 1σ level of a representative bound phenol molecule. Its para-OH group participates in hydrogen bonding with the carbonyl oxygen of CysA6 and amide proton of CysA11 (cystine A6–A11). An edge-to-face interaction occurs with the imidazole ring of HisB5 from another dimer. B, stereo view as in A aligning the structure of the analog (dark gray) with that of WT insulin as an R6 hexamer (light gray). C, electron density of 3-I-TyrB26 and surrounding residues. D, stereo view of residues seen in C (stick representation) superposed as in B. WT coordinates for B and D were obtained from PDB code 1ZNJ.
FIGURE 6.
FIGURE 6.
Side-chain arrangements within dimer interfaces. Residues B23–B26 are shown within respective crystal structures of the 3-[iodo-TyrB26,NleB29]insulin hexamer (A) and WT insulin R6 zinc hexamer (PDB code 1ZNJ) (B). The three subpanels within A and B correspond to the respective three copies of the dimer interface within the crystallographic asymmetric units of the two structures. Within each subpanel, the side-chain carbon atoms of PheB24 and its non-crystallographic symmetry equivalents are shown in green, of PheB25 and its non-crystallographic symmetry equivalents in orange, and of 3-I-TyrB26 or TyrB26 and their non-crystallographic symmetry equivalents in light purple, whereas all backbone atoms are in yellow, as are the side-chain atoms of ThrB27 and its non-crystallographic symmetry equivalents. The arrows on the right assist in identifying the direction of the respective polypeptides within each subpanel. Chains within each subpanel correspond (from left to right) to chains B, D, F, H, J, and L (respectively) within each structure. Overlaid on the three subpanels in A is σA-weighted (2FobsFcalc) difference electron density contoured at the 0.75 σ level and masked to within 2.5 Å of the side-chain atoms of PheB25 and its symmetry-related equivalents. The values displayed under the respective chains within the subpanels of B correspond to the side-chain occupancies of the PheB25 and its respective non-crystallographic symmetry equivalents within PDB code 1ZNJ. The side chain of NleB29 is not shown.
FIGURE 7.
FIGURE 7.
Homology model of μIR/insulin interface. Docked structure of 3-[iodo-TyrB26]insulin bound to L1 (Arg-14 and Gln-34) and αCT (Val-712) of the μIR. 5-[iodo-TyrB26]insulin has the iodine away from the interface (through rotation around the Cβ–Cγ axis (χ2 180°); see Fig. 2A) and is expected to interact less favorably with the μIR.
FIGURE 8.
FIGURE 8.
MD-based model of μIR/3-[iodo-TyrB26]insulin interface. A, structure of 3-[iodo-TyrB26]insulin bound to the μIR. Only μIR residues interacting with 3-I-TyrB26 are illustrated. Potential hydrogen/halogen bonds with iodine are shown as dashed arrows. B, probability distribution along the C-I···R distance, where R is (O=C(Val-365)) (red line); R is (H-Nϵ(Gln-81)) (green line); or R is (N2(Arg-61)) (dashed orange line). The upper panel is from simulations with MTP electrostatics, whereas the lower panel uses point charges. The black dashed lines at 4.1 Å (3.7 Å, lower panel) represents the C-I···O(Val-365) interaction limit using optimized van der Waals radii for the iodine and oxygen atoms. Dashed lines at 3.7 Å (3.3 Å, lower panel) indicate the C-I···H (Gln-34 and Arg-14) distance using optimized van der Waals radii for iodine and polar H-atoms. C, probability distribution of the halogen/hydrogen bond angular variation θC-·R from 1 ns of MD simulation. The black dashed line at 127° represents the boundary between the negative (δ < 127°) and positive electrostatic region (127° 〈δ+〉 233°) for I.
FIGURE 9.
FIGURE 9.
MD-based model of μIR/3-[iodo-TyrB26]insulin interface assuming neutral iodine. A, time evolution of the I···R distance (distance of TyrB26-I to the interacting insulin/μIR residues). The upper and lower panels show the increase of the I···O=C(Val-365), I···H-N(Arg-61), and I···H-N(Gln-81) bond lengths, respectively, and the decrease of the I···Cγ(LysB29), I···H-NE(His-79), I···Cα(ProB28), and I···O=C(ThrB27) bond lengths in the course of the MD simulation. The black dashed line at 150 ps represents the point when the electrostatically driven interactions dissociate and the van der Waal-driven interactions form. B, snapshot structure of 3-[iodo-TyrB26]insulin bound to the μIR. Only the residues interacting with 3-I-TyrB26 are illustrated. Bond formation/dissociation with the iodine atom are shown as full and dashed line arrows, respectively.
FIGURE 10.
FIGURE 10.
Aromatic-aromatic interactions. A, axes and definition of polar coordinates (r, φ, and θ) as originally defined by Burley and Petsko (44). Ψ provides the dihedral angle between the two planes formed by each of the aromatic rings. The two interacting aromatic rings are shown in red. B, interacting pairs of aromatic rings at the dimer interface of WT insulin and the 3-I-TyrB26 analog. Upper panel, PheB24/TyrB26, PheB24/PheB24′, PheB24/TyrB26, and TyrB26/TyrB16′; primed residue numbers indicate the dimer-related residue A representative WT structure (green) is overlaid in comparison with the side chains of the 3-[iodo-TyrB26,NleB29]insulin structure (cyan). Lower panel, PheB25/PheB25 interaction pair and its three possible conformations. Images of representative PheB25 side chains from the crystal structure of 3-I-TyrB26; the side chains of [NleB29]insulin are not shown due to dynamic disorder. WT coordinates were obtained from PDB code 1ZNJ.
FIGURE 11.
FIGURE 11.
Predicted water network at the μIR/insulin interface. A and B, local interaction at the interface around TyrB26 in WT insulin (A and C) and 3-I-TyrB26 insulin (B and D–F). The interactions involve Asp-12, Arg-14, and Gln-34 of L1; Val-712, Val-713, and Val-715 of αCT; and with PheB25 and TyrB26 of insulin. Naive WT interactions are shown as black dashed lines, and the newly introduced hydrogen-halogen interactions through the 3-I-TyrB26 mutation are shown as dashed purple lines. C–F, predicted water network at the μIR/insulin interface around TyrB26. C, formation of a water network anchored by the para-OH of TyrB26 and the carbonyl oxygens of Asn-711, Val-712, and Phe-714 (highlighted by green dashed lines) in WT. D–F, reinforcement of the pre-existing water network by interactions (yellow dashed lines) between the iodine and hydrogen atoms of three water molecules labeled Wat1, Wat2, and Wat3; Wat3 bridges the iodine and para-OH of the modified TyrB26 and the carboxyl oxygen of Asp-12 of the L1 domain (D); and Wat1 and Wat2 bridge the iodine atom to the carbonyl oxygen of Val-712 (E and F).

References

    1. Dodson G., and Steiner D. (1998) The role of assembly in insulin's biosynthesis. Curr. Opin. Struct. Biol. 8, 189–194 - PubMed
    1. Baker E. N., Blundell T. L., Cutfield J. F., Cutfield S. M., Dodson E. J., Dodson G. G., Hodgkin D. M., Hubbard R. E., Isaacs N. W., and Reynolds C. D. (1988) The structure of 2Zn pig insulin crystals at 1.5 Å resolution. Philos. Trans. R. Soc. Lond. B Biol. Sci. 319, 369–456 - PubMed
    1. Brange J., Ribel U., Hansen J. F., Dodson G., Hansen M. T., Havelund S., Melberg S. G., Norris F., Norris K., and Snel L. (1988) Monomeric insulins obtained by protein engineering and their medical implications. Nature 333, 679–682 - PubMed
    1. Inouye K., Watanabe K., Tochino Y., Kobayashi M., and Shigeta Y. (1981) Semisynthesis and properties of some insulin analogs. Biopolymers 20, 1845–1858 - PubMed
    1. Pandyarajan V., Smith B. J., Phillips N. B., Whittaker L., Cox G. P., Wickramasinghe N., Menting J. G., Wan Z.-L., Whittaker J., Ismail-Beigi F., Lawrence M. C., and Weiss M. A. (2014) Aromatic anchor at an invariant hormone-receptor interface function of insulin residue B24 with application to protein design. J. Biol. Chem. 289, 34709–34727 - PMC - PubMed

Publication types

MeSH terms