. 2016 Nov 22;11(11):e0167113.
doi: 10.1371/journal.pone.0167113. eCollection 2016.

The Perception of Physician Empathy by Patients with Inflammatory Bowel Disease

Affiliations

The Perception of Physician Empathy by Patients with Inflammatory Bowel Disease

Costanza Chiapponi et al. PLoS One. .

Abstract

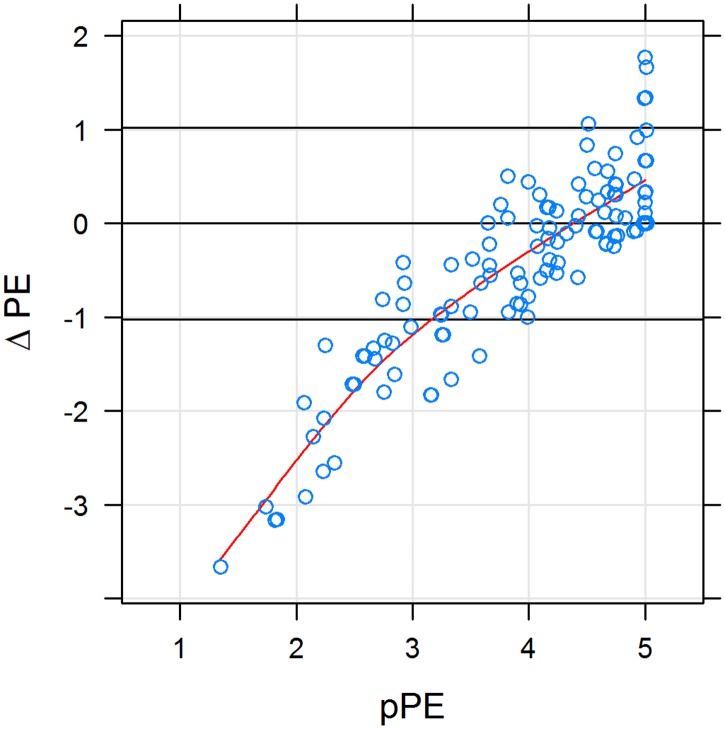
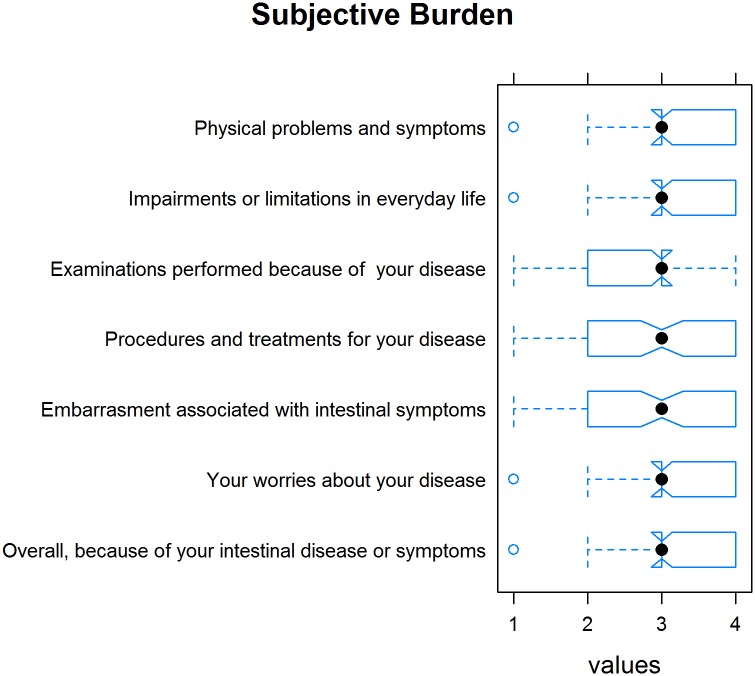
Background and aims: This study focused on the difference between perceived and desired physician empathy (pPE and dPE) in the eye of patients with inflammatory bowel disease (IBD). It was investigated if a discrepancy (ΔPE) correlates with trust and satisfaction of patients. At the same time the aim was to gain detailed information about the subjective burden of disease and the resources of IBD patients, in order to better understand them.

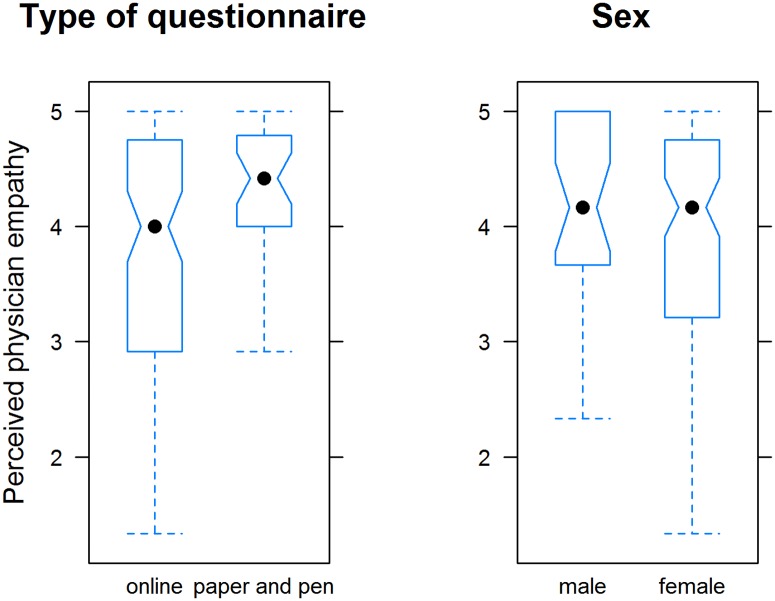
Methods: A modified version of the German Version of the Consultation and Relational Empathy (CARE) measure was completed as a paper-and-pencil questionnaire by IBD patients attending our facility (n = 32) and as an online survey by IBD patients at other locations throughout Germany (n = 89). Patients were in average 36.3±12 years old.

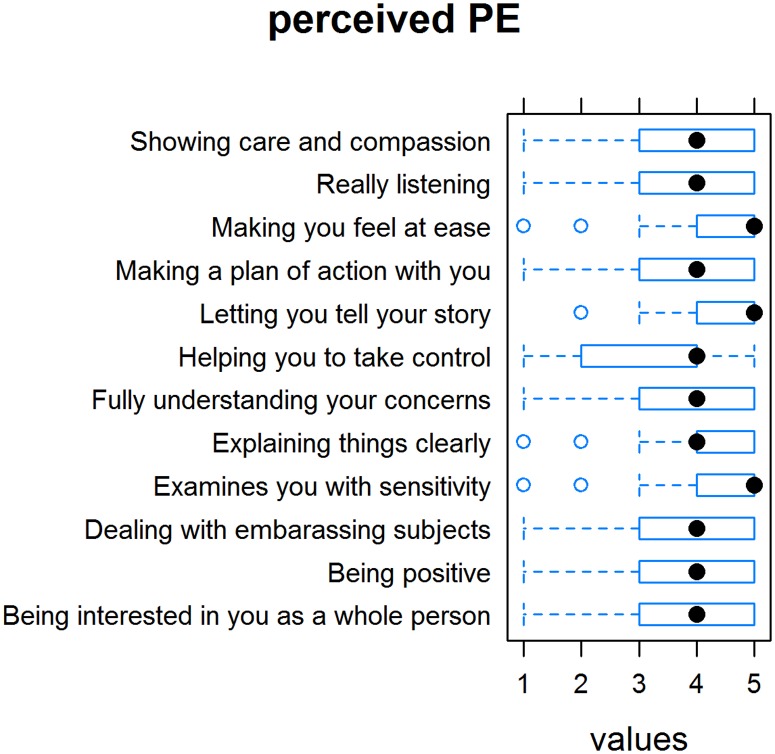
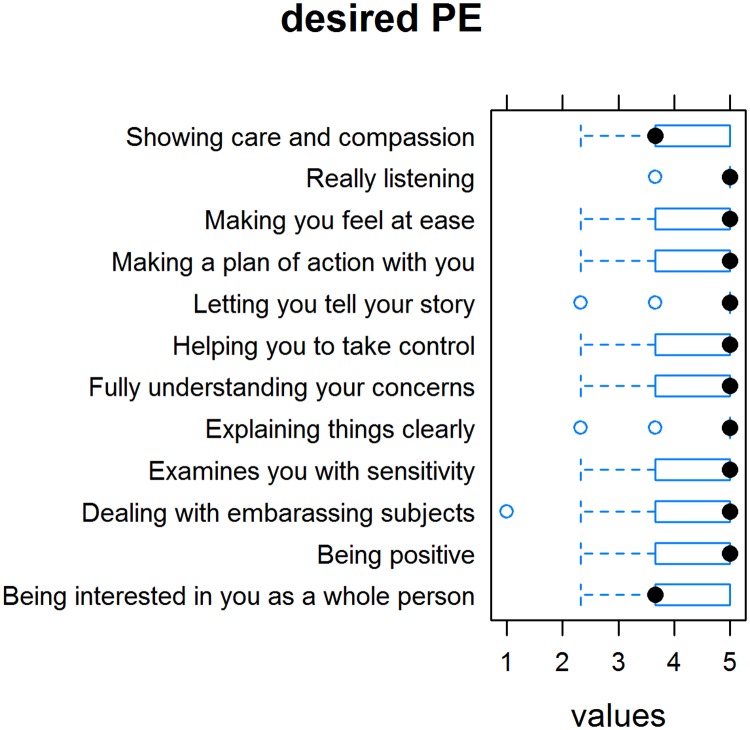
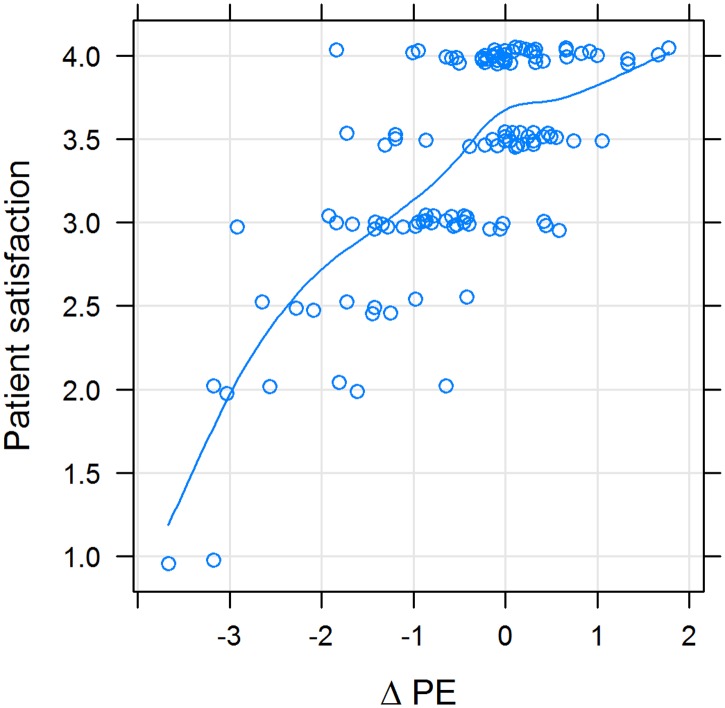
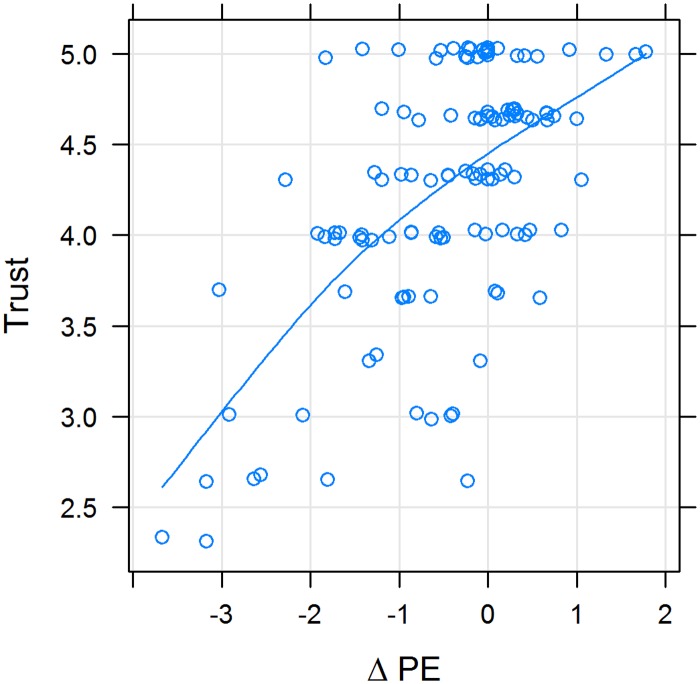
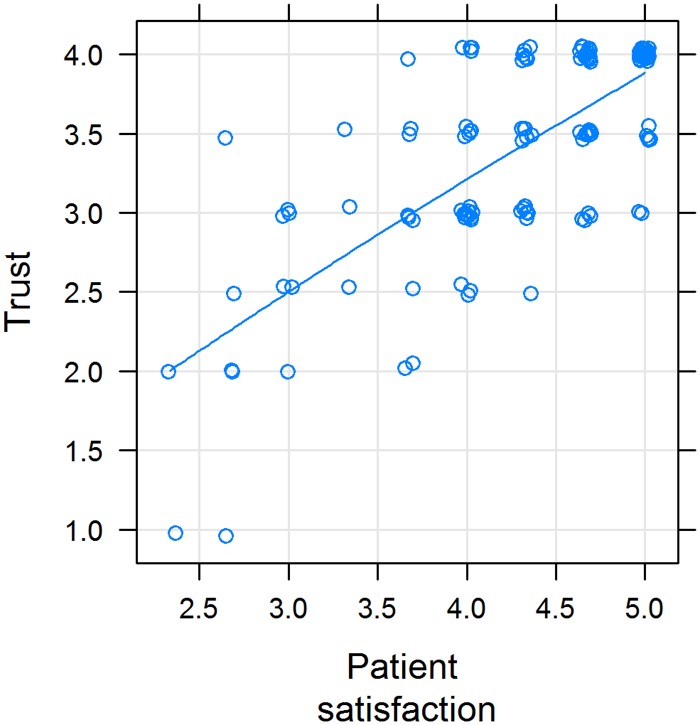
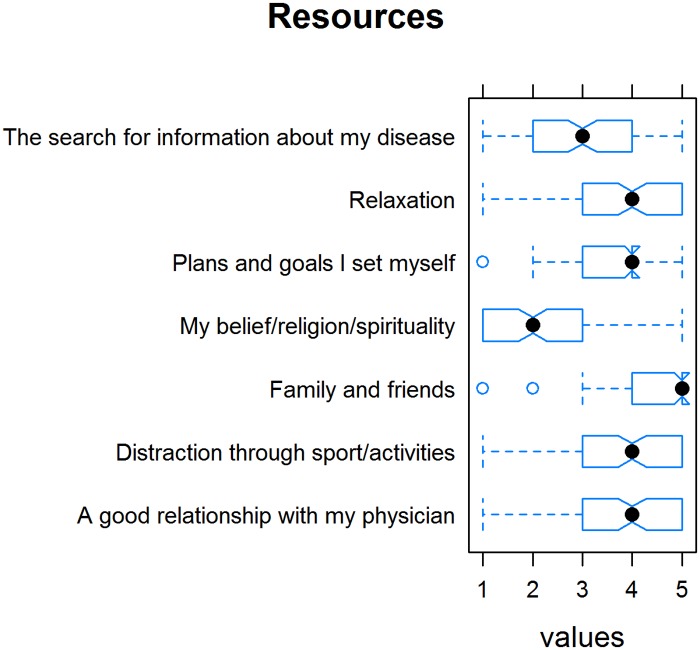
Results: The mean (SD) rating of pPE was 3.93 (0.96) on a scale of 1 to 5 ("poor" to "excellent"); however, the mean (SD) dPE was 4.38 (0.48) on the same scale. ΔPE correlated with perceived empathy and with patients' satisfaction with treatment and trust in their health care providers. Patients reported quite a high subjective burden (mean [SD]: 2.93 [.63]) and named family, friends, and support groups as resources.

Conclusions: Rather than assessing patient satisfaction with treatment and trust in their physician only with perceived PE, we suggest ΔPE as a useful additional parameter.


Conflict of interest statement

The authors have declared that no competing interests exist.

Figures

Fig 1
Fig 1. Perceived physician empathy as assessed by the Consultation and Relational Empathy (CARE) measure; Tukey’s box plots.
Left: The questionnaire was administered as either an online or a paper-and-pen version; the difference was statistically significant (p <0.001; Mann-Whitney U test). Right: Sex of patients; no difference.
Fig 2
Fig 2. Ratings of “perceived empathy” items on the Consultation and Relational Empathy (CARE) measure.
Fig 3
Fig 3. Rating of “desired empathy” items on the Consultation and Relational Empathy (CARE) measure.
Fig 4
Fig 4. Difference between desired and perceived physician empathy (ΔPE) as a function of perceived physician empathy (pPE).
X-Y scatterplot; horizontal lines denote equality between desired and perceived physician empathy plus or minus 1 standard deviation. Red curve is a cubic spline fit. Perceived physician empathy and ΔPE were strongly correlated (Spearman’s rho = 0.83; p < 10−15). Desired and perceived physician empathy were balanced if perceived physician empathy was > 4. In 28 subjects, ΔPE was 1 SD below zero, and in 5 cases it was 1 SD above.
Fig 5
Fig 5. Patient satisfaction with the physician as a function of the difference between desired and perceived physician empathy (ΔPE); X-Y scatterplot.
Variables were positively correlated (rho = 0.47; p < 10−10). The line represents a cubic smoothing spline fit. If ΔPE was negative, patient satisfaction was low and rose steeply; and if it was positive, patient satisfaction rose less steeply.
Fig 6
Fig 6. Association between trust in the physician (Trust) and the difference between desired and perceived physician empathy (ΔPE); X-Y scatterplot.
Variables were positively correlated (rho = 0.32; p < 10−7). The line represents a cubic smoothing spline fit.
Fig 7
Fig 7. Association between trust in the physician (Trust) and patient satisfaction; X-Y scatterplot.
Variables were positively correlated (rho = 0.66; P value < 2.2e-16). The line represents a cubic smoothing spline fit.
Fig 8
Fig 8. Tukey’s box plots with a notch depicting the subjective burden of various aspects of the disease and their ratings.
Fig 9
Fig 9. Tukey’s box plots with a notch depicting patient resources and their ratings.

References

    1. Nyuyki KD, Pittman QJ, Toward a better understanding of the central consequences of intestinal inflammation. Ann N Y Acad Sci. 2015. September;1351:149–54. 10.1111/nyas.12935 - DOI - PubMed
    1. Matsumoto T, Yanai S, Toya Y, Internet-orientated Assessment of QOL and Actual Treatment Status in Japanese Patients with Inflammatory Bowel Disease: The 3I survey. J Crohns Colitis. 2015. June;9(6):477–82. 10.1093/ecco-jcc/jjv052. Epub 2015 Mar 26. - DOI - PubMed
    1. Mocciaro F, Di Mitri R, Russo G, Leone S, Quercia V, Motivational interviewing in inflammatory bowel disease patients: a useful tool for outpatient counselling. Dig Liver Dis. 2014. October;46(10):893–7. 10.1016/j.dld.2014.07.009. Epub 2014 Jul 30. - DOI - PubMed
    1. Mercer SW, Reynolds WJ. Empathy and quality of care. Br J Gen Pract. 2002;52:S9–12. - PMC - PubMed
    1. Reynolds WJ, Scott B. Do nurses and other professional helpers normally display much empathy? J Adv Nurs. 2000. January;31(1):226–34. - PubMed