

Logic models to predict continuous outputs based on binary inputs with an application to personalized cancer therapy
- PMID: 27876821
- PMCID: PMC5120272
- DOI: 10.1038/srep36812
Logic models to predict continuous outputs based on binary inputs with an application to personalized cancer therapy
Abstract
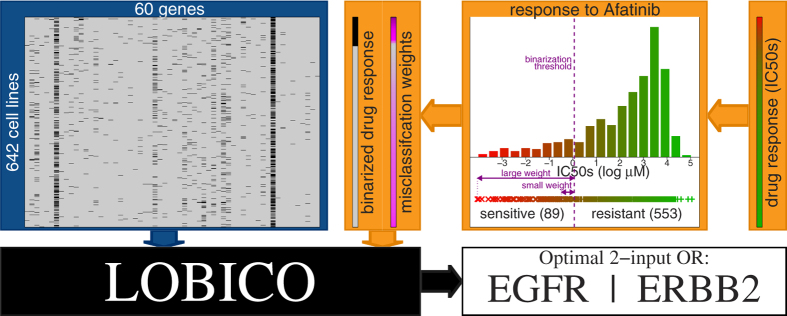
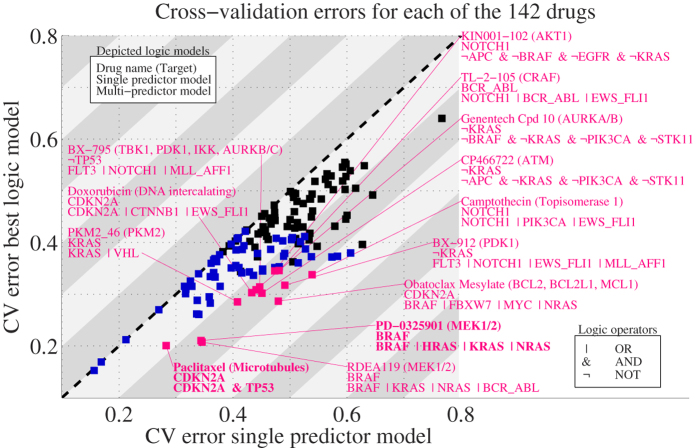
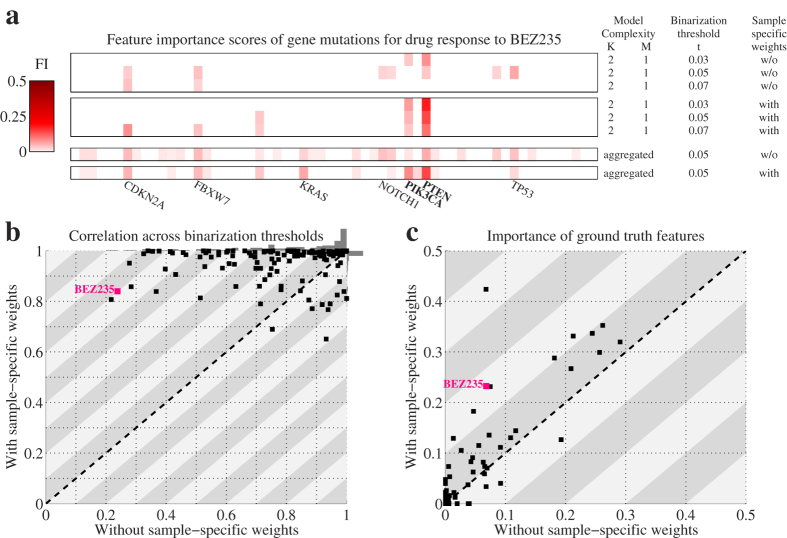
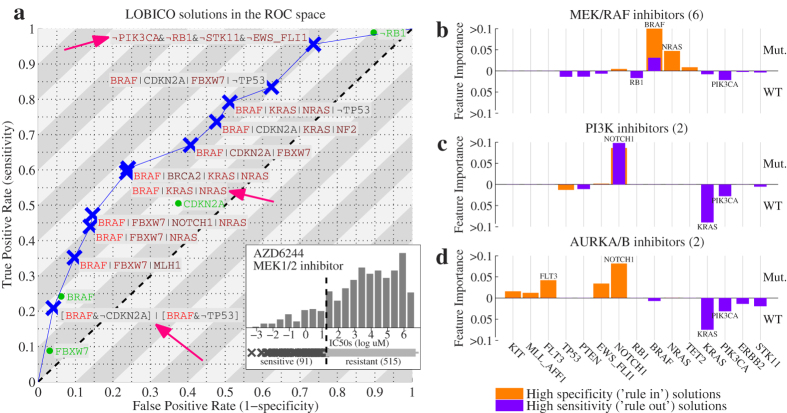
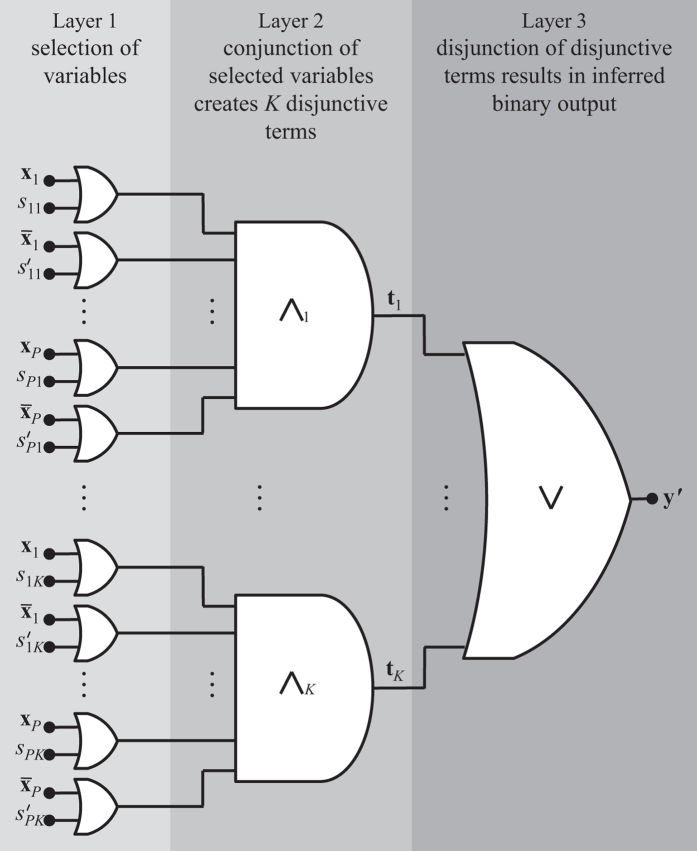
Mining large datasets using machine learning approaches often leads to models that are hard to interpret and not amenable to the generation of hypotheses that can be experimentally tested. We present 'Logic Optimization for Binary Input to Continuous Output' (LOBICO), a computational approach that infers small and easily interpretable logic models of binary input features that explain a continuous output variable. Applying LOBICO to a large cancer cell line panel, we find that logic combinations of multiple mutations are more predictive of drug response than single gene predictors. Importantly, we show that the use of the continuous information leads to robust and more accurate logic models. LOBICO implements the ability to uncover logic models around predefined operating points in terms of sensitivity and specificity. As such, it represents an important step towards practical application of interpretable logic models.
Figures
Similar articles
-
MERIDA: a novel Boolean logic-based integer linear program for personalized cancer therapy.Bioinformatics. 2021 Nov 5;37(21):3881-3888. doi: 10.1093/bioinformatics/btab546. Bioinformatics. 2021. PMID: 34352075 Free PMC article.
-
Open source machine-learning algorithms for the prediction of optimal cancer drug therapies.PLoS One. 2017 Oct 26;12(10):e0186906. doi: 10.1371/journal.pone.0186906. eCollection 2017. PLoS One. 2017. PMID: 29073279 Free PMC article.
-
Cancer Cell Line Panels Empower Genomics-Based Discovery of Precision Cancer Medicine.Yonsei Med J. 2015 Sep;56(5):1186-98. doi: 10.3349/ymj.2015.56.5.1186. Yonsei Med J. 2015. PMID: 26256959 Free PMC article. Review.
-
DISIS: prediction of drug response through an iterative sure independence screening.PLoS One. 2015 Mar 20;10(3):e0120408. doi: 10.1371/journal.pone.0120408. eCollection 2015. PLoS One. 2015. PMID: 25794193 Free PMC article.
-
Machine learning and data mining frameworks for predicting drug response in cancer: An overview and a novel in silico screening process based on association rule mining.Pharmacol Ther. 2019 Nov;203:107395. doi: 10.1016/j.pharmthera.2019.107395. Epub 2019 Jul 30. Pharmacol Ther. 2019. PMID: 31374225 Review.
Cited by
-
Deep learning methods for drug response prediction in cancer: Predominant and emerging trends.Front Med (Lausanne). 2023 Feb 15;10:1086097. doi: 10.3389/fmed.2023.1086097. eCollection 2023. Front Med (Lausanne). 2023. PMID: 36873878 Free PMC article. Review.
-
SuperDendrix algorithm integrates genetic dependencies and genomic alterations across pathways and cancer types.Cell Genom. 2022 Feb 9;2(2):100099. doi: 10.1016/j.xgen.2022.100099. Cell Genom. 2022. PMID: 35382456 Free PMC article.
-
Computational frameworks transform antagonism to synergy in optimizing combination therapies.NPJ Digit Med. 2025 Jan 19;8(1):44. doi: 10.1038/s41746-025-01435-2. NPJ Digit Med. 2025. PMID: 39828791 Free PMC article. Review.
-
Deep reinforcement learning for personalized treatment recommendation.Stat Med. 2022 Sep 10;41(20):4034-4056. doi: 10.1002/sim.9491. Epub 2022 Jun 18. Stat Med. 2022. PMID: 35716038 Free PMC article.
-
Personalized logical models to investigate cancer response to BRAF treatments in melanomas and colorectal cancers.PLoS Comput Biol. 2021 Jan 28;17(1):e1007900. doi: 10.1371/journal.pcbi.1007900. eCollection 2021 Jan. PLoS Comput Biol. 2021. PMID: 33507915 Free PMC article.
References
-
- Zou H. & Hastie T. Regularization and variable selection via the elastic net. Journal of the Royal Statistical Society: Series B (Statistical Methodology) 67, 301–320 (2005).
-
- Breiman L. Random forests. Machine learning 45, 5–32 (2001).
-
- Ruczinski I., Kooperberg C. & LeBlanc M. Logic regression. Journal of Computational and Graphical Statistics 12, 475–511 (2003).
-
- Kooperberg C. & Ruczinski I. Identifying interacting SNPs using Monte Carlo logic regression. Genetic epidemiology 28, 157–170 (2005). - PubMed
Publication types
MeSH terms
Substances
Grants and funding
LinkOut - more resources
Full Text Sources
Other Literature Sources
Research Materials
