Comparative Study
. 2016 Nov 23:6:37243.
doi: 10.1038/srep37243.

Alignment-free Transcriptomic and Metatranscriptomic Comparison Using Sequencing Signatures with Variable Length Markov Chains

Affiliations
Comparative Study

Alignment-free Transcriptomic and Metatranscriptomic Comparison Using Sequencing Signatures with Variable Length Markov Chains

Weinan Liao et al. Sci Rep. .

Abstract

The comparison between microbial sequencing data is critical to understand the dynamics of microbial communities. The alignment-based tools analyzing metagenomic datasets require reference sequences and read alignments. The available alignment-free dissimilarity approaches model the background sequences with Fixed Order Markov Chain (FOMC) yielding promising results for the comparison of microbial communities. However, in FOMC, the number of parameters grows exponentially with the increase of the order of Markov Chain (MC). Under a fixed high order of MC, the parameters might not be accurately estimated owing to the limitation of sequencing depth. In our study, we investigate an alternative to FOMC to model background sequences with the data-driven Variable Length Markov Chain (VLMC) in metatranscriptomic data. The VLMC originally designed for long sequences was extended to apply to high-throughput sequencing reads and the strategies to estimate the corresponding parameters were developed. The flexible number of parameters in VLMC avoids estimating the vast number of parameters of high-order MC under limited sequencing depth. Different from the manual selection in FOMC, VLMC determines the MC order adaptively. Several beta diversity measures based on VLMC were applied to compare the bacterial RNA-Seq and metatranscriptomic datasets. Experiments show that VLMC outperforms FOMC to model the background sequences in transcriptomic and metatranscriptomic samples. A software pipeline is available at https://d2vlmc.codeplex.com.


Figures

Figure 1
Figure 1. The clustering trees based on different models for the 90 simulation samples in Experiment 1.
(a) The best clustering tree on VLMC. (b) The best clustering tree when using FOMC and lp-norm measures. *Samples are divided into three groups A–C. Each group has 30 samples numbered from 0 to 29.
Figure 2
Figure 2. The reference tree and the best clustering trees based on VLMC and FOMC models for 18 RNA-Seq data in Experiment 2.
(a) The molecular phylogenic tree of the 18 RNA-seq built with Maximum likelihood method on the 18S rRNA genes. (b) The best clustering tree with VLMC. (c) The best clustering tree when using FOMC and Lp-norm measures. *Samples are labeled as the Organisms-Strain-18S rRNA. For example, Micromonas pusilla CCAC1681 [FN562452] represents the organism Micromonas pusilla from strain CCAC1681 and the 18S rRNA used to construct this ML tree is FN562452. Details about sample labels can be found in Supplementary Table S4 in section 2.
Figure 3
Figure 3. Locations of the 88 metatranscriptomic samples from global ocean, the reference tree, and the clustering trees based on different dissimilarity measures and background sequence models in Experiment 3.
(a) The distribution of the collecting locations. The map is based on OpenStreetMap and the cartography in the OpenStreetMap map tiles is licensed under CCBY-SA (www.openstreetmap.org/copyright). The license terms can be found on the link: http://creativecommons.org/licenses/by-sa/2.0/. The location labels are marked with the coordinates of sample-collecting locations in Supplementary Table S4 in section 2. (b) The clustering tree with VLMC using formula image 
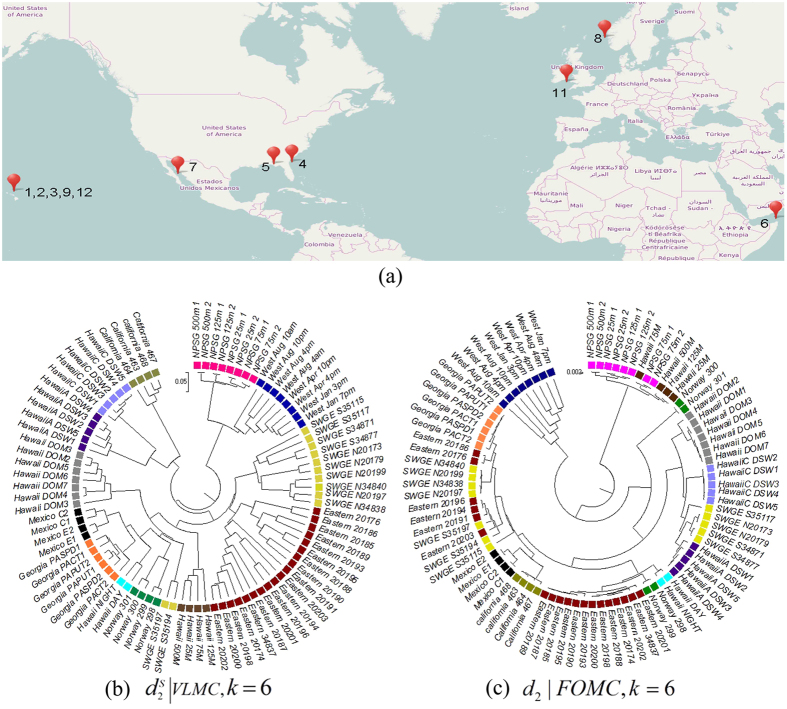
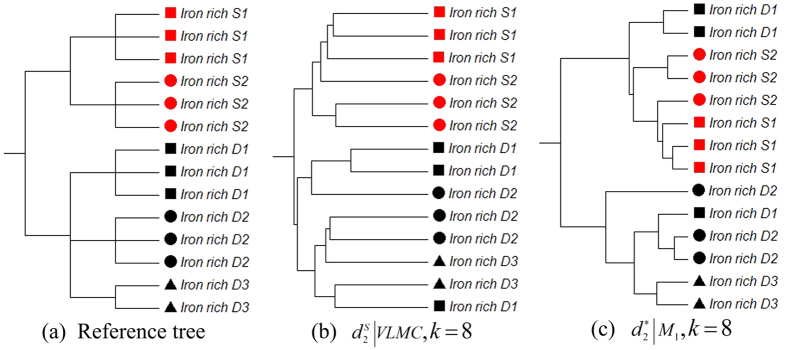
and k = 6. (c) The clustering tree with FOMC using formula image and k = 6. *‘SWGE’ (Dataset 10 in Supplemental Table S4 in section 2) samples were collected from different locations with two research cruises in the Equatorial North Atlantic Ocean and South Pacific Subtropical gyre.
Figure 4
Figure 4. The reference and clustering trees based on various models for different depths of metatranscriptomic marine samples in Experiment 4.
(a) Reference tree of different depths of metatranscriptomic samples from the ocean. (b) The best clustering tree with VLMC background sequence model. (c) The best clustering tree when using FOMC and lp-norm measures.
Figure 5
Figure 5. Reference and clustering trees based on different background sequence models for the metatranscriptomic mat samples in Experiment 5.
(a) Reference tree of the microbial mat data in experiment 5. (b) The best clustering tree with the VLMC background sequence model. (c) The best clustering tree with the FOMC background sequence model and lp-norm measures.
Figure 6
Figure 6. PCA ordinates of samples in Experiment 5.
(a) Two-dimensional PCA plot based on FOMC. (b) Two-dimensional PCA plot based on VLMC.
Figure 7
Figure 7. Flow chart of our approach:
(1) The frequency vector of 1–10 tuples is generated from the sequencing data. (2) Markov transition probability of each tuple is calculated based on VLMC, and different dissimilarity measures are applied to k-tuple sequence signature. (3) Measured dissimilarities are evaluated. We used UPGMA for hierarchical clustering based on dissimilarity matrix and applied the triples distance to evaluate the consistency between the reference and the clustering trees.
Figure 8
Figure 8. Flow chart showing the construction of VLMC based on high-throughput sequencing data.
(A) Construction of the prefix tree. (B) Pruning of the prefix tree. (C) Calculation of probability based on the pruned (or context) tree.
Figure 9
Figure 9. Probability density distributions of 22 Marine Microbial Eukaryotes RNA-Seq data.

Similar articles

Cited by

References

    1. Wang Y., Liu L., Chen L., Chen T. & Sun F. Comparison of metatranscriptomic samples based on k-tuple frequencies. PloS One 9, e84348 (2014). - PMC - PubMed
    1. Smith T. F. & Waterman M. S. Identification of common molecular subsequences. Journal of Molecular Biology 147, 195–197 (1981). - PubMed
    1. Altschul S. F., Gish W., Miller W., Myers E. W. & Lipman D. J. Basic local alignment search tool. Journal of Molecular Biology 215, 403–410 (1990). - PubMed
    1. Wood D. E. & Salzberg S. L. Kraken: ultrafast metagenomic sequence classification using exact alignments. Genome Biology 15 (2014). - PMC - PubMed
    1. Ounit R., Wanamaker S., Close T. J. & Lonardi S. CLARK: fast and accurate classification of metagenomic and genomic sequences using discriminative k-mers. BMC Genomics 16 (2015). - PMC - PubMed

Publication types

LinkOut - more resources