. 2016 Nov 23:6:37522.
doi: 10.1038/srep37522.

Persistent northward North Atlantic tropical cyclone track migration over the past five centuries

Affiliations

Persistent northward North Atlantic tropical cyclone track migration over the past five centuries

Lisa M Baldini et al. Sci Rep. .

Abstract

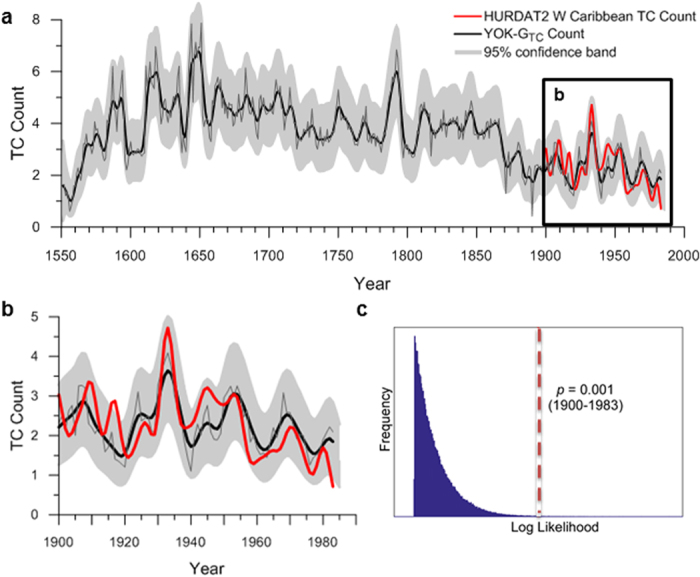
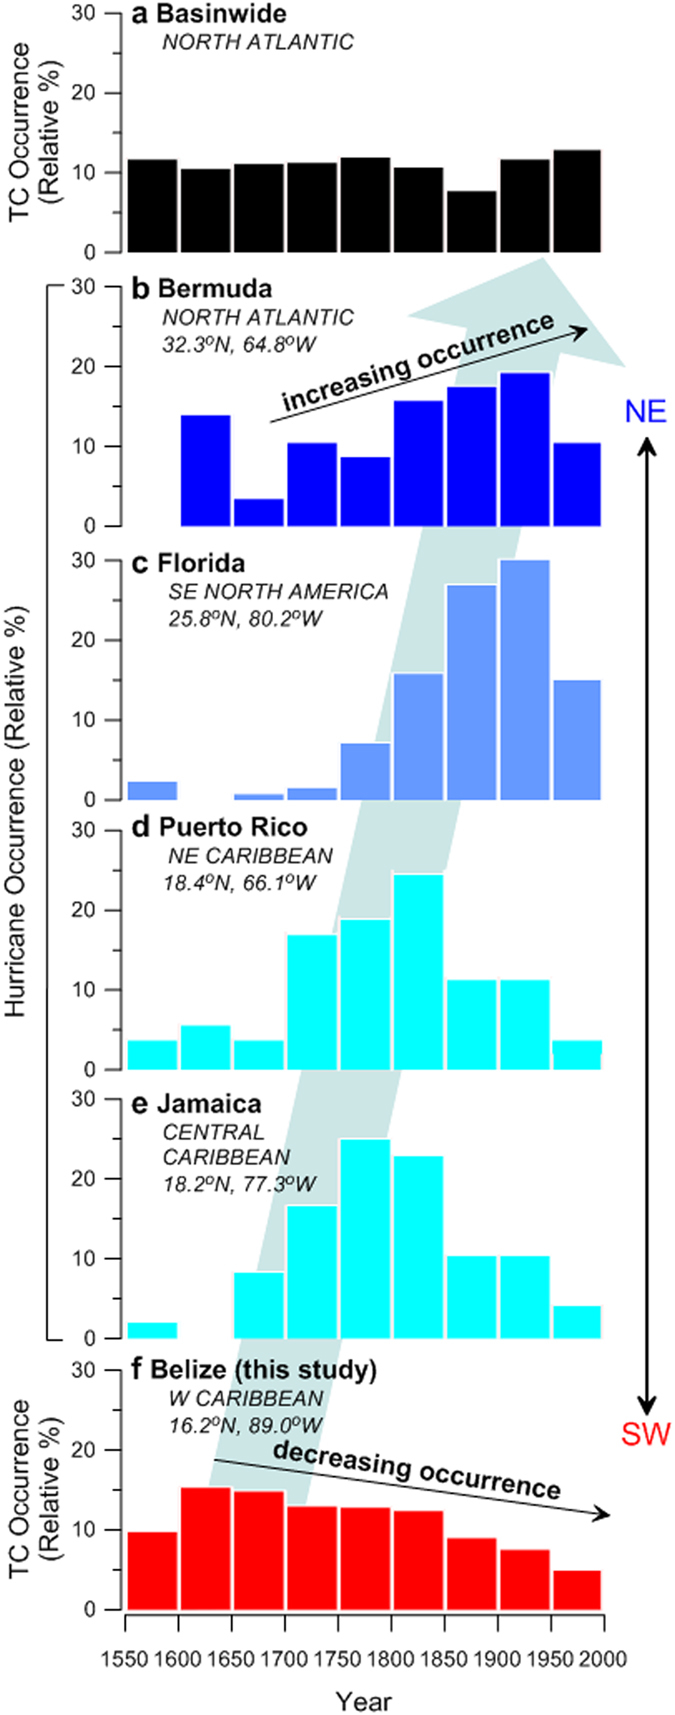
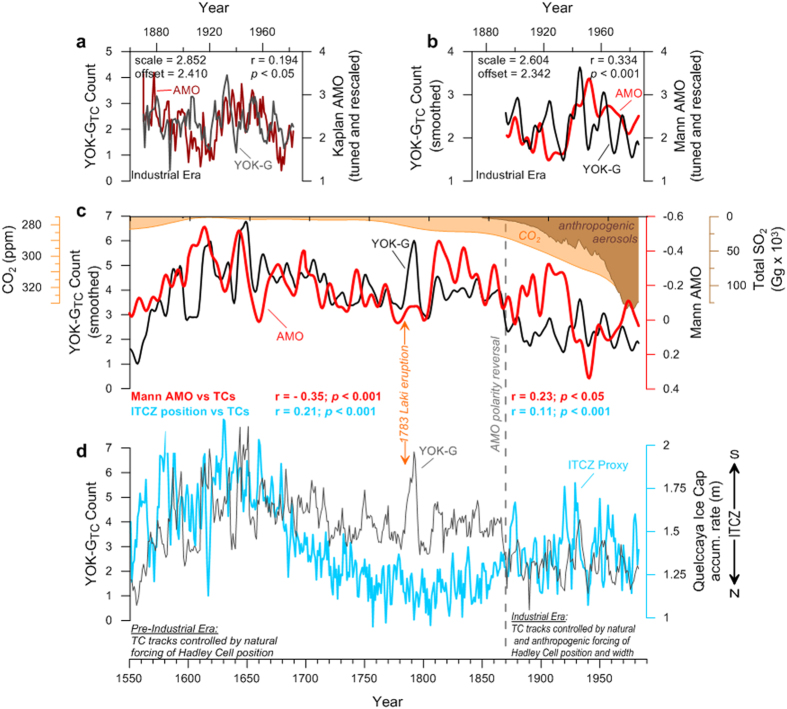
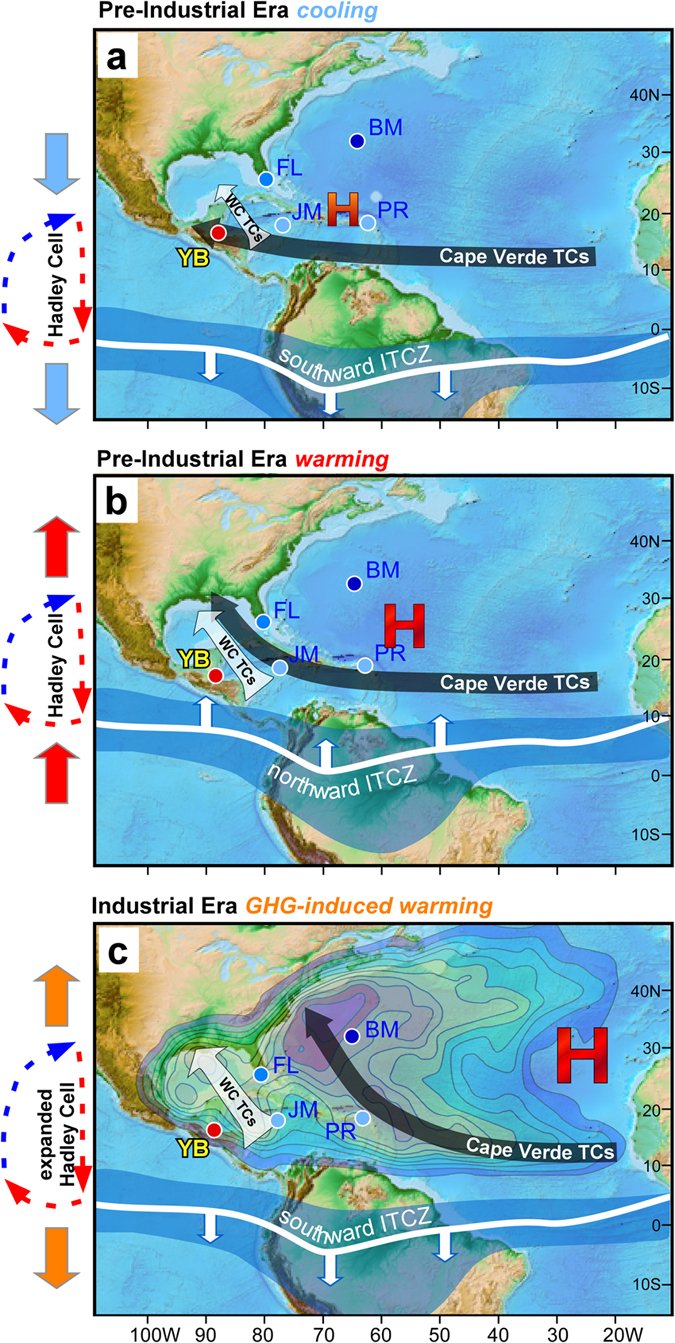
Accurately predicting future tropical cyclone risk requires understanding the fundamental controls on tropical cyclone dynamics. Here we present an annually-resolved 450-year reconstruction of western Caribbean tropical cyclone activity developed using a new coupled carbon and oxygen isotope ratio technique in an exceptionally well-dated stalagmite from Belize. Western Caribbean tropical cyclone activity peaked at 1650 A.D., coincident with maximum Little Ice Age cooling, and decreased gradually until the end of the record in 1983. Considered with other reconstructions, the new record suggests that the mean track of Cape Verde tropical cyclones shifted gradually north-eastward from the western Caribbean toward the North American east coast over the last 450 years. Since ~1870 A.D., these shifts were largely driven by anthropogenic greenhouse gas and sulphate aerosol emissions. Our results strongly suggest that future emission scenarios will result in more frequent tropical cyclone impacts on the financial and population centres of the northeastern United States.


Figures

Figure 1
Figure 1. The YOK-GTC reconstruction and observational record calibration.
(a) The smoothed (black curve) and unsmoothed (grey curve) YOK-GTC reconstruction back to 1550 A.D. (b) Modern calibration with the HURDAT2 western Caribbean TC count (red curve) from 1900 to 1983. Shading in a and b indicates the 95% confidence band. (c) Histogram of the log likelihood values versus frequency. The dashed red line represents the log likelihood (probability) that the actual data correlates with the HURDAT2 western Caribbean TC count by chance (p = 0.001).
Figure 2
Figure 2. The YOK-GTC reconstruction compared to documentary records of hurricane landfall in the Caribbean and North Atlantic Basins.
Frequency distributions (relative %) of hurricanes affecting (a) the entire North Atlantic Basin and locations along the western margin of the North Atlantic (b) Bermuda, (c) Florida, (d) Puerto Rico, and (e) Jamaica, calculated from previously published documentary data. Data are presented in 50-year time slices between 1551 and 1998, and are compared to the frequency distribution of TCs affecting (f) Belize (this study). The relative % occurrence for each site represents the total number of storms recorded during each 50-year time slice compared with the total number of storms that impacted the site since 1551 A.D. Because the YOK-GTC record terminates at 1983, the final 1951 to 1998 time slice presented in (f) is based on the HURDAT2 western Caribbean TC count. The blue arrow illustrates the north-eastward progression of mean TC track schematically. The apparent decrease in relative % hurricane occurrence at all sites since 1950 is a result of numerous storms that passed within 320 km of Florida and Bermuda since 1950 but not close enough to affect the observational record (see Supplementary Information).
Figure 3
Figure 3. The YOK-GTC reconstruction compared to two AMO indices and a proxy of ITCZ position.
(a) The Kaplan SST AMO Index and (b) the Mann et al. AMO Index rescaled to have the same mean and standard deviation as the YOK-GTC count and tuned within errors to reveal optimal fit parameters over the Instrumental interval. (c) The multi-decadally smoothed YOK-GTC count (thick black curve) compared to the Mann et al. multi-decadally smoothed AMO reconstruction (red curve). Also shown are the 75-yr smoothed historical CO2 record from the Law Dome ice core, Antarctica, (orange shaded curve) and total anthropogenic SO2 emissions since 1850 (brown shaded curve). The approximate timing of the polarity reversal discussed in the text is represented by the dashed grey line at 1870. Note that the records are not tuned as in a and b, and that the axis for the AMO record is inverted to that in (b). (d) The annually resolved YOK-GTC count (thin dark grey curve) compared to the 3-yr moving average of the Quelccaya Ice Cap (Peru) accumulation rate (in meters water equivalent per year) as a proxy for ITCZ position. An increased ice accumulation rate occurs when the ITCZ is positioned southward over Peru. The results of linear least squares regression analysis are shown. Regression results in (c) and (d) are based on 5-yr moving averages of the datasets.
Figure 4
Figure 4. Generalised TC track migration patterns during the pre- and post-1870 intervals.
Mean track of Cape Verde TCs (long black arrow) and the positions of the ITCZ (blue band) and the Bermuda High (red ‘H’) during (a) pre-Industrial LIA cooling, (b) pre-Industrial (post-LIA) warming, and (c) post-1870 GHG warming. Sites discussed in Fig. 3 are marked by circles (Yok Balum Cave (YB), Jamaica (JM), Puerto Rico (PR), Florida (FL), and Bermuda (BM)). Colour contours in (c) represent the likelihood a TC will occur during the Atlantic hurricane season (June 1–November 30) for the period 1944 to 1999 (adapted from ref. 60). The location and size of the red ‘H’s in a-c approximate BH position and strength, respectively. The position of the BH in (c) is based on 20th Century Reanalysis V2 wind vector data. ITCZ latitudinal position and shape is approximated from previous work. The base map was derived from the ETOPO1 1 Arc-Minute Global Relief Model. The size of the light grey arrows in a-c represents the relative importance of western Caribbean cyclogenesis during each interval schematically.

References

    1. Bender M. A. et al. Modeled impact of anthropogenic warming on the frequency of intense Atlantic hurricanes. Science 327, 454–458 (2010). - PubMed
    1. Elsner J. B., Trepanier J. C., Strazzo S. E. & Jagger T. H. Sensitivity of limiting hurricane intensity to ocean warmth. Geophys. Res. Lett. 39 (2012).
    1. Kossin J. P., Olander T. L. & Knapp K. R. Trend analysis with a new global record of tropical cyclone intensity. J. Clim. 26, 9960–9976 (2013).
    1. Kossin J. P., Emanuel K. A. & Vecchi G. A. The poleward migration of the location of tropical cyclone maximum intensity. Nature 509, 349–355 (2014). - PubMed
    1. van Hengstum P. J. et al. The intertropical convergence zone modulates intense hurricane strikes on the western North Atlantic margin. Sci. Rep. 6, 21728 (2016). - PMC - PubMed

Publication types

LinkOut - more resources